3
Growth Begins
Since its founding, the United States has changed from a rural to an urban nation. The most important city, New York, probably contained fewer than 22,000 people at the time of the Revolution. And only one person in twenty lived in a place with a population greater than 2,500—a size even then hardly considered urban. The course of the nineteenth century saw the North American landscape literally transformed by urbanization. But so, for that matter, was most of the Western world: compared to Britain, for instance, the United States has always been less urban. Thus while urbanization represents a dramatic change, it would have been far more remarkable for the United States to have stayed rural. As early as 1872 political leaders recognized implicitly that the city had become the main mode of existence, when they made Yellowstone the country's first national park, setting an early precedent for preserving uncultivated, nonurban areas for future, urban generations. The urban transformation of the United States is mainly remarkable in that it constructed so many new cities, while in Britain the process was much more one of expanding preexisting places.[1] In concentrating on a quantitative understanding, this chapter exemplifies the statistical approach to cities, updated with a healthy dose of recent attitudes and techniques. Just how much we can learn from simple numbers arrayed through time? Quite a bit—perhaps more than one has any right to expect.
The Changing Proportion of Population Living in Cities
Let us begin by examining figure 2, which shows the percentage of the total population living in places with more than
2,500 people and in places larger than 100,000. The smaller value has long been considered the lowest threshold of what could be called a city: though arguably too small, it is a useful definition in its consistency, since it has now been applied by the various data gathering agencies of the U.S. government for almost two centuries. The larger value of 100,000 probably corresponds more to our contemporary sense of what constitutes a "real city," a minimally sized metropolis. The threshold value for the population characterizing a city, or village, or metropolis, is an elusive, perhaps shifting, and certainly much vexed question. It is therefore important to stress that such definitions are most useful in sketching large pictures of the world of cities, using sharp lines to suggest fuzzy concepts.[2]
After a slight initial urban expansion at the beginning of the nineteenth century, the urban population stayed relatively stable until about 1830, when it began a century-long burst of continuous expansion until 1930. The damper of the Great Depression proved to be the precursor of a general decline in urbanization's pace, so that it now appears that the demographic aspect of the urban transition—the creation of a largely urban populace—has been completed. One may therefore read figure 2 as delineating three urban eras: the first up to 1830, the second that of a century of expansion ending with the Depression, and the third, a period of relative stability.
The plot of the percentage of population in cities over 100,000 suggests that this three-phase process of urbanization was even more distinct for larger, metropolitan populations. In the first phase, up to 1830, there were no cities over 100,000. The second phase, lasting a century, saw the metropolitan population climb steadily to somewhat over one-fourth of the total population. And since 1930 this metropolitan population has remained steady or even declined slightly.
Some additional numbers, not shown on the graph, fill out the picture. The percentage of the population living in cities over a million highlights the process that has fostered the growth of middle-sized cities and small metropolises. In 1880, only 3.4 percent of the population lived in cities over a million. This percentage peaked in 1930 at 13.3 percent, and then it began a steady and consistent decline to 7.7 percent in 1980, a proportion lower than that at the beginning of the twentieth century.
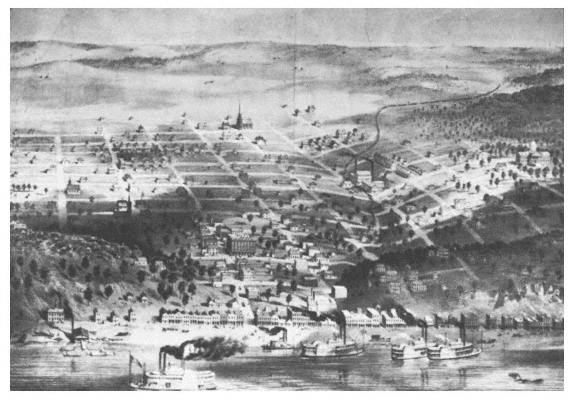
Sumner, Kansas, 1857.
This view is an artist's speculative vision, a crudely drawn sketch conforming
only to the grandiose plans of city building entrepreneurs; only a
few of these buildings were ever built. The blowing smoke tells us it was
a windy day in the artist's mind: but such was the bustle of this town-to-
be that a steamboat on the river doubled the speed of the wind, giving a
Daliesque vision of smoke blowing both ways in the foreground. Today
there are nine Sumners in the United States, but this is not one.
Source: Kansas State Historical Society.
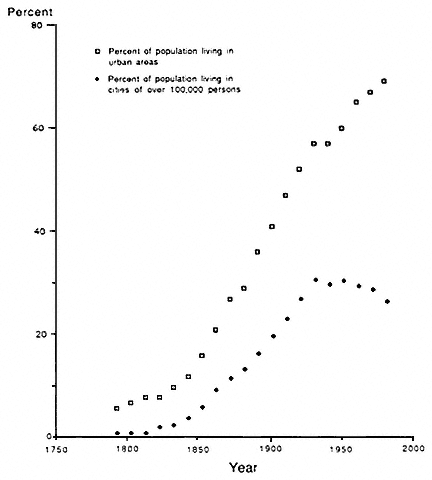
Figure 2.
Percent of Total Population Living In Cities, 1790–1980
Source: calculated from Bureau of the Census, Historical Statistics of the United
States, Colonial Times to 1970 (Washington, D.C.: GPO, 1975), 11–12, and
Statistical Abstract of the United States: National Data Book and Guide to
Sources, 1982–83 (Washington, D.C.: GPO, 1982), 21.
If we look at farm families as the obverse of urban families, a parallel divergence has occurred in the past fifty years. In 1930, when about 50 percent of the total population lived in places over 2,500, about 30 percent of the population lived on farms, leaving 20 percent in small villages and rural nonfarm residences. This has
changed dramatically and steadily, so that only about 3 percent of the 1980 population lived on farms, whereas 23 percent were other nonurban residents, a net increase of rural nonfarmers since the 1930 census.[3]
And very recently, this half-century-old trend away from the extreme of farm living has also emerged at the most metropolitan end of the population. The proportion of people living in the giant metropolitan areas—the seven cities with populations over three million—has declined by half a percent between 1970 and 1980. This latter shift, though slight, has caused considerable excitement and unease among urbanists. Some have termed the drop a new trend, one quickly labeled "counterurbanization" by Brian Berry. Clearly the trend is not new, but a half-century old, having begun in the Depression years, but masked until recently by data that focus on the standard metropolitan statistical area (SMSA), as well as by the baby boom, postwar prosperity, and rural migration from the South to large cities.[4] Whatever the future holds, it is fair to say that the century between 1830 and 1930 saw the most dramatic shift in creating modern urban America, and that the post-Depression era is one of sorting out and a drift toward moderation, toward the mean. Fewer people live in rural isolation; fewer in mass anonymity.
The Changing Number of Cities
Compare with this population shift the changing number of city units displayed in figures 3 and 4. These graphs show clearly the relative stability in the total number of city governments until the second phase of urbanization in 1830, followed by virtually continuous and rapid expansion. A continued expansion in number of city units has accompanied the post-Depression phase, mostly in the smaller city category (fig. 3), which accounts for the stability and decline in metropolitan populations. Thus while urbanization, defined as the movement of population from rural places, may have reached stasis, the process of city building begun in the mid-nineteenth century continues today. As a direct consequence, there are more than five times as many city governments per capita today than in 1790. This indicates that in essence the urbanization process in the United States has consisted of two related but quite different movements, one demographic and the other political.
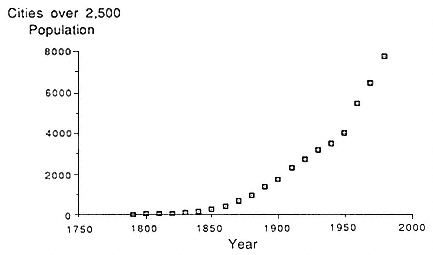
Figure 3.
Total Number of Cities over 2,500, 1790–1980
Source: Bureau of the Census, Historical Statistics of the United States, Colonial
Times to 1970 (Washington D.C.: Government Printing Office, 1975), 11, and
Statistical Abstract of the United States: National Data Book and Guide to Sources,
1982–83 (Washington, D.C.: Government Printing Office, 1982), 21.
More people live in vastly more cities. The age of the big city is over, but the age of cities continues with greater vigor than ever.
Figures 3 and 4, like figure 2, convey an immediate visual sense of the changing pace of what was an ordinary yet also extraordinary process. It was ordinary in that other nations were experiencing a similar or even greater residential relocation of people, but it was extraordinary in that no other built so many completely new cities. In Europe at the beginning of the nineteenth century, about 13 percent of the population lived in cities over 5,000 persons; for the United States the figure was only 3.4 percent. More specifically, comparing populations living in cities of over 10,000, in 1800 the United States was less urban than every European nation but Poland. However, ninety years later, only England and Wales, Scotland, the Netherlands, Belgium, and by a scant 0.4 percent, Germany, led the United States. And even more important, the United States made this transition by building physically and politically new cities. Of the 390 European cities with populations over 100,000 in 1979, 176 or 45 percent were "new" in the sense that they had had fewer than 10,000 persons in 1800. In sharp con
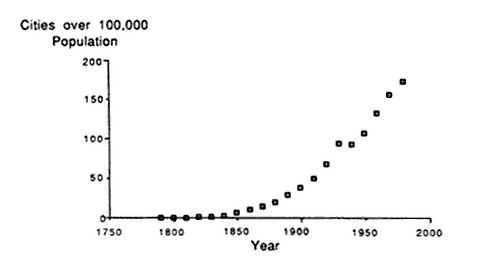
Figure 4.
Total Number of Cities over 100,000, 1790–1980
Source: Bureau of the Census, Historical Statistics of the United States, Colonial
Times to 1970 (Washington D.C.: Government Printing Office, 1975), 11, and
Statistical Abstract of the United States: National Data Book and Guide to Sources,
1982–83 (Washington, D.C.: Government Printing Office, 1982), 21.
trast, out of the 153 U.S. cities greater than 100,000 in 1970, only three had had over 10,000 in 1800 and only 23 had existed at all.[5]
Changes within the Urban System
This political and population process has entailed a subtler impact than the three graphs suggest, for the actual relationship of cities to one another changed as the whole system grew explosively. In contrast to Britain and Europe, the U.S. city system never developed a single, disproportionately large, dominant metropolis. But within the more dispersed network of smaller cities, towns, and villages, growth and expansion did not cause an endless replication of the early city patterns. The changing numbers of city units again furnish the basis for an index to this change, as in figures 3 and 4. However, by graphing the proportions of city sizes, as in figure 5, we can see the hints of change. Although the meaning of absolute city size may be impossibly elusive, most urbanists would probably agree that there are size thresholds associated with different city characteristics. For the purpose of clarity, a popula-
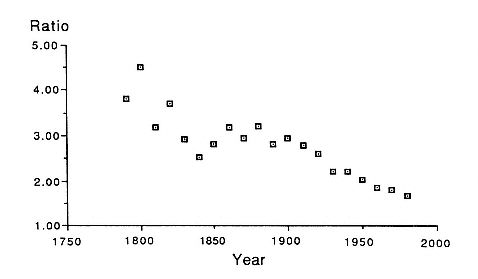
Figure 5.
Ratio of Number of Cities under 9,999 to those over 10,000
Source: calculated from Bureau of the Census, Historical Statistics of the United
States, Colonial Times to 1970 (Washington, D.C.: Government Printing Office,
1975), 11, and Statistical Abstract of the United States: National Data Book and
Guide to Sources, 1982–83 (Washington, D.C.: Government Printing Office, 1982), 21.
tion of 10,000 is used here as the criterion for separating major and minor cities. No doubt this is imperfect, either including or excluding the wrong cities, but it does serve as a comprehensible index to the size hierarchy of cities. Figure 5 plots the ratio of the number of small cities—places below 9,999 but above 2,500—to all cities with a population greater than 10,000.
The plot of this changing ratio shows that the number of very small cities relative to medium and large ones has rapidly decreased since 1800. Whereas in 1800 there were over four times as many small as large cities, by 1980 this ratio had fallen to only one-third its former size. The United States, it seems, is more and more becoming a nation of medium and large cities. (If we change the criterion, using the ratio of cities over and under 5,000, this downward decline did not begin until 1880; conversely, if the ratio is raised to cities over and under 25,000, there is a parallel decline from 1800 on.) This change is instructive, for it demonstrates that, in the United States, developed urban networks consist of proportionally more medium and large than small places. And, of course,
as they grow, the number of small places always tends to be moving into larger size categories. For the past two centuries the number of U.S. cities over 10,000 has grown 23 percent faster than those under 9,999.[6]
Throughout the seventeenth and much of the eighteenth century, the American colonies had no metropolis on their continent. Colonial American cities made up a minor part of an English urban network that tended toward primacy because of London's domination. By 1700 London had become the largest city in Western Europe, dominating the world's capitalist economy.[7] The English urban network, although containing cities of each functional type, had a metropolis of far greater power and size than theory would have predicted. For both historic and economic reasons the second rank of cities under London was relatively weak and small, as was the third tier of towns. The major American colonial cities functioned as towns through much of the seventeenth century, then began to take on more citylike activities during the eighteenth century. London, however, remained the metropolis. As economic independence slowly followed political independence, the United States escaped from a network based on metropolitan dominance. As the periphery of an urban network whose central functions were usurped by London, the American colonies had developed many small cities and towns. When liberated from London's dominance, they formed part of a network with more dispersed power and less primacy than in the original system.
The Effect of Primacy
At the beginning of the eighteenth century, while London's population was half a million, the rest of Britain boasted seven much smaller cities with between 10,000 and 20,000 people, perhaps 22 with 5,000 to 10,000, and then at least 600 towns and villages with populations less than 5,000. In other words, there were about as many people in London as in all the other cities, towns, and villages in Britain. Lopping off the overpowering metropolis of London creates a distribution of cities closer to that predicted by geographic theory and more comparable to North America. Of course, a world without a London would be provincial, dull, and decentralized—as colonial America was. When this urban American world did begin to expand dramatically a century later,
it was already decentralized and more evenly distributed. For its metropolis, it still looked to London, which continued through the mid-nineteenth century to act as a source of specialization, innovation, and of other services that only a metropolis could provide.
The urban benefits of being born on a colonial margin to a primate metropolis like London could have been reaped only by a nation on the verge of expanding into the era of steam and rail transport. That is, the existing model provided a flexible and powerful base for a new kind of urban growth because of a happenstance in historical timing. What might appear from a bird's-eye view to have been a natural expansion of cities across the North American continent was in fact a phenomenon born of timing and a decline in the significance of the primate metropolis. As chapter two has shown, the traditional city had had functional primacy, whether in ancient Syria, first-century Rome or seventeenth-century London. But on the North American fringe, a new model of city arrangement grew, its growth overshadowed at first by the sensational growth and urban spectacle of London.
Comparing the relationships of metropolitan populations, of other cities and towns in the urban system, and of rural areas, in England and the United States yields a measured sense of the different urban system developing in America. Simple population statistics reflect London's dominance over other English cities at the beginning of the nineteenth century. In 1800, 34 percent of the English population lived in cities and towns, as opposed to 6 percent in the United States. Of all the English urban population, 27 percent lived in London, a proportion that rose to 31 percent by 1820. By contrast, in the same period New York contained 18 percent of the American urban populace. And in 1890, when the U.S. urban population reached a proportion comparable to England's ninety years earlier, New York's share of urban dwellers had fallen to a mere 7 percent. Thus, the American urban network began the nineteenth century with no truly dominant metropolis, and ended the century with its major center even less dominant. As the twentieth century began, more than 16 percent of England's total population lived in London, a proportion that continued to increase. In the United States, however, only 4 percent of the total population lived in New York, a figure that continued to decline through the twentieth century.[8]
Although London was preeminent, England's new cities were
important, for they made up the bulk of the mid-nineteenth century manufacturing belt. Urban expansion in the United States was tied to national growth: moreover, locally promoted canal and railroad investment facilitated this national and urban expansion by forging water and rail connections. On the one hand, the peculiar advantage of rail transit over canals was, for the cities, that it allowed them even more flexibility, tapping hinterlands with great ease. On the other hand, the speed and relatively low cost of the railroad meant that established manufacturing cities could increase the size of their marketing regions, so the resulting competitive advantage shifted away from small manufacturing centers toward larger ones. In a detailed study of Ohio and Indiana, Edward Muller has shown how although the coming of the railroad indeed boosted the fortunes of some towns and quenched those of others, a surprising "inertia" afflicted most. That is, the new transportation technology affected established town hierarchies only slightly.[9]
By the 1830s, rail transit had made its powerful and flexible features well known. Although the major metropolises of the east coast had been established well before rail transport, they were all capable of deepening and concentrating their hinterlands with rails. Thus the railroad tended to either reinforce existing patterns of urban settlement and location or, in the plains and far West, affect only new cities. The noisy and smoky symbol of nineteenth-century technology did not so much dramatically alter the urban world as it accelerated the transformation already taking place.
Although five of the ten largest U.S. cities in 1984 had been well established prior to the coming of the railroad, most of the national urban network was built during the era of rail transportation. One may use the 153 American cities that had populations greater than 100,000 in 1970 to index the mature urban network. This choice makes only the modest assumption that no more than a handful of the cities will shift out of this group in the next decades. Of this group, which might be designated the major cities of the United States, fully 75 percent had been established after 1840—or alternatively, 65 percent after 1850—when the railroad had become an established technology. (Only 9 percent was added after 1910, the earliest date one could call the age of the automobile.) Table 3 illustrates wide regional differences in the dates of founding of these major cities. But it is important to note that even on the Atlantic seaboard, what one might think of as the
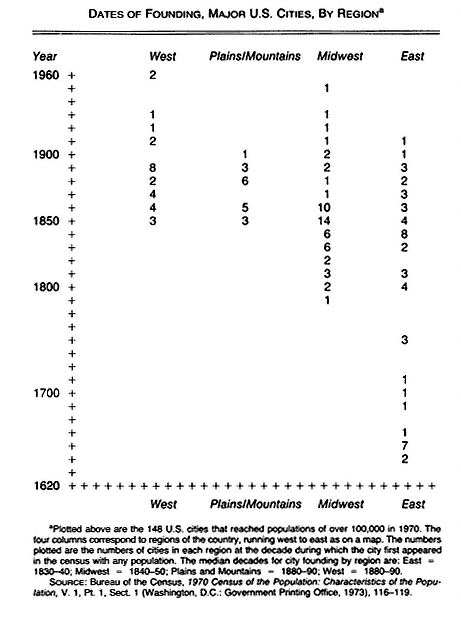
Table 3
Dates of Founding, Major U.S. Cities, By Regiona
colonial urban system, half of the 53 cities were established after 1840, suggesting strong postrailroad elements even in the original colonies. In the Midwest, of course, even more cities, about 80 percent, were platted in the era of railroads. And with a handful of exceptions, all cities west of the Mississippi were established after the railroad.
Thus, as almost all the urban United States west of the Appalachians was constructed in the nineteenth century, city builders could make locational decisions based on the known advantages and requirements of rail transit. Cities like Denver, for instance, located on a high plain with no water transport, were unimaginable before efficient rail transport, and cities originally expecting to boost their trade advantages with canals could quickly change to railroads when they proved advantageous. A famous historical debate over the cost advantages of rail versus canal transport has demonstrated the problematic aspect of the profitability of one transport system over another, but in the context of the American urban system the question is moot.[10]
In retrospect it may appear that the transport technologies themselves determined urban locations and building forms.[11] But the process was one of mutual reinforcement, and it would be as incorrect to say that city settlement patterns caused the success of rail transport as to say that rail transport caused a particular city settlement pattern. Railroads, and later hard surface roads, came to predominate partly because the urban settlement patterns of the nation had been made with conscious expectations of the new transport. In the mid-nineteenth century, aggressive railroad entrepreneurs and city officials both recognized this. Cities often sold bonds specifically to underwrite railroad expansion, sometimes for laying track to the town, sometimes for building a terminus, and sometimes for general financial assistance to a fledgling railroad company. Cities took these risks because the railroad's arrival, a terminus for its convenient stopping, and its general success almost guaranteed the city's future economic expansion and subsequent ability to repay the bonded debt. Of course, railroad entrepreneurs recognized the local importance of their routes and building plans, and they courted cities, subtly arranging bidding contests among them.[12]
The Phased Expansion of the Urban System
Table 3 also shows again the three-phased urbanization of the United States. Its lower portion sketches the colonial urban world, the middle band the expansive nineteenth-century world, and the upper reaches the relatively stable twentieth century. Although city building moved westward along with the center of population, table 3 demonstrates how the east coast also stayed quite busy in its city building, and how twentieth-century southwestern urbanization represents a smooth shift and gradual tendency rather than the abrupt departure it is sometimes seen as.
Throughout the nineteenth century, both technology and topography considerably influenced the imaginary map represented by table 3. In the colonial phase, only water and wagon roads connected the urban world. Mountain ridges provided virtually uncrossable natural barriers, and the federal government's cautious refusal to fund transportation—despite the bold arguments advanced by Secretary of the Treasury Albert Gallatin in 1808, and later supported by John C. Calhoun—had the effect of frustrating urban expansion in the trans-Appalachian west.[13] The nineteenth-century expansion shown on our imaginary map must be interpreted in light of the introduction of railroads, which though slow, primitive, and only a few years old, were already affecting both actual and expected transportation patterns. And the post-Civil War period must be understood as representing a truly booming urban landscape, with capital, immigrants, and transnational railroads making the entrepreneur's wildest dreams come true.
The second mapping addition that imagination must supply is that of the ever-changing urban interstices, the hamlets, villages, towns, and small cities both growing and declining between the larger cities plotted in table 3. In the purely agricultural sections of the country, these places varied in their dispersal with the productivity of the land, the technology of transport, and the size of the land holdings. East of the Mississippi, a dense network of small towns functioned as market centers. West of the Mississippi, the network stretched much more thinly, the number of towns, farms, and amount of rainfall all declining together until reaching the barrier of the Rockies.
There is some evidence that hints at great fluidity in the urban network on the level of the very small village, places under 2,500
that escaped enumeration by falling under the Bureau of the Census' definition of urban. New Hampshire, for instance, experienced rural depopulation and loss of villages in the eighteenth century, perhaps because of the relative infertility of the land and the availability of better agricultural land farther to the west. But even the newly settled land farther west went through a similar cycle of the birth and decline of very small towns. One study, of the towns around Syracuse, New York, in the first decades of the nineteenth century, delineates the process that first sprinkled the countryside with tiny new towns, then within a span of two or three decades winnowed out some and boosted others. These villages were never very stable, though perhaps they were bucolic. A similar pattern appeared in early nineteenth-century Ohio, where the growth in larger places, those over 2,500, also masked a decline in the small villages and hamlets. The rise and fall of small industries and changes in transportation, including wagon roads, meant that shrinkage was a common as growth for these smallest components of the expanding urban network. In addition to small places that dwindled, other towns failed to thrive and stagnated. As canals diminished some of the importance of natural river routes, and railroads in turn replaced canals as the major form of transportation, many towns also experienced changes in commercial and manufacturing importance owing to location.[14]
Necessary, Sufficient, and Contingent Reasons for Growth and Decline
Members of the local elite often congratulated themselves loudly when their cities grew, considering local growth to be a result of their unique entrepreneurial abilities. Yet local entrepreneurship interacted subtly with overall population growth, changes in transport, and the growth of manufacturing, leaving a turbulent urban world where there must have been many disappointed town dwellers and promoters. Not that urban promoters were ignorant of their location in relationship to hinterland resources, transportation, and other cities, but in the nineteenth century, with the whole system building out of what often seemed to be little more than hope and hype, exaggeration and self-deception were rife. Hence, promoters of the port of Duluth, a cold, desolate place located on infertile land at the margins of what is still wilderness,
could confidently publish a "fact-filled" pamphlet that described the city as being in the center of a transportation network connecting not only to St. Paul, Chicago, and New York but also to Paris, London, and Calcutta. Historians, too, have often looked at entrepreneurship as a significant factor in growth, neglecting the necessary (if not sufficient in themselves) locational and network influences. Only in very obvious cases has the role of extrinsic factors been brought into the historical analysis. In the rivalry between Houston and Galveston, for instance, it is clear that Houston only forged ahead when a 1900 hurricane wiped out 15 percent of Galveston's population.[15]
Other equally invisible factors influenced the mapped networks of cities across the continent. Extractive industries, particularly western mining, often created urban centers the population sizes of which agriculture and manufacturing alone would not have predicted. Denver, for instance, provided important urban services to a ranching and farming hinterland, which, when combined with mining on the eastern slope of the Rockies, explains its explosive appearance and growth in the 1870s in a region too dry for unirrigated agriculture. The city grew from nothing in 1850 to a modest 4,000 during the sixties and seventies, suddenly bursting to 35,000 in 1880 and then tripling to over 106,000 by 1890.[16] Most growth statistics for nineteenth-century U.S. cities are very high, but the cities that showed comparable growth usually had more locational advantages than Denver. Few landlocked and arid nineteenth-century cities can match its growth. Historians often point to Chicago, with its port and rich agricultural hinterland, as the outstanding growth center of the late nineteenth century, but impressive as Chicago's story is, it is not nearly so unexpected as Denver's. Location theory thus alerts us to the need for additional information to understand cities like these.
The model of urban networks, then, must be considerably modified to correspond with the historical reality of the nineteenth-century United States. These modifications help to both uncover the unexpected and define the expected; in doing so, they also reveal the regular processes that create a history.
An almost fluid urban expansion encompassed both growth and shrinkage while the network of cities, towns, and villages stretched thinly over arid regions, with concentrations of mineral resources distorting its symmetry. In the Southwest, the Spanish
and Mexican tradition of large ranches, succeeded by the massive landholdings of capital- and land-intensive agricultural concerns, almost proscribed the tiny hamlets and villages that were the norm east of the Mississippi.[17] In California, the Spanish mission system explicitly anticipated an urban settlement pattern, with the two major metropolises, San Francisco and Los Angeles, one a fort, the other a civil settlement, planned as urban centers long before growth was a realistic expectation.
Consequently, soon after they began to experience population expansion, the southwestern states became proportionally far more urbanized than our impressions of cowboys and Indians might have predicted. California, for instance, reached the 50 percent urban point in about 1885, when the United States as a whole was only about 32 percent urban. Or, to take an extreme case, Arizona remained a relatively unpopulated state until the 1950s. In 1940 it had a population of only 500,000, about 33 percent urban. But in the next twenty years its population shot up to 1,302,000, of which 75 percent was urban. This quantitative index can be easily misread, however, for by bifurcating the world into urban and rural, it ignores the hamlets, the places under 2,500 people, which dotted much of the eastern United States. Thus much of the population that census statistics classified as rural actually lived in tiny hamlets: while one hesitates to call the residents of these places "urban," they certainly had lives that were far less rural than the farmers and farm laborers of the Southwest.[18]
Continuing Urban Transformations
Urbanization continues to transform the settlement patterns of the United States in the twentieth century. These transformations also completely invert our image of what the United States looks like. The new urban world can best be represented by the 1980 ranking of states and regions by percent of urban population, using places larger than 2,500 as the definition of urban. The West has become the most urbanized region, with 84 percent of its populace in cities, as opposed to 74 percent in the Northeast, 70 percent in the North Central states, and 67 percent in the South. Only one state, California, now has over 90 percent of its population in urban areas, and it had already reached this remarkably high level in the 1960s. Using the more inclusive measure of the standard
metropolitan statistical area (SMSA), California had reached an astonishing 95 percent proportion in 1980. It might be argued that these proportions are the result of defining urban too inclusively. But even with tightening the definition considerably, to SMSAs over one million, the pattern remains. Over 18 million Californians, 78 percent, live in such places, compared to 13 million New Yorkers, less than 72 percent. In 1980, eleven states had populations that were over 80 percent urban: Rhode Island, New York, New Jersey, Illinois, Maryland, Florida, Colorado, Arizona, Utah, Nevada, and Hawaii. Texas almost squeaked into this category, at 79.6 percent urban.[19] It will take a long time for us to readjust our perceptions of what makes a city before this reordered urban world can be fully understood and accepted.
Using numbers and graphs, this chapter has outlined the building and peopling of the urban United States. It has necessarily and deliberately simplified a complex, effervescent, and sometimes unpredictable world, a world which has in two centuries become something more amazing than the most fantastic imagination could have foreseen. Even a hundred years ago, Edward Bellamy's Looking Backwards, 2000-1887, a futuristic novel set in the year 2000, failed to comprehend the magnitude or direction of change that still continues to reshape late twentieth-century urban America.
The rural and urban populations of the United States have begun to approach a complete reversal in proportions from those of the eighteenth century. People live in metropolitan complexes vastly larger than they did two hundred years ago, yet these places lack the population density, the urban feel, of the smaller late eighteenth-century cities. In fact, as the nation has urbanized, the very essence of urban has changed. This is most typified by the sprawling cities of California, our most urban state, where the low-rise openness defies the most sophisticated sense of what is urban.
Paralleling the ascendancy of what some might call the non-urban cities of California has been a trend since the nineteenth century toward a proliferation of more small and medium-sized cities. The list of cities with a population greater than 100,000 in 1980 runs to over 150, including places that few Americans could accurately map, even by state. How many can locate Concord (not Massachusetts!), Garland, Irving, Lakewood, Livonia, Sterling
Heights, or Warren? All these are cities larger than Phoenix was in the 1940s.
It is little wonder that this urbanization process has encouraged commentaries that toss about superlatives as rapidly as the cities grow. Yet it is important to remember that the United States has been a part of an urbanizing world. For comparison, visualize the widely reproduced, speculative graph by David Clark plotting the growth of the world's urban population.[20] It shows 5,000 years of a flat line at less than 5 percent urban, with a sudden almost vertical spike representing the past 200 years of urban growth. The world graph makes a convincing argument about the genuine transformation wrought by urbanization. In this larger context the transformation of the United States seems modest, but only because the time scale has been expanded. Like the U.S. graph, the world graph can be seen as the record of three phased, rapid transformations. In phase one, no visible urbanization took place; in phase two, the rural population achieved its present level while the urban proportion began its rapid increase. And in the third phase, since about 1930, the rural population has held steady, with virtually all population growth taking place in the separate urban world. With only slightly altered timing and scale differences, California can be seen as a paradigm of the larger process. Entering the United States in 1850 as an almost purely agricultural place, its rural population grew until about 1940, then stabilized. However, its urban world changed in an entirely different way, increasing from the 1850s, but accelerating after the turn of the century and again after World War II.
These graphs encourage prediction, something that historians simultaneously abhor and consider frivolous. Our business, after all, is the past, and when we demand the most critical evaluation of what has already happened, it is hard for us to accept what has not happened, or the discussion of it, as being properly empirical. But, to the extent that such predictions can be reliable, it appears that the relative stability of the rural populations will in fact be maintained, while urban expansion, the only really variable population figure, will continue to reflect total population growth, thus varying in its proportions but probably stabilizing throughout the United States at a level somewhat lower than California's, say at 80 to 85 percent. This is then a very cautious prediction, that
what has historically been a volatile and changing aspect of our history will continue to be so. In other words, the rural parts of the two graphs will continue their historical stability, while the urban portions, so far having shown only wild expansion, will vary, for the most part expanding, of course, but on occasion even contracting.