Exponential Growth Curves
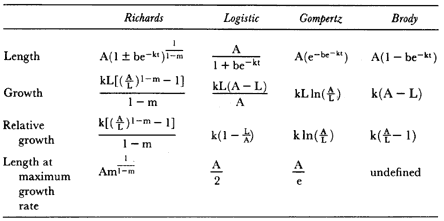
A family of four exponential functions—the Richards, the logistic, the Gompertz, and the Brody curves (table 9.3)—were fitted to these data to estimate the parameters of the growth curve (Brody 1945; Richards 1959; Fitzhugh 1975). These functions are commonly used because their parameters have useful biological interpretations (Richards 1959). The equations are written so that length (L) is a function of age, but since these curves are based on the idea that growth rate depends on an organism's current size, growth and relative growth are functions of length. The important features of the male growth pattern, such as the changes in growth rate with age, the age of highest growth rate, and the age when growth ends, were obtained from the parameters of the function that best fitted the data. The important parameters are m, k, and A because my objectives are to describe the growth pattern of male seals to adult size (which is related to m
|
and k) and to estimate when growth ends (which is related to A). The value of m determines the shape of the curve and the size (or age) when growth rate is maximal. If m > 0 the age-length curve will be sigmoid, and the growth rate will have a maximum at some age after the beginning of the curve. The value of k determines the inhibition of growth as age increases; basically, if m, b, and A are constant, larger k values mean larger size at given ages during the period of growth, faster growth at young ages, and a faster approach to asymptotic size. Because b is a time scaling factor, its value is not biologically significant.
A sigmoidal curve describes growth in most birds and mammals. This growth pattern is usually modeled with the Richards curve, or two of the special cases of this curve—the logistic and the Gompertz curves (Richards 1959; Case 1978; O'Connor 1984; Sibly and Calow 1986). The Richards equation is a four-parameter function that encompasses the three-parameter functions, since each of the other curves can be derived by setting m to specific values: m = 2 for the logistic, and m ® 1 for the Gompertz. Where growth decreases steadily after birth, the best fit will be obtained when m = 0, which is the Brody function. Each of these functions has a different shape mainly because each has a different point of inflection, which is the length (or age) at which growth rate is highest.
Multicomponent functions based on the logistic function have been used widely in recent longitudinal studies of growth curves that featured growth
spurts (Bock et al. 1973; Koops 1986). The change in growth rate is modeled by an additional set of parameters that begin to contribute to the shape of the growth curve at the transition between stages in a multicomponent function. In this study, the cross-sectional data for male M. angustirostris were fitted to a two-component function consisting of the sum of two logistic functions:

The first part of this equation governs growth early in life, and the second part begins to contribute to size later in life. The parameters d1 and d2 are the ages of the maximum growth rate for the first and second components; these parameters also eliminate the scaling parameter b from the function. For the cross-sectional data in this study, maximum growth in the first phase was assumed to occur near birth when pups are nursing from their mothers, so d1 was set to zero initially before estimating the other parameters.
The exponential growth functions were fitted to the cross-sectional age-length data by nonlinear least squares regression using the SAS NLIN procedure (SAS Institute 1985). All standard length measurements obtained for aged males were included in the data set. Strictly speaking, the data were mixed cross-sectional–longitudinal since some individuals were measured at more than one age (Fitzhugh 1975). Although data for these seals violated the least squares assumption that the observations are independent, the estimates of age-specific size and growth rate are usually improved by collecting mixed data instead of obtaining purely cross-sectional data (Tanner 1951).

