SIX
Estimating Costs of Alternative Electric Power Sources for California
Walter J. Mead and Mike Denning
I. INTRODUCTION
The purpose of this chapter is to evaluate alternative electric power sources that will be available to the state of California in the next decade. The evaluation will be based on a conventional social benefit-cost analysis. We will draw on electricity supply-demand forecasts prepared by the California Energy Commission (CEC). These forecasts indicate that California "can meet all of its needs for electricity until the late 1900s" (California Energy Commission, 1987, p. 19). The alternative electric power sources we will evaluate will be imports from the Pacific Northwest, including British Columbia, imports from the Southwest, and new electric power sources that might be developed within California.
Forecasting energy demand and supply is not as simple as it was before the 1970s. At that time, prices for electric power fuel sources were relatively stable, resulting in relatively stable prices for electric power. Economic growth and population expansion produced steady growth in electric power demand at about 7% annually, enabling utilities to efficiently plan new power plant construction to meet demand expansion. The oil price revolution that began in the early 1970s brought these easily predictable conditions to an end when crude oil prices increased from about $3.25/barrel in the early 1970s to $39/barrel in February 1981. With similar price increases for substitute fuels, electric power prices increased and electricity consumption growth rates tumbled to about 2% by the early 1980s. Capital costs for new electric power generating plants also increased sharply in the mid and late 1970s. By July 1986, the price of U.S.-produced crude oil had fallen to $9.25/barrel, then nearly doubled to about $18/barrel by 1988. If oil and gas prices remain at or below present levels for several years and if no new generating
plants are built and qualifying facilities (OF) overpayments are eliminated, then electricity prices are likely to remain stable. In this event, growth rates for electric power consumption are likely to rise above 2% and return toward their pre-1970s levels, and California will need both new generating capacity and energy supplies well above those forecast by the CEC.
II. THE CALIFORNIA ENERGY COMMISSION SUPPLY-DEMAND FORECAST
The CEC and California public utilities face formidable problems as they attempt to estimate future electric power demand and supplies. Before the energy price revolution of the 1970s, with its induced demand shifts (conservation), supply-demand forecasting was a relatively simple matter of projecting past trends. In 1970 electric power was supplied from relatively static sources. In order of importance for the United States as a whole, they were coal, 49%; natural gas, 23%; hydro, 17%; oil, 10%; and nuclear, 1%. In California, oil and gas were the dominant energy sources, together accounting for 70% of the state's electric power generation. Coal combustion was not a source in California electric power generation. Nationally, coal prices were relatively stable. They were essentially constant from 1957 to 1967, when they started to increase at a 12.3% compound annual rate (nominal terms) through 1970.
U.S. residential electric power rates (nominal) were identical in 1940 and 1970, with only minor variations in the 30-year interval. Real prices (adjusted by the Consumer Price Index) declined by 64% from 1940 to 1970, a 3.3% compound annual decline rate. Given a 3.9% rate of increase in the real GNP over this period, one should expect a rapid growth rate in electricity consumption. Consistent with this expectation, electric power usage in the United States increased at an 8.6% rate over the three decades from 1040 to 1970.
In late 1972 oil prices started their upward spiral and, with a lag, produced major reductions in energy-use growth rates. Residual fuel oil prices started a tenfold increase in the last quarter of 1973. Electric power price increases followed with a lag of one or two years. These latter price increases continued into the mid-1980s, causing additional market-motivated conservation. Such dynamic changes suddenly made forecasts based on simple linear projections of past trends in electric power consumption virtually useless and required a new forecasting methodology in which sharp price increases and related changes in economic growth rates, as well as substitution of both old and new electric power generating technologies, would be taken into consideration. Finally, federal and state public policy became an important factor in determining electric power supply and demand.
In 1971 California public utilities projected electric power demand growth through 1980-1985 at a 7.38% annual rate, a reasonable projection given information available to the utilities in 1971. However, rapidly rising energy prices from 1972 through 1980 made this projection increasingly unrealistic. Average U.S. electric power prices (nominal) increased 3.4 times from 1973 to 1985 for a 10.8% compound annual rate. Real prices increased at a 3% annual rate. As should be expected, these rapid price increases caused electric power consumption growth rates to decline sharply. From 1975 through 1987, U.S. electric power consumption (with a two-year lag behind prices) increased at a modest 2.9% annual rate, and the growth rate declined progressively over this 12-year period. Reflecting this price-inspired conservation and (possibly) policy-enhanced trend, the CEC projected a declining electric power growth rate for California through the year 2005 in its December 1986 electricity demand study, as shown in Table 6.1.
However, the CEC electricity price forecast shows that the upward trend in electricity prices, which produced the observed decline in consumption, is expected to peak in 1988 and decline thereafter through the year 2005. Table 6.2 gives these projections, together with historical prices. Real prices increase at a 2.8% annual rate from 1977 through 1988 and then are forecast to decline at a 0.8% annual rate from 1988 through the year 2005.
Thus, although rising real electricity prices caused growth of electricity consumption to decline from about 7% annually before the 1970s to about 2% by the early 1980s, the CEC asserts that real energy prices will decline after 1988, but the rate of increase of energy consumption will continue to fall, as shown in Table 6.1. From an economic perspective, this CEC conclusion is difficult to accept. Instead, declining real prices should lead to increasing consumption growth rates toward, but not necessarily reaching, the 7% long-term growth rates realized before the energy crisis years. In fact, electric power consumption growth rates already show very sharp increases. Table 6.3 shows that twelve-month growth rates by month have increased to over 5% beginning in January, 1988. This matter is a serious one for California consumers of electric power. If electricity consumption growth rates are underestimated by the CEC and the actual growth rate turns out to be 3% between 1990 and 1997 instead of the 1.98% forecast by the CEC, then instead of meeting all electricity needs, we will suffer a shortage of about 13 billion kilowatthours. This shortage is the equivalent of about two nuclear plants of Diablo size (1100 MW operating at 75% capacity). Given the extremely long time period required to build new generating plants in California (construction of Diablo required 15.5 years), there will be no opportunity to construct efficient plants. Short-run solutions that are costly for ratepayers are likely to be sought as the only way out.
The CEC assessment of the need for new electric power supplies does not adequately consider the important economic forces that determine supply of and demand for electric power. The assessment gives little weight to electricity prices as primary determinants of electric power demand. Ignoring price implies supply and demand curves as shown in Figure 6.1.
The CEC 1985 electricity report "assessed" 1996 demand and supply, then subtracted one from the other, and arrived at shortage estimates for both generating capacity and energy in that year. Figure 6.2 shows the CEC forecast methodology in more detail: Starting with the 1983 actual load, the commission drew upon individual load growth forecasts provided by the state's utilities. The commission staff and commissioners reviewed and modified these forecasts to conform with their judgment.
Electric power supplies expected to be lost between 1983 and 1996 due to contract expiration (imports from the Pacific Northwest and the Southwest) and retirement of existing plants were subtracted from 1983 supplies and a difference identified as the basic need was calculated. This basic need appears to be independent of electricity prices.
In its 1981 biennial report, reaffirmed in 1983 and again in 1985 and 1986, the CEC determined that "after 1991 no more than one-third of the state's electricity generation (in GWh) should be fueled by oil or natural gas" (California Energy Commission, 1985a, p. 65). Accordingly, the 1996 supply assumptions show a reduction due to fuel displacement. The basis for the CEC policy of reducing oil-based electric power production is twofold: (1) a fear of another supply disruption and (2) expected crude oil price increases. In its 1985 energy plan, the CEC wrote, "Assuming no future oil supply disruptions, oil prices are expected to show average increases greater than inflation for the next 20 years" (California Energy Commission, 1985b, p. 20). This forecast was redefined in the CEC May 1986 energy demand report, which forecast that oil prices (real) would increase at a 3.1% compound annual rate for 1986 through 2005 (California Energy Commission, 1986a, p. B-8).
Regarding the supply disruption fear, the West Coast has what is commonly called the West Coast oil glut, a condition that started in 1977 with the flow of oil from Alaska's North Slope, constrained by a federal government ban on its export. The supply of oil available to West Coast refiners has recently averaged about 3 million barrels/day, while West Coast refinery crude runs are limited to about 2.2 million barrels/day. Thus there is an excess of about 0.8 million barrels/day that is disposed of by shipping or piping it through Panama and then into the Gulf of Mexico refining area. The last supply disruption experienced by the United States occurred in late 1973 as a result of the Arab-Israeli war. During a four-month period, the Arab members of OPEC imposed an
embargo on sales of crude oil to the United States, an action that reduced the world supply of oil by 6.6% (3.7 million barrels/day). At that time, neither the United States nor other large oil importing nations maintained stored reserves to compensate for an imposed disruption. However, the large importing nations now have some reserve capacity to offset the effects of an embargo. The U.S. Strategic Petroleum Reserve (SPR) alone has stored reserves amounting to 545 million barrels as of March 1988 (U.S. Department of Energy, 1988, p. 41). A supply disruption similar to the only one of consequence ever experienced by the U.S. would have no significant direct effect on West Coast crude oil supplies unless federal government regulations forced a reallocation of crude oil out of the West Coast.
Regarding the oil price issue, crude oil prices reached $39/barrel in February 1981, four years before the CEC 1985 energy plan was issued. As of January 1986, crude oil prices had fallen from their $39/barrel peak to about $21.46/barrel, a decline of 45%. From January 1986 through January 1988, instead of rising, crude oil prices (nominal) declined another 34% to $14.17/barrel (FOB cost of imports). Real prices for crude oil declined even more. The CEC policy regarding oil use in power generation was flawed not only in its incorrect price forecast, but also because of an essential distinction between baseload and peak load use of oil and gas energy sources. Capital costs of oil and gas plants for peak load power generation are relatively low, and oil or gas used in existing plants might be the least-cost source of meeting additional peak power demands. As a baseload source, oil and gas were certainly uneconomic at prices prevailing at the time of the 1985 policy statement. However, at less than $20/barrel for crude oil and approximately the same price for residual fuel oil, oil-fired electric power generation becomes worthy of consideration even for baseload power generation. This point will be discussed more thoroughly below.
The supply forecast was augmented by power supplies from likely additions. These additions consist of likely imports of power from the Pacific Northwest and the Southwest, plus projects that have been completed since 1983, are under construction, or are in various stages of CEC and/or California Public Utilities Commission (CPUC) approval.
The assessments outlined above leave a remaining 1996 energy need of 28,235 GWh of energy (6,349 MW of capacity). This gap may be filled by favored energy sources that have been reserved by the commission. Table 6.4 lists these reserved sources.
The commission makes clear that it will use its power to override the market and the judgment of utility companies to protect and advance its favored power sources. Its electricity report specifies that "only those resources for which the Commission wants to provide preference will have
an unfilled reserved need as of the adoption of this report. . . The Commission can clearly control approval of projects in its siting process that seeks to fill reserved need amounts, but must influence the decisions of other permitting authorities to encourage only those resources that provide the preferred mix that the Commission determines best meets state needs" (California Energy Commission, 1985a, pp. 76-77).
The projected 1996 deficit of 6,349 MW of capacity is approximately equal to three nuclear power plants of the Diablo Canyon size class.[1] Whether this deficit will be filled by the sources preferred under the commission preference system is doubtful. First, 26% of that capacity is reserved for unspecified sources preferred by the commission. The remaining 74% would be forthcoming only if investors or decision makers conclude that the required investments would be relatively profitable. Most of the new in-state sources preferred by the CEC, including solar and wind generation, are uneconomic in the absence of government subsidies, as will be shown below and in Chapter 9. As the prices of oil and gas fall, alternative sources of electric power become less attractive. In the cases of both wind and solar power, the commission specifically notes that "the Commission's preference is for more than is estimated to develop" (California Energy Commission, 1985c, pp. 3-25). Even if the physical supply is forthcoming, the commission should have more concern for the costs that California consumers are required to pay.
As state and federal government subsidies are allowed to expire, the commission's preferred sources are not likely to fill the gap projected by the CEC for 1996 and beyond. In that event, plans should be made relatively soon to meet the projected electric power demand in the late 1990s. We now turn to an examination of the alternative electric power sources for California from both imports and development of new instate electric power sources.
III. POTENTIAL IMPORTS FROM THE PACIFIC NORTHWEST AND SOUTHWEST
Of the many possible future sources of electric power for California, importation of the large surplus of electric power from the Pacific Northwest and Southwest is potentially among the least costly. The cost of such imports depends on (1) intertie access policy and (2) Bonneville Power Administration (BPA) rates. The Northwest and its large network of hydroelectric generation sources has regularly had surplus electricity available for sale during times of heavy rainfall or runoff from snow-melt—typically during the spring and summer months. In the past few
[1] The two units in the Diablo Canyon facility have a total capacity of 2,190 MW.
years, however, a number of circumstances have led to a large surplus of electricity year round. That surplus is expected to last at least into the early 1990s and possibly until the end of the century.
In the Southwest anticipation of continued rapid population growth rates through the 1970s led to the construction of several new baseload coal-burning plants. In both the Pacific Northwest and the Southwest, growth in demand has been less than anticipated due to higher electricity prices and the 1980-1982 recession. Surplus generating capacity has consequently become available for California markets. The first five rows of Table 6.5 give the record of imports from each region.
The electric power imported from these regions is of two basic types—firm and nonfirm. Firm energy is electricity that is guaranteed to be delivered under contract. Nonfirm energy, on the other hand, is power that can be purchased only temporarily, according to its availability. Hydropower systems, such as those in the Pacific Northwest and the Hoover area in the Southwest, produce large amounts of nonfirm energy, because "critical water years" are used to plan for regional electricity loads, ensuring that even in a year with subnormal precipitation, utilities will be able to meet their local load requirements. Therefore, given normal precipitation levels, surplus nonfirm energy will exist year round, becoming particularly abundant in late spring and early summer as rivers swell due to mountain runoff. Available supply also depends on the relationship of storage volume to runoff volume. The Pacific Northwest stores only about 30% of its annual average runoff.
Firm capacity imports refer to purchases, exchanges, and entitlements to energy, from either utilities or specific generating units in other regions. Firm energy imports refer to purchases, under contract, of specified amounts (measured in kWh) of planned surplus energy from utilities in other regions. It should be pointed out that just because energy or capacity is labeled firm, it is not guaranteed to be delivered in all instances. The actual amount of power delivered under such contracts depends on the status of both the transmission system and the specific generating unit(s) from which the power is promised. Most interutility electricity sales are system sales. Because of the very small probability that a utility system will not be able to support a power contract, system sales are firm for planning purposes. On the other hand, power purchased from a qualifying facility2 (QF) is unit-specific and less reliable because it is not deliverable if the generating plant in question is unavailable. In some cases the importing utility is required to pay for contracted
[2] A qualifying facility (QF) is a small power project (generally less than 80 MW capacity) that is not owned by a public utility and meets efficiency standards established by PURPA and the FERC. Cogeneration plants may be included even if their capacity exceeds 80 MW.
power even if such power is not delivered. Therefore the prices bid for such energy and capacity reflect the estimated probabilities of transmission system and/or plant failure.
From a California perspective, firm energy is, when available, the most valuable of these two types for several reasons. If firm power can be purchased at prices below those of a utility's alternative power sources, the use of (formerly) expensive oil- and gas-fired peak load generating facilities may be avoided. In addition, long-term firm power is valuable to the extent that its availability allows California utilities to delay construction of costly new generating facilities. Nonfirm energy, although most plentiful (from the Pacific Northwest) during California's peak energy demand in the warm summer months, is least valuable because its delivery is not guaranteed, thus requiring backup sources of generating capacity to be maintained and run in years when nonfirm energy is unavailable.
Because firm power from the Pacific Northwest commands a higher price than nonfirm power and its availability can be planned, private utilities in the PNW prefer sales of firm power. Accordingly, Pacific Northwest utilities are attempting to firm up their generation system, through water storage and new generating techniques.
Pacific Northwest Imports
California utilities have regularly imported surplus power from the Northwest, but a majority of these transactions have been for nonfirm energy. Table 6.6 summarizes electricity imports from the Pacific Northwest for 1976-1985. Utilities in California and the Pacific Northwest are currently trying to make arrangements to capture more of the potential benefits from sales of surplus power by exploiting the current price difference and taking advantage of the differing seasonal demand patterns in each region. California utilities face their highest demand for electricity in the hot summer months, while the Northwest faces its peak demand in the winter when California demand is low. Consequently, both regions could reduce their required peaking capacity through exchange agreements whereby each imports peaking capacity during its peak season, repaying that electricity during the other's peak season.
The Northwest Power Planning Council (NWPPC) has suggested a number of strategies for maintaining the financial health of that region's electric power industry (Northwest Power Planning Council, 1985). These strategies include the development of a regional conservation plan, more efficient use of the hydropower system, reducing the load factor caused by aluminum industry cyclical demand volatility by increasing the interruptibility of this power, and the possible completion of two unfinished nuclear plants. Implementation of these measures
seems quite favorable for continued importation of power by California utilities.
Utilities in the Northwest and California are currently discussing long-term (15- to 20-year) contracts for firm electricity sales of approximately 1,500 MW of surplus capacity to California utilities (Bonneville Power Administration, 1983, p. 9). Based on existing and planned future construction, the NWPPC projects a surplus of 2,300 MW, which could last from 5 to 20 years, depending on load growth in the region. Rows 6 through 8 of Table 6.5 show California's projected imports from both regions through 2004. Actual levels will depend on transmission constraints, resource availability and prices, and the ability of California markets to absorb additional imports.
Another source of energy likely to be available for importation into California is British Columbia Hydro and Power Authority. B.C. Hydro has tremendous developed and potential electric power supplies and, with actual Canadian demand less than forecast, is anxious to increase revenues by exporting surplus electric power. In addition, the provincial government is currently proposing that B.C. Hydro build projects to generate power dedicated solely for long-term firm export to the western United States. Another advantage is that B.C. Hydro draws much of the water for its hydroelectric generating facilities from areas unconnected with the sources of Pacific Northwest water. Consequently, a poor water year in the Pacific Northwest may not affect exportable energy from B.C. Hydro. Also, B.C. Hydro's capacity to store water is much greater than that of Pacific Northwest utilities, creating attractive possibilities for firm sales with increased supplies in the late autumn and early winter when the Pacific Northwest normally has little or no surplus. Based on its 1983 load forecast, B.C. Hydro is expecting energy surpluses of about 10,000 GWh currently, declining to approximately 800 GWh in 1996-1997 (see Table 6.7). Given average water conditions, these surpluses may be even larger by as much as 4,000-4,500 GWh/year.
The major obstacle B.C. Hydro faces in exporting power to California is a lack of transmission capacity. Existing capacity to the intertie system at the U.S./Canada border is 2,000 MW, which could be increased 300-400 MW at a nominal cost. Due to BPA's current intertie access policy, B.C. Hydro has last priority on use of the intertie. One way in which B.C. Hydro can circumvent this constraint is by selling water to BPA, who then generates power and sells it over the intertie. BPA can also sell power to the Pacific Northwest if the demand exists, allowing Pacific Northwest utilities the option of reselling this displaced power in California markets. BPA is currently blocking these purchases. If B.C. Hydro is afforded greater use of the intertie, it would consider building a large hydro project (Peace Site C) earlier than its proposed 2002 startup
date. This would increase exportable capacity by 900 MW (4,500 GWh of energy) (British Columbia Hydro, 1985). Currently, utilities from California, the Pacific Northwest, and British Columbia are jointly studying the feasibility of the Peace Site C dam. If the assessment is favorable, it appears that BPA's long-term intertie access policy will allocate a much larger portion of intertie capacity to B.C. Hydro. This would make possible the purchase of large amounts of valuable long-term firm energy from B.C. Hydro by the early 1990s.
Any electricity transferred between these regions must travel over the Pacific Northwest-Pacific Southwest Intertie. This network consists of one dc and two ac transmission lines that run from northern Oregon to southern California. The total carrying capacity at present is 5,790 MW. Plans to further upgrade the system by building an additional ac line are currently under the process of review for certificate of convenience and necessity. This line would raise the carrying capacity by approximately 1,600 MW at a cost of $450 million in 1968 dollars (l.4¢/kWh) (California Energy Commission, 1986b, pp. 5-19 — 5-20).
In the past few years, the price of imports from Pacific Northwest utilities has risen from 0.5¢ to 2.3¢/kWh, due mainly to BPA's intertie access policy, which has reduced competition and eliminated the low spill rates formerly applied during very high water levels.[3] Because future rates have not been firmly established, there is some speculation as to whether California will continue to import enough power from the Pacific Northwest to justify construction of this additional line. Barring additional long-term quantity and price commitments for both firm and nonfirm energy, it appears unlikely that the expenditure for any transmission capacity upgrades will be economically justifiable. The intertie expansion issue appears to be a "Catch 22" situation—without assurance of available transmission capacity, buyers and sellers are reluctant to enter into sales contracts, but without transmission contracts, funds for expansion of the intertie are unlikely to be available.
In addition to its existing capacity, the Pacific Northwest has two nuclear plants that were slated for completion in the mid-1980s but that have been delayed due to existing surplus capacity in the region. The NWPPC estimates that the present value of net benefits of finishing these projects is $630 million (Nucleonics Week, 1986). Construction on these plants, referred to as Washington Public Power Supply System (WPPSS) numbers 1 and 3, is scheduled to be restarted and completed when the need for additional capacity in the Pacific Northwest becomes apparent. These plants represent an additional 1,600 MW of generating capacity that could be available in the not-too-distant future. To date, $4.4 billion has been spent on these two projects, and the estimated in-
[3] Rather than spill excess water over the dams and lose potential revenues, Pacific Northwest utilities sold this power very inexpensively.
cremental cost to complete both plants is $2.76 billion (1984 estimate). The preservation costs are $52 million per year.[4] Given these figures, had construction resumed on plants 1 and 3 in 1988, the levelized cost (completion, operating, and finance costs) would have been around 3.7¢/kWh (Bonneville Power Administration, 1984). If construction were to resume at a future date, the levelized cost would be higher because of additional preservation and maintenance expenditures.
Although authorities in the Pacific Northwest are striving to bring about the completion of these plants, they face a number of problems in achieving that goal. BPA, the owner of these plants, does not plan to complete them as a source of exportable energy but will only consider completion if and when the Pacific Northwest region's load growth makes them economic and financing becomes possible.[5] Based on current supply-demand projections, the earliest that either plant could be on-line is 1992, with the most probable startup date being 1999.
California utilities might consider purchasing one of these plants for some share of the sunk costs and then completing and operating it with power dedicated to California. Because these plants can be completed by BPA and brought into use if regional loads grow faster than expected, they are valuable as options and probably would not be sold until they appear to be uneconomic for meeting future loads in the Northwest. Whether such a transaction takes place is likely to be decided on political bases, regardless of the economic costs and benefits.
In the event that additional electric power supplies from the Pacific Northwest or British Columbia become available to California, further expansion of the intertie could become necessary. In addition to the aforementioned construction of an ac line from John Day Dam in northern Oregon, to Tesla, California, another proposed addition is a large dc line from Celilo, Oregon, to either Mead, Nevada, or Phoenix, Arizona. This project would add 2,000 MW of capacity to the system at a cost of approximately $1 billion (1985 dollars) (California Energy Commission, 1980). The transmission capital cost would then be 0.6¢/kWh (assuming a 35-year lifetime and a 5% real interest rate, and a capacity factor on the line of 60%). The cost of these transmission upgrades is relevant to the decision of whether developing new B.C. Hydro supplies or completing the WPPSS plants would be most economic for California utilities, because the total incremental cost of that energy delivered to California is the incremental production cost plus the incremental transmission cost.
The groups likely to be most affected by the outcomes of these negotiations are the ratepayers in the two regions. Pacific Northwest utilities
[4] Midpoint in the estimated range of $24 to $80 million per year.
[5] The estimated holding cost of this policy, excluding deterioration and obsolescence charges, is S81 million per year (assuming a 10% interest rate).
can maintain lower rates by taking advantage of seasonal diversity through power exchanges and supplementing their revenues with surplus power sales. By importing power at a price lower than other alternatives and covering the summer peak demand with power exchanges from the Pacific Northwest, California utilities will also be able to maintain lower prices and further delay capital expenditure for new capacity. In addition, if either one or both of the WPPSS plants were found to be uneconomic in the Northwest and were sold to California utilities, rates in the Pacific Northwest would decrease because payment of some portion of the sunk costs of the project would be required to gain ownership. If the plants (1 and 3) are not used or sold, Pacific Northwest rate-payers or financing interests stand to lose all of the costs accumulated up to that point.[6] Benefits to California ratepayers would be in the form of reduced electricity rates if the incremental costs of the power generated at these plants and delivered to California is less than alternative new baseload sources.
There are problems related to importing additional power from the Pacific Northwest. BPA is obligated to serve the utilities in its area before it can sell to others outside the region. A BPA agreement to supply firm power outside the region requires (by the Pacific Northwest Preference Act of 1964) a clause allowing the agreement to be cancelled with 60 days notice. The option to cancel reduces the value of this power, a point that California utilities must carefully consider before entering into contracts with BPA. Recently, BPA devised firm displacement rates to eliminate this problem. This innovation allows BPA to sell firm power to other Pacific Northwest utilities at a set price, enabling those utilities to individually sell short-run firm power and negotiate a higher price. This arrangement, along with the current intertie access policy, improves prospects for importing firm power from the Pacific Northwest. This development still fails to meet a California need for long-run firm baseload power to meet requirements around the turn of the century and later.
There are two operating constraints that also affect the ability of the California system to accept Northwest imports (California Energy Commission, 1984). First, utilities in California rely on gas- and oil-fired steam boilers for peak load requirements, a use for which these technologies were not designed. Many of these units cannot be taken from a cold shutdown to full output in a short period of time; they must be operated at some minimum level before being available to meet peak loads. This minimum generation requirement reduces the amount of gas and oil generation that can be displaced by imports, especially of nonfirm power, and thereby decreases the value of this power. Second, the addi-
[6] An estimated $3.86 billion in construction costs, plus all preservation costs accumulated up to the time the project is scrapped.
tion of several baseload nuclear plants in California and lower oil and natural gas prices have greatly decreased the variable cost of baseload generation. This has led to a situation in which even nonfirm deliveries from the Northwest (at about 2¢/kWh in 1988) have become more expensive than the variable cost of baseload sources in California. The value of Northwest energy is then dependent on the types of generating capacity it replaces and is further diminished when northern California has good rainfall, which increases the amount of low-cost hydroelectric power available within the state.
Currently, California's demand for Northwest imports to displace existing baseload generation is very small, whereas the demand for power to displace the more expensive oil and gas generation needed for peaking requirements is great. At previous oil and natural gas prices, firm energy could be purchased for a price one-fourth the cost of operating these peaking generators. This leads to further discussion of the benefits derived from importation of electricity (largely firm energy and capacity) from the Southwest.
Southwest Imports
Southern California utilities have been importing a large portion of their baseload resources from the Southwest for a number of years. These resources have come from jointly owned coal plants located in the Southwest, purchases of firm surplus capacity and energy from Southwest utilities, and firm purchases from federal hydroelectric facilities on the Colorado River. Lower-than-expected electricity demand in this region, due to a depressed mining industry, energy conservation, and the recent recession, has led to surplus generating capacity and nonfirm energy, especially in the Rocky Mountain states. California utilities are counting very heavily on this region as a source of continued future imports for at least the next 20 years, as is indicated by the projections listed in Table 6.5. The surpluses in the Southwest are a product of the large fluctuations in daily and seasonal loads, as well as the large base-load component of Southwest generating capacity.
The Arizona-New Mexico-West Texas area and parts of Colorado, like California, are summer peaking, whereas the Rocky Mountain states are winter peaking. More than 60% of the region's generating capacity is coal-fired, with 25% oil- and gas-fired generation. The total capacity is around 30,000 MW and the region's reserve margin in 1985 exceeded 35% (California Energy Commission, 1985d, p. 42). California utilities currently own shares in five Southwest area coal-burning plants and have plans to further increase their ownership in out-of-state coal plants in Nevada, Utah, and New Mexico, as well as nuclear plants in Arizona. These additions would more than double the currently existing
California-held capacity from 2,445 MW to 5,372 MW. California utilities are now buying firm capacity and energy from Southwest utilities, and additional firm contracts are being offered.
The fully allocated total costs of new Southwest baseload construction, including transmission costs, is between 5¢ and 7¢kWh (1985 dollars) (California Energy Commission, 1984). The variable operating costs of Southwest coal plants range from 0.4¢ to 1.6<0162>/kWh. Thus, if excess capacity exists, the relevant economic cost for export sales is quite low. The cost of Southwest nonfirm energy has been in the range of 1.1¢ to 4¢/kWh since 1980. Nonfirm energy costs in 1987 averaged 2.1¢/kWh. Low production costs in the Southwest, in the range of 1-1.4¢/kWh, could allow for further reductions in nonfirm prices, making them very competitive with Northwest prices.
The existing transmission network is adequate for firm energy transfers, but there have been problems in transferring the current levels of nonfirm energy. Recent studies recommend that simultaneous California import capacity (between the Southwest and Northwest) be reduced to correct problems encountered in transfers between Arizona and California. These problems, including loopflow,[7] are due to operation of the Pacific Northwest intertie at high levels and have in the past necessitated the reduction of southwest imports into California. Operation of the Southwest powerlink, a line between Arizona and southern California that was completed in 1984, and the IPP lines, which were completed in 1987, provides a near term solution to this problem. In the longer term, major upgrades of the transmission system may become necessary (California Energy Commission, 1984).
A major transmission project, Palo Verde-Devers #2, has been issued a certificate of public convenience and necessity. However, approval was granted on the condition that the CPUC would have to reconsider the need for the line if the proposed merger between Southern California Edison (SCE) and San Diego Gas and Electric were consummated. According to testimony submitted by Joe D. Pace on behalf of SCE in the FERC hearings on the merger, this line is currently scheduled to become available for commercial operation in June, 1993 (Federal Energy Regulatory Commission, 1989).
The addition of this capacity would raise total transmission capacity from the southwest of California from 5,700 to 6,900 MW. The Palo Verde-Devers line could relieve transmission problems that have, in the past, precluded the importation of considerable surplus energy from Colorado, New Mexico, and Utah. Recent forecasts show that the existing and planned transmission facilities should be able to accommodate the projected levels of nonfirm energy imports from the Southwest.
[7] Loopflow is unscheduled transfers occurring when electricity flows to an unintended part of the system, resulting in lost revenues.
Summary
Electric energy imports are expected to increase (see Table 6.5) in the short term as transmission capacity between California and both the Pacific Northwest and the Southwest increases, new generation facilities come into service, and load management and hydro system enhancement programs continue to be implemented. In the long term, however, importable energy is expected to diminish as demands in the source areas increase, new generating capacity is brought in at a slower pace in the Southwest, and normal precipitation patterns return to the Northwest. As economic prosperity and population growth continue over time, the demand for electricity in California will also increase. The combination of diminishing supply and increasing demand for electric power imports by California utilities will lead to a declining proportion of California's electricity requirements being filled by imported energy. This is not necessarily detrimental for California utilities as there is strategic value associated with in-state gas, oil, and (in the future) possible coal and nuclear generation. The natural gas and coal plants have value as a source of backup energy in the case of performance difficulties encountered with existing nuclear plants, intermittent wind or solar plants, or nonfirm imports. Thus the existence of these plants reduces the probability of California utilities having to make expensive emergency purchases. Also, at present they contribute some firm capacity value to in-state hydro and nonfirm hydro purchases from other regions. Thus there is justification in assigning some added value to in-state generation when comparing it with the cost of out-of-state purchases. (California Energy Commission, 1985a, p. 134).
The level of future imports from the Pacific Northwest is somewhat more uncertain than that from the Southwest, mainly because of the uncertainty associated with the price and availability of that power. BPA, through its intertie access policy, has reduced competition in the supply of Pacific Northwest power, greatly reducing the benefits California utilities receive from such purchases. Rates for nonfirm surplus have increased eightfold since 1979 (California Energy Commission, 1985a, p. 137), and efforts to negotiate long-term rate agreements have been fruitless. Rather than face the risks posed by relying on energy the price of which may be subject to complete control by BPA, California utilities are encouraged to develop cost-effective alternative Southwest or indigenous firm power resources, while leaving open the option to import power if agreements are reached in the future.
The current capacity of the transmission facilities between California and the Pacific Northwest is insufficient to accommodate the potential power transactions between regions, especially in the spring and summer months. One effect of this is that B.C. Hydro, which receives last priority on intertie use, yet which has large exportable supplies, is
severely limited in its ability to sell to California utilities. In addition, most California utilities are participating in the California/Oregon transmission project, despite their inability to negotiate long-term agreements with Pacific Northwest utilities.
The emergence of B.C. Hydro as an important source of low-cost firm energy imports seems almost certain in the near future. As the Pacific Northwest regional surplus declines in coming years, B.C. Hydro, with its large capacity, tremendous resources, and desire to increase its revenues through energy exports, may have the opportunity to greatly increase its sales to California. Although B.C. Hydro controls none of the intertie system, as excess transmission capacity becomes available, the utility will be able to gain greater access to the network, wheeling its power through intertie owners.
Because surplus energy currently exists in the Southwest, as well as adequate transmission capacity to further expand import levels, California utilities are anticipating substantial electric power imports from that region. Also, with the planned additions to the transmission network in the region, import levels will increase even further. Southwest utilities are likely to continue to build mainly coal-fired baseload plants as long as coal prices remain low compared with other fuels. They may also continue to build in excess of their own requirements, depending on the price of surplus energy, the potential for long-term contracts for firm energy, the accuracy of their demand forecasts, and the relative costs of other generation techniques.
Because considerable exportable surpluses of energy exist in both regions, it appears that California utilities can assume that they will be able to make the desired purchases from both regions. One reason for this is that California is the main, if not only, customer for this energy. Either region would therefore be foolish to set high prices that lead California to develop lower-cost alternative sources. If Pacific Northwest power becomes too expensive for continued importation, California utilities will likely be able to rely on B.C. Hydro for increasing amounts of power (if BPA grants intertie access). Therefore, although long-term agreements have not been made with Pacific Northwest utilities, surplus power prices should remain in the range in which California utilities will continue to benefit from such purchases.
IV. ALTERNATIVE NEW CALIFORNIA IN-STATE ELECTRIC POWER SOURCES
In addition to imports of electric power from the Pacific Northwest and the Southwest, California may develop new sources of electricity from in-state investments. These new sources begin with conservation, which
might reduce energy use and therefore reduce the need for new energy sources. More generally, energy may be produced from increased investment in conventional sources of electric power, including coal, natural gas, oil, and nuclear electric power generation. Renewable resources including hydro, solar, and wind energy may be converted into electric power. There is some hope that in the more distant future, nuclear fusion might be a source of nearly unlimited electric power. Finally, miscellaneous sources, including biomass incineration and electric power storage, which expand peak load supply, may offer relatively small increments of electric power. We will consider all of the sources listed except the small increment sources. Geothermal is a major source of electric power in California providing 18% of Pacific Gas and Electric Company's 1986 generation. It is also a potentially large source for future development, although the best sources have already been developed.
Before we examine the cost of some of the alternative energy sources listed above, a methodology for evaluation should be specified. Economists have developed an evaluation system known as benefit/cost analysis for evaluating the relative merits of alternative systems for accomplishing some objective. The subject of analysis in the present case is production of a homogeneous good—electricity. Its benefit is its social value per kilowatthour, multiplied by the number of kilowatthours consumed. Its cost is the value of resources used up in its production process.
A distinction must be made between private investment analysis and social benefit/cost analysis. The former evaluates a proposed investment by identifying the costs paid by the decision-making firm (or individual) and the revenues expected to be received by the firm. Social benefit/cost analysis goes beyond private analysis to identify any costs borne by society at large but not by the decision maker, as well as any benefits that spill over to society at large but are not collected by the decision maker. These spillover costs or benefits are also known as external costs or benefits.
Private decision making based on analysis of private costs and private revenues yields the same results as social benefit/cost analysis in most cases. They differ only when (1) externalities exist, (2) monopoly power distorts prices, or (3) government(s) interfere in markets and distort resource or product prices.[8]
An example of external cost is air pollution, which is imposed on society at large or on one's neighbors but is not paid for by the decision
[8] . Technically, government intervention improves resource allocation efficiency when it corrects for an externality. However, pure cases of such intervention are hard to find. Most intervention is the result of politically powerful interest groups persuading Congress, legislatures, and administrations to intervene in markets and redistribute income or wealth in favor of such interest groups.
maker. Such external costs may be internalized without government intervention when legal action is instituted against a polluter or when a bargain is struck between the parties. In this event, the externality no longer exists. Similarly, an externality exists when a benefit accrues to society at large and cannot be collected by the decision maker who made it possible. An example is a discovery of a nonpatentable basic scientific fact, such as the nature of nuclear fusion.
Most ordinary business decisions do not create significant externalities. Therefore private decision making is in harmony with the general welfare of the society in question. Even when some external costs or benefits exist, they may be minor relative to the costs of correcting them and are therefore best ignored. When externalities are large, then some government intervention might be desirable only if such intervention is likely to improve on resource allocation by internalizing such externalities.
In the analysis to follow, we will examine the benefits and costs of alternative energy sources available to California. Only in the cases of nuclear and conventional coal-fired electric power generation do the external costs appear to be potentially significant. Therefore they will be evaluated in detail.
Major external costs would occur in the event of a meltdown in a nuclear plant or other accident in which a significant amount of radiation is released into the atmosphere. Coal-fired plants may impose externalities because large segments of the population downwind from a coal-fired power plant may suffer from respiratory problems. Both acid rain and the greenhouse effect are potential external costs of coal combustion in electric power generation. Solar and wind conversion systems may offer external benefits. Such potential benefits would be in the form of technological spillovers—declining costs over time as technology advances. Past large federal and state subsidies have paid or possibly overpaid for these potential external benefits.
The reader must be cautioned that the cost estimates shown below are from a variety of sources. Analytic methods are not likely to be uniform. Consequently, cost estimates should be taken as rough approximations of actual costs.
Conservation
People outside the circle of professional economists frequently use the word conservation as if it were a source of energy. From an economic theory perspective, there are two reasons to expect reduced consumption corresponding with higher crude oil prices. First, Figure 6.3 shows that if prices increase from P1 to P 2 , the quantity demanded in the short
run will decline from w to x. In response, oil consumers shift to the most attractive substitutes. However, this substitution process requires a delay as oil consumers use the available information to determine which substitutes are optimal for their particular needs. Thus in the long run consumers and industrial users reduce oil consumption in favor of coal, natural gas, or other energy forms economically substitutable for oil. The longer the period, the greater will be the reduction in demand for the higher-priced oil.
Second, the demand curve may shift as consumers reallocate their scarce income and consume less higher-priced energy in total, including oil. Again, time is required for this income adjustment process. Thus in the short run the demand for crude oil will be highly inelastic (insensitive to oil price changes) but will become more elastic with the passage of time, as illustrated in Figure 6.3.
Some advocates of conservation frequently have in mind a set of government policies inconsistent with the economic meaning of conservation. These policies include new regulations that mandate less energy use, even though consumers would use other resources in lieu of the one constrained by regulation. Illustrations of this policy include mandated home insulation retrofit in order to save energy, without considering the other resources used in the retrofitting process such as the insulation material, labor, nails, etc. Another kind of conservation policy would add taxes to existing prices of specific energy forms. Examples include a gasoline tax and an import tariff on crude oil. Finally, a more benign form of market intervention simply mandates that manufacturers provide more product information to consumers about energy usage, as in the cases of refrigerator and air conditioner energy consumption. Such policies are inconsistent with the economic definition of conservation in all cases where the present value of the benefits (energy saved) is less than the present value of the substitute resources used, together with regulatory costs.
From an economic perspective, the word conservation has a precise but somewhat difficult definition. Conservation of resources takes place when the present value of the consumption of all resources is maximized. In practice, this means that private and governmental users of resources consider the costs and the benefits (or revenues) that are incurred as they make investment and consumption decisions regarding the use of resources and make those investments only when the present value of the benefits exceeds costs by an amount that yields a competitive rate of return. The great merit of this definition is that it leads to conservation of all resources, not just the one that is the target of a specific regulation or other government policy. This economic definition
serves the general interest of society if external costs and benefits are negligible or nonexistent and there are no market distortions due to monopoly or to government intervention.
Advanced Coal Combustion and Coal-Derived Synthetics
Coal is an alternative to crude oil in several applications. Recoverable reserves of coal in the United States and worldwide are extremely large; world coal reserves are 493 billion short tons (2,219 billion barrels of oil equivalent), of which 34% are in the U.S. The heat content represented by these coal reserves is 4.7 times the heat content of the world's estimated recoverable crude oil reserves.
Coal can be liquefied into a crude oil substitute; it can be gasified into a substitute for natural gas that, in turn, is a substitute for crude oil; it can be gasified and burned directly in a gasification combined-cycle electric power plant, or it can be either indirectly or directly converted into gasoline. It can also be burned in conventional electric power generating plants as a substitute for nuclear energy, residual fuel oil, or natural gas.[9] We consider coal liquefaction, gasification, gasification-combined cycle (GCC), and conversion into gasoline because if these processes are economically viable, their large-scale development would affect oil or natural gas demand and prices and therefore the use of these energy sources for electric power generation.
Fluidized-Bed Combustion. In addition to the conventional method of coal combustion for electric power generation, a new process in the technical development stage and not fully proven commercially is fluidized-bed combustion (FBC), which encompasses both atmospheric (AFBC) and pressurized (PFBC) technologies. Bubbling bed and circulating bed are two types of pressurized FBC. The advantages of FBC relative to conventional coal combustion are short construction time, low emissions of both sulfur and nitrogen oxides, fuel flexibility, compatibility for plant retrofits, easier handling of residual products, potential economic feasibility for small-scale operations, and possibly more competitive capital and operating costs in the future.
Offsetting these advantages to some unknown degree, however, is the unproven reliability of large-scale systems and hence the actual costs of the power produced. Furthermore, turbulence in the bubbling bed, which keeps coal particles suspended inside the combustor by air jets, erodes the metal boiler tubes that run through the beds. A joint federal government and privately funded research project was announced in
[9] The social cost of coal-fired electric power generation is discussed in the section on nuclear and conventional coal technologies, below.
early 1988 to solve this problem (Oil Gas Journal, 1988, p. 16). American Electric Power Company will retrofit its idled Tidd coal-fired plant in Ohio for a FBC process to study this issue. It will become a 70-MW capacity pilot plant and if successful, would be transformed into a 320-MW commercial plant, demonstrating retrofit feasibility. Based on information gathered from several small-scale testing facilities, there is some evidence that FBC may make coal-fired power generation an environmentally and economically attractive source of electric power in coming years.
The AFBC electric power generating process burns coal with limestone in an atmospheric pressure fluidized bed suspended by air blown in from below the combustion chamber. The calcium in the limestone captures most of the sulfur released from the coal during combustion. Particulates are captured in a series of cyclones followed by an electrostatic precipitator (Electric Power Research Institute, 1986, p. B-50). Using a fluid boiler design based on the bubbling bed concept, the Electric Power Research Institute (EPRI) has estimated the cost of a 500-MW (net) plant having a capital cost of $1,274/kW of capacity. Using a 7% real interest rate and a 40-year life, the cost of electric power from an AFBC plant is estimated to be 4.41¢/kWh in 1987 cents. Components of this estimate are illustrated in Figure 6.4 (see the bar labeled e ). This figure compares the costs of alternative electric generation technologies discussed below. Included in the comparison are cost estimates for new technologies (such as AFBC) and actual costs for some technologies presently deployed on a commercial scale.
PFBC is another new technology currently under development that uses coal to produce electric power in a more environmentally acceptable manner. In this process, crushed coal is burned with dolomite in a pressurized fluidized bed suspended by air blown in from below the combustion chamber. Pressure in the combustion chamber is maintained at 6-10 times atmospheric pressure. Sulfur particulates are removed by a filter after the hot gases leave the combustor and before the gases are used to drive a gas turbine/electric generator (Electric Power Research Institute, 1986, p. B-52). Based on EPRI data, the cost of power generated by the PFBC process is estimated to be 4.78¢/kWh in 1985 dollars, or 5.05¢ when inflated to 1987 prices (see the bar labeled f in Figure 6.4).
Both AFBC and PFBC plants are in the developmental stages with some retrofits already in use. With their estimated costs being only marginally above conventional coal combustion processes, they offer a promising method of utilizing the large U.S. coal reserves without the troublesome environmental and health consequences of conventional coal combustion.
Neither the availability of large-scale reserves nor the technical feasibility of liquefaction, gasification, or FBC are sufficient evidence that coal is an economic substitute for crude oil. Economic feasibility depends on relative social costs and benefits. The costs shown here are private costs. If the externalities of FBC are not significant (as we believe), then the private cost estimates are reasonable approximations of social costs, and FBC appears to be a promising alternative future source for California electric power generation.
Coal Gasification-Combined Cycle (GCC). Coal may be gasified and then directly burned in a gas-fired electric power generating plant. Operating experience is available from a semicommercial integrated coal gasification-combined-cycle plant at Daggett, California. This plant, known as Cool Water, has been operating since its startup on June 1, 1984. Its net capacity is 103 MW, and it operated at 70.5% of capacity in 1987. Its actual capital cost was $279 million. However, its operator, Southern California Edison, estimates that a similar new plant could be built for approximately $250 million. Using this capital cost, a 7% real interest rate, a 30-year life, and a 65% capacity factor yields an 8.21¢/ kWh cost for electric power production, broken down as shown as bar g in Figure 6.4. In converting 1,000 tons of coal per day into relatively clean-burning gas, air emissions from this plant average about 10-20% of the allowable federal levels for nitrogen oxide, sulfur dioxide, and particulate emissions. At a cost of 8.21¢/kWh, new construction of a GCC plant is not economic relative to other baseload options. However, one might expect further technological improvements in this process. Costs must be reduced by another 50% from these estimates before the GCC alternative becomes attractive.
EPRI has estimated cost data for a plant nearly five times as large as the semicommercial Cool Water plant. Based on a 500-MW net plant capacity, a 30-year life, 7% real interest, coal at $1.52/million Btu, and a heat rate of 9,775 Btu/kWh, the EPRI data indicate a cost of 4.60¢/kWh. Expressed in 1987 prices, this cost becomes 4.85¢/kWh. Thus, a larger plant would appear to incur costs that become attractive when consideration is given to the clean-burning character of GCC compared to conventional coal. Components of this estimate are shown as bar h in Figure 6.4.
Coal Liquefaction. Coal reserves may also be converted to synthetic oil. The proposed Breckenridge coal liquefaction plant, designed to produce 4.2 million barrels of synthetic oil per year, involved a conversion
cost of $96/barrel of oil output in 1987 dollars.[10] This is more than five times the current value of imported oil ($14-$20/barrel). Accordingly, given present technology, coal liquefaction does not appear to be a viable substitute for crude oil in the foreseeable future.
Coal Gasification. Coal gasification is similarly uneconomic. The Great Plains coal gasification plant, partially financed by the U.S. government Synthetic Fuels Corporation, started production in July 1984 but is currently in bankruptcy following withdrawal of the federal subsidy. The cost of converting coal into high-Btu (970 Btu/cubic foot) gas is $8.59/thousand cubic feet in 1987 dollars.[11] This is nearly five times the current market value of natural gas ($1.74 wellhead price, March 1988). Thus coal gasification also appears to be uneconomic for the foreseeable future.
When the Great Plains plant emerges from bankruptcy, the capital cost of $4.08/thousand cubic feet is likely to be eliminated. The most recent operating data for this plant show that operating costs have been reduced to $4.13/thousand cubic feet (U.S. General Accounting Office, 1986, p. 23). The free-market price of natural gas has fallen more than coal prices and well below this operating cost, indicating that the plant is still not economically viable even when omitting the capital cost. In the unlikely event that the value of natural gas exceeds the variable cost of operating and maintaining the plant at the time it emerges from bankruptcy, continued operation of this existing plant would be expected. However, construction of additional coal gasification plants would involve new capital costs and hence such additional coal gasification facilities clearly would not be economically beneficial in the foreseeable future.
Coal to Gasoline. A technology also exists for converting coal directly into gasoline as a substitute for crude oil. With substantial government subsidies, gasoline is produced in South Africa from that nation's large coal reserves. Hitler's Germany produced both oil and gasoline from German coal in World War II. In both cases, government subsidies can be and were justified on the grounds of supply security.
[10] Based on a total capital cost of $2.59 billion and an annual O&M cost of $157 million, in 1984 dollars, a 30-year plant life, and a 7% real interest rate (U.S. Synthetic Fuel Corporation, 1985). The levelized capital cost is $57/barrel in 1987 dollars.
[11] Based on a total capital cost of $2.118 billion and an annual O&M cost of $188.4 million, in 1984 dollars, 125 million cubic feet/day actual production, a 30-year plant life, and a 7% real interest rate (U.S. Synthetic Fuels Corporation, 1985, confirmed by Tenneco). The levelized capital cost is $4.08/thousand cubic feet in 1987 dollars.
More recently, West Germany constructed a pilot plant to test the production of gasoline from coal using the Mobil M process in a plant near Bonn, Germany. The results established the technical feasibility but economic infeasibility of this coal substitution for crude oil in gasoline production.[12] The Bechtel Corporation had earlier estimated that a commercial plant to produce gasoline using the Mobil M process would have a capital cost of $6 billion and that, using a 7% real interest rate, a 30-year life, and a favorable 90% capacity factor, the cost would be $0.8l/gallon (1981 U.S. dollars). This capital cost alone is now approximately 1.6 times the tax-free market value of gasoline. In addition, the cost of coal and operation and maintenance must be borne by the product. In the absence of data on these costs, we roughly estimate them at $0.80/gallon, making the total cost of coal conversion to gasoline about $1.60/gallon in 1981 dollars, or $2.20/gallon in 1087 dollars. These results indicate that this process is uneconomic.
Natural Gas to Gasoline
New Zealand's Synthetic Fuels Corp., Ltd., entered into an agreement with Mobil Oil Corporation in 1980 to build the world's first natural gas-to-methanol-to-gasoline plant using a catalyst developed by Mobil Oil. The lead contractor was Bechtel Pacific Corp. The source of natural gas is the Maui field off the New Zealand coast. This plant has a design capacity of 14,500 barrels/day of gasoline. The capital cost is estimated at U.S. $1.475 billion (Oil and Gas Journal, 1985). The capital cost alone, assuming a 30-year life, a 7% real interest rate, and an optimistic 90% capacity factor, amounts to $0.60/gallon of gasoline (U.S. dollars). As of May 6, 1988, the wholesale spot market price of regular gasoline (excluding tax) in Rotterdam was $0.51/gallon. Thus at zero operating cost, the capital cost alone of gasoline to New Zealand will be more than its market value. Although operating costs are unknown, they are likely to be at about one-half of the capital cost estimated above ($0.25/gallon). The cost of natural gas, valued as low as $2/thousand cubic feet (U.S. dollars), would be $0.43/gallon of gasoline. Therefore natural gas conversion to gasoline costs about U.S. $1.20/gallon, 2.3 times the value of gasoline, in 1984 U.S. dollars. Inflated to 1987 prices, this cost becomes $1.30/gallon. Thus, natural gas conversion to gasoline as a substitute for crude oil is clearly uneconomic.
Oil Shale
Oil shale resources, like coal, are extremely large. Unlike coal, however, oil from shale is not economic under present technologies, costs, and
[12] Based on a pilot plant visit and conversations with plant management.
prices. World oil shale resources are estimated at 88 trillion tons (World Energy Conference, 1983, p. 51). If 10% of this resource ultimately became recoverable, it would amount to nearly 400 billion barrels of oil.
But the economic reality of producing oil from shale is harsh. Current estimates indicate a range from $45 to $60/barrel production costs. Furthermore, the history of oil shale suggests that its production cost increases in tandem with expected revenue. Consequently, oil from shale is not a viable substitute for crude oil under present costs and prices.
Tar Sands
Tar sands and heavy oil resources are very large and are being produced in Alberta, Canada, and California. In addition, heavy oil resources in the Orinoco belt of Venezuela are large but without a subsidy are not producible beyond the pilot plant stage at current costs and prices.
The tar sands deposits located in Alberta, Canada are estimated at 120 billion tons (800 billion barrels) of oil in the ground (World Energy Conference, 1983, p. 51). Commercial production has been under way for nearly 20 years. If 10% of this oil resource is recoverable, then 80 billion barrels of oil are producible from these deposits. According to estimates by Bechtel Corporation, the full cost of new production from the Canadian Athabasca Tar Sands would be $24.90/barrel in 1986 dollars, or $25.70 in 1987 dollars (Leibson, 1987). Thus, with the current price of oil at $14-$20/barrel, new development would not be undertaken, but continued production is profitable so long as revenue covers the variable cost of production.
The Orinoco belt in Venezuela is estimated to contain 150 billion tons (1 trillion barrels) of oil in the ground (World Energy Conference, 1983, p. 51). Again, if 10% of this resource is recoverable, then future production of this heavy oil will yield approximately 100 billion barrels. Recoverable reserves depend on production costs and product prices. In the cases of the Orinoco heavy oils and oil shale, although resources are large, economically viable production must await either much higher product prices or significant technological advances that reduce production costs. In contrast, synthetic oils are currently producible from Canadian tar sands. In all three cases, as product prices increase relative to production costs, recoverable reserves expand. This important principle is illustrated in Figure 6.5. The Orinoco heavy oils and oil shale will become significant substitutable sources for conventional crude oil if crude oil prices should increase substantially in the future. However, when crude oil prices were about $34/barrel in 1980 ($45.50 in 1987 dollars), these large resources were not in production. Therefore both oil shale and Orinoco tars are potential substitutes for crude oil only in the distant future.
Alcohol
Ethyl alcohol (ethanol) may also be a substitute for crude oil-based gasoline, either as a blend (gasohol) or as a 100% substitute for gasoline. It may be produced from abundant U.S. supplies of wood fiber or cereal grains. However, both sources have alternative uses and therefore opportunity costs. Like coal conversion to other energy forms, ethanol is considered here because it is a substitute for oil and, if economically viable, would reduce the demand for oil and thereby exert a downward pressure on oil prices.
The most extensive experience in this process has been in Brazil, where ethanol has been used as a motor fuel blend since the 1930s. Responding to the crude oil and gasoline price increases of the 1970s and to severe declines in sugar prices, the government of Brazil in 1975 started a heavily subsidized hydrous alcohol industry based on its sugar and sugar cane production. Hydrous alcohol (distilled ethanol containing 4.4% water) was to be a full substitute for gasoline. The Brazilian Ministry of Industry and Commerce estimated that the cost of this gasoline substitute was $50.30 per barrel ($1.20 per gallon in U.S. dollars). Other researchers have estimated costs as high as $90.00 per barrel ($2.14 per gallon) in 1982 U.S. dollars (Melo and Perlin, 1984). This translates into $2.52/gallon in 1987 dollars. A Brazilian scholar reviewing this experience concluded that "it can be seen that hydrous alcohol production is not the most effective use of society's resources, at least at the present level of production" (Santiago, 1985, p. 15).
Solar Electric Power
Electric power may be generated from the unlimited energy of the sun. The technology is developing rapidly. The relevant issue is the economic cost. We will examine two conversion methods—indirect generation solar thermal, and direct generation using photovoltaic conversion.
Technology for both systems developed rapidly in the 1980s beginning with Solar One, which started operations in the Mojave Desert in April 1982. As a solar thermal pilot plant, it has a design capacity of only 10 MW. At 35% of capacity operations, this plant would generate about 30,700 MWh per year. However, output reached only 10,000 MWh in 1986. Its levelized capital cost alone, based on a 30 year life, would be $1.14/kWh. This plant is now being dismantled.
We may draw on a model for a larger but nonexistent 100-MW capacity plant under a system of specific assumptions. Sandia National Laboratories has used a spreadsheet approach to model a plant, using from one to six heliostat fields. The fully developed capital cost is estimated to be $769 million. The plant's capacity factor is assumed to be 38% at full development. Cost estimates are in 1983 dollars. Small plant size is
paired with a fossil fuel boiler to assist startup and transition periods. Larger-size plants use thermal storage to maintain electric power production after sunset.
Using a 30-year plant life and a 7% real interest rate, the analysis shows a surprisingly consistent 10-20~/kWh levelized cost, regardless of output level in the various models (Norris, 1986, p. 70). Adjusting the 1083 costs to 1087 prices yields a low estimate of 21.5~/kWh. This result indicates that although the addition of facilities increases output, cost increases in tandem with the added output.
These findings are confirmed in general by a study issued by the CEC. That study found that a combination of three special subsidies would be necessary to bring solar thermal power into commercialization, where it might be able to cover its costs (California Energy Commission, 1986e). These three subsidies would consist of (1) reinstatement of the 15% investment federal energy tax credit, (2) reinstatement of the California 25% investment tax credit, and (3) continuation of the "avoided cost" subsidy that is embedded in the price that utilities and their customers must pay for power produced from qualifying solar power facilities. In the case of the two energy tax credits, these subsidies are "high powered" in that the credits are deductions from income tax liabilities, in contrast to deductions from gross income, which is then subject to taxation. They would extend through the year 2014 when, according to the CEC study assumption, commercialization would exist and solar power revenue would equal or exceed its cost without special subsidies.
Learning from the Solar One experience, LUZ Solar is operating solar thermal plants in Daggett and Kramer Junction, California. Five LUZ Solar plants with a total capacity of 134 MW are selling electric power to Southern California Edison. Under the fixed energy and fixed capacity standard offer number 4 contracts,[13] the plants are viable receiving approximately 6.4~/kWh for energy, plus 2.5~/kWh for capacity for a total income of approximately 9~/kWh. In addition to this standard offer price subsidy these plants receive federal and state tax subsidies under those now defunct programs.
Cost estimates are available from EPRI for a 150 MW capacity solar thermal power station located in the south central part of the United States. Using dry cooling, and assuming a 30 year plant life, a 7% interest rate, and no tax subsidies, the EPRI data indicate a levelized cost of 13.45~/kWh in 1987 dollars, as Figure 6.4, bar k. This is about twice the value of the benefits of electric power production, in spite of the declining cost record.
[13] See discussion, under wind, of various standard offer contracts and their subsidy characteristics.
Solar photovoltaic electric power conversion technology has also advanced rapidly in recent years. Central station power generation by direct photovoltaic conversion appears to be on the verge of economic feasibility. Cost estimates are available from EPRI for five plants of 20 MW each, using a concentrator technology. These estimates indicate a levelized total cost of 7.72¢/kWh in 1987 dollars (see Figure 6.4, bar l ). They assume a 30 year life and a 7% real interest rate. Thus photovoltaic central station technology appears to be moving rapidly toward economic feasibility.
Solar power will still suffer from its intermittent characteristic. When the sun is not shining, all solar power plants will have an output of zero. This reduces the value of solar power plants in terms of their ability to displace conventional capacity unless additional capital outlays are made to provide storage capability.
One significant merit of solar power arises out of the fact that the southern half of the United States has its peak power demand in the summer due to the need for air conditioning during hot midafternoon hours. This seasonal peak need corresponds with solar power production capability.
In sum, the evidence currently available indicates that solar power generation—as a substitute for oil, gas, coal or nuclear power generation—is not yet economically feasible without subsidies, but that technological change is moving rapidly toward unsubsidized viability.
Wind
Congress passed the Public Utility Regulatory Policies Act (PURPA) in November 1978. This act authorized the Federal Energy Regulatory Commission (FERC) to set rates under which electric power utilities would be required to purchase power from small power production facilities using wind as well as biomass, water, solar or other renewable energy sources. PURPA specifies that such rates "shall be just and reasonable to the electric consumers of the electric utility and in the public interest."[14] This legislation further mandated that "no such rule prescribed (by FERC) shall provide for a rate which exceeds the incremental cost to the electric utility of alternative electric energy."[15] The term "incremental cost of alternative electric energy" is defined in legislation as "the cost to the electric utility of the electric energy which, but for the purchase from such generator or small power producer, such utility would generate or purchase from another source."[16]
[14] 16 USC 824a-3, Sec. 210(b).
[15] 16 USC 824a-3, Sec. 210(b)(2).
[16] 16 USC 824a-3, Sec 210(d).
The FERC has published regulations to implement PURPA and directed state regulatory authorities to issue specific purchase prices under the avoided-cost doctrine. Following these directives, the CPUC authorized four standard offers (SOs) under which qualifying facilities (QFs) may sell power and utilities must purchase power.
SOs 1 and 3 are for short-term price contracts and differ primarily according to the size of the QF. SO 2, currently in suspension, is identical to SO I for energy : i.e., the QF is paid full short-run avoided cost for all energy delivered to the utility. SO 2 is a long-term offer for capacity, allowing fixed capacity payments for the life of the contract, which may extend up to 30 years. SO 4, also in suspension, has three payment options for energy. These options are a mixture of short-term and fixed prices. The fixed energy prices extend to 10 years. SO 4 allows up to 30 years of fixed capacity prices and is considered both a short-term contract for energy and a long-term contract for capacity. New contracts under SO 4 were suspended on April 17, 1985, at the request of the state utilities, when it was determined that actual avoided costs were not increasing as rapidly as expected and reflected in the fixed contract buying price. Thus utilities and their customers faced a situation in which they would be required to pay prices well in excess of the incremental costs of power generated from existing utility-owned natural-gas-fired facilities. This was a major problem for the fixed-price provision of SO 4 and a minor problem for the two unsuspended alternatives, SOs 1 and 3. The latter offered prices that varied every three months, depending primarily on natural gas prices.
A continuing problem with SOs 1 and 3 is that purchase prices are computed primarily on the basis of natural gas prices[17] when, in fact, there are often lower-cost alternative sources of power to the state's utilities in the form of energy supplies from the Pacific Northwest and the Southwest and off-peak nuclear when the relevant cost is limited to variable generating costs. (Electricity imports were discussed in Section III of this chapter.) Such power has been and still is available at time of peak, intermediate (midpeak) and off-peak periods. The Pacific Northwest is a winter peaking region, whereas California has a summer peak demand. Both regions gain from an exchange of power, a condition that is likely to continue into the foreseeable future. However, CPUC regulations specifically prohibit utilities from curtailing purchases from the QFs and replacing them with cheaper power from alternative sources except under the following conditions: (1) Purchases may be interrupted by the buying utility when necessary to repair, upgrade, or maintain
[17] In addition to natural gas prices, the cost of economy imports, particularly from the Northwest, is considered. Further, as noted above, the minimum load constraint requires the rejection of some economy energy even in the absence of the QFs.
its lines or equipment and then only with adequate notice. (2) Purchases may be interrupted or the purchase price may be lowered when the utility otherwise would be forced to cut back on generation from its own hydroelectric plants, leading to hydro spill, or when a utility would incur "negative avoided costs." The latter are defined as "a situation where, due to operational circumstances, purchases from QFs would result in costs greater than those which the utility would incur if it did not make such purchases, but instead generated an equivalent amount of energy itself" (California Energy Commission, 1986d, p. 11).
The availability of low-cost energy from purchase sources such as the Pacific Northwest does not qualify under this second rule. Also, these curtailments and price reduction options are not available under SO 3. Authorized curtailment due to hydro spill or to negative avoided cost has not been reported by any of the three investor-owned California utilities in their quarterly filings to the CPUC through 1985 (California Energy Commission, 1986d, p. 11).
Suspended SOs 2 and 4 allowed 15- to 30-year purchase contracts. Both limited the right of utilities to curtail purchases from the QFs under either hydro spill or negative avoided-cost conditions. Also, both carried fixed capacity payments. For plants of less than 50-MW capacity, the QF owner having a signed contract with a public utility may, at his option, enter into a long-term agreement as outlined above. Thermal plants of more than 50-MW capacity require a favorable "need" certification from the CEC to enter into such an agreement. As a consequence of this rule, many plants have been built with capacities slightly under 50 MW.
The CEC has concluded that "by the time the CPUC moved to suspend the long-run Standard Offers (2 and 4) . . . far more QF capacity had signed the standard offers than the utilities could possibly need for the foreseeable future." This result was admittedly stimulated by "too much encouragement" from the CEC and the CPUC (California Energy Commission, 1986b, pp. 3-41).
As a partial solution to this problem, the CEC proposes that for planned plants in excess of 50-MW capacity and therefore subject to its "need" approval, two conditions be imposed on final long-term contracts. First, QFs should accept "a reasonable degree" of utility dispatch control, and second, payments for QF "as-available" power should be based on utility short-run marginal costs (California Energy Commission, 1986b, pp. 5-55). Dispatchability is defined as "the ability of the purchasing utility to physically curtail the output of the facility when either less expensive supplies are available or the power cannot physically be taken by the utility system without forcing the curtailment of core resources" (California Energy Commission, 1986b, pp. 6-8). Thus both
physical and economic need tests would be applied. However, all QFs having less than 50-MW capacity would escape CEC jurisdiction. (The CEC is considering extending its jurisdiction down to 20-MW plants.)
For other QFs (less than 50-MW capacity), the CEC makes the interesting suggestion that the CPUC allow utilities to "buy out" of interim contracts that fail to meet the physical and economic need tests. The interest of resource conservation would be served by this procedure in all cases where the present value of costs of building and operating the QF covered by an interim contract are greater than the present value of the electric power produced by such facilities.
The situation described above raises a question of whether the PURPA legislation is being violated. The legislation states that the prescribed rates "shall be just and reasonable to the electric consumers of the electric utility." But if utilities have power sources, including purchases from other regions at prices less than the CPUC prescribed rates paid to QFs, then California electric power consumers are being required to pay more than "reasonable" rates. California consumers may thus be required to subsidize QFs via a hidden subsidy embedded in the avoided-cost system.
The only available published estimate of the magnitude of this subsidy is in a recent report to the CEC by Polydyne & Associates, Inc. This report estimated that in 1985, the "avoided energy cost subsidies" amounted to $60 million dollars for wind QFs, in addition to the state and federal tax subsidies in that year" (California Energy Commission, 1986e, pp. 1-16). Consistent with the CEC estimate, Mr. Richard A. Clarke, Chairman of the PG&E Board of Directors, has estimated that in 1985 PG&E alone paid $45 million more for QF power than a like amount of power would have cost from other sources (Forbes, 1986). Chapter 9 provides estimates of the present value of excess avoided cost payments to windmill owners through 2005.
The CEC has analyzed the levelized cost of wind energy conversion systems for large-scale turbines. This analysis, based on 2,000-4,000 kW capacity turbines, indicates a levelized cost of 3.6¢/kWh (California Energy Commission, 1985e, table 5). The analysis is of doubtful value for the following reasons: (1) The CEC staff has more recently concluded that such large-scale facilities are less economic than turbines of about 100 kW capacity. For this reason alone, the CEC cost estimate may be overstated. For other reasons enumerated below, the estimate appears to significantly understate the true costs. (2) The capital cost estimates as well as operating costs are for operations beginning in the year 1995, 10 years after the study was conducted. Forecast costs assume that capital cost per unit of capacity will fall by half for every doubling of units sold. If such technological advances and learning curve benefits fail to
materialize, then costs are underestimated. (3) Even if the technological and learning curve advances occur as hoped, the CEC failed to consider an offsetting fact of economic life. In resource development, the best resources are generally developed first, leaving lower-quality resources for later development. This principle applies to wind site development. As more wind farms are developed, the sites developed later are likely to have lower wind velocities and possibly less reliable wind resources. This translates into higher costs, which are certain to offset some, and perhaps all of the gains from technological and learning advances. (4) The analysis assumed operations at 35% of capacity. The record of improvements in percent of capacity operations from 1985 through 1987 is shown in Table 6.8. Limits on capacity operations are due not only to technology, which will probably continue to improve, but also to the intermittent character of the wind, which is not subject to improvement. The assumed 35% capacity rate for wind operations in 1995 appears to be highly optimistic. A 25% capacity rate would raise the CEC cost estimate to 5¢/kWh. (5) The CEC assumed a 30-year life for each turbine and tower. Given problems of metal fatigue, plus an assumed high rate of technological change, a 30-year life seems quite improbable. (6) The analysis fails to include any charge for land lease, for periodic major repairs, or for transmission losses. It does include a modest 0.2¢/kWh for operation and maintenance. (7) Finally, in estimating the cost of wind power for nonutility company producers, the CEC analysis incorrectly reduced costs by an amount equal to the federal and state energy tax credits. These are private benefits and do not reflect social gains. Such tax subsidies are merely transfer payments. The CEC should be concerned with social, not private, benefit/cost analysis. In any event, these tax credits have been eliminated. In general, the CEC estimate appears to be unduly optimistic for wind energy conversion.
A very detailed model of wind energy costs has been constructed at PG&E. This model permits conclusions to be drawn regarding the effects of (1) different stages of development and (2) different tax benefits related to wind conversion costs. For small turbines (100 kW capacity), with an installed cost of $1,250/kW, having a 30 year life, and operating at 33% of capacity, the PG&E model indicates that the cost on the best site would be 6.09¢/kWh (1985 cents) for the best remaining sites, assuming no tax credits except the 10% investment tax credit and a five year depreciation schedule for income tax purposes (Pepper, 1985, p. 5). This cost estimate would apply to the first 100 MW of capacity added. Inflating to 1987 prices, this estimate becomes 6.46¢/kWh. If 600 MW were added to the 1985 output, the PG&E estimates indicate that 8.5¢/ kWh (1987 dollars) would be the cost and therefore the required price to bring forth this quantity. We have adjusted the PG&E cost-price esti-
mates to 1987 dollars for larger quantity additions and presented the results in Table 6.9.
Again, the 33% capacity factor appears to be unduly optimistic. It was used by PG&E "because this is about the average capacity factor projected in limited partnership offerings by private wind developers" (Pepper, 1985, p. 4). The study noted that the 33% capacity factor "is higher than the best average capacity factor of 13% achieved by some Altamont Pass wind farms in 1984." If the assumed capacity rate were changed from 33% to 25%, the cost for the first 100 MW addition would increase to 8.4¢/kWh. The estimated PG&E supply prices adjusted to a 25% capacity factor are also presented in Table 6.9. Given what we believe to be a more realistic capacity factor, the price required to generate another 100 MW of wind power would be 8.4¢/kWh, the value included in Figure 6.4, bar m.
This model avoids most of the problems noted above in connection with the CEC analysis. It assumes a lease fee of 2% of gross revenues for years 1-9, and 10% thereafter. It assumes that major repairs will be incurred amounting to 4% of the capital cost and that these will be required every five years. It assumes a forced outage rate of 10% of annual output, and transmission losses of 4%. The PG&E study assumed a 13% nominal interest charge on borrowed funds amounting to 42% of the required capital. On the equity funds, the study allowed a 25% nominal return. Our standard cost of funds has been 7% real in contrast to the nominal rate used by PG&E. With inflation rates less than the difference, the PG&E costs would be slightly higher than our other estimates summarized in Table 6.12.
The PG&E model also permits a reasonably accurate assessment of the impact of special tax subsidies that have been available to wind energy development. The analysis reported above assumes a 10% Investment Tax Credit that was (until the 1986 tax legislation) available to all industries, plus favorable depreciation rules. When the model is run to include a 15% federal energy tax credit (ETC) and a 25% California ETC, the cost declines from 6.09¢ to 1.66¢/kWh for the initial development (using a 33% capacity rate) and to 2.32¢/kWh Using a 25% capacity rate (1985 dollars). Thus, the tax subsidies granted by the federal and state governments (not including the subsidies embedded in the avoided-cost selling price) have the effect of reducing after-tax costs by more than 72% and consequently have stimulated the flow of capital into wind energy conversion. Whether this public policy was appropriate depends on the value of any external benefits from wind energy development.
The Polydyne study also provides some analysis relevant to the energy tax subsidies. Polydyne found that "the extension of either the federal or
state tax credit is sufficient for sustained commercialization of wind technology. With elimination of both credits, the replacement market never materializes and the market eventually disappears" (California Energy Commission, 1986e, pp. 1-23). The credits to which the study refers are a 25% ETC from the State of California, and a similar 25% federal ETC. Unlike the 10% investment tax credit, which applies to all industries including wind, the referenced ETCs are special subsidies for energy. The subsidies, granted between 1978 and 1980 when the California Legislature enacted a 25% ETC and the Congress enacted a matching 25% ETC, are additive and therefore amount to a 50% tax subsidy. The federal credit expired as of December 31, 1985 and the California credit expired at the end of 1986. Thus, liberal tax credits were in effect for about seven years. The tax revision legislation of 1986 eliminated the investment tax credit formerly applicable to all wind and solar investments. The special credit was not renewed for wind, but a 15% credit was included for solar energy investments.
The Polydyne study (California Energy Commission, 1986e)makes two arguments in support of special subsidies for wind (and solar electric) power generation. First, it notes that other energy and electric power sources have received subsidies and argues that on the basis of equity, wind should also be granted subsidies.[18] Second, although private costs of wind conversion currently exceed the value of the electric power produced, these costs will decrease over time due to technological improvements and the learning curve with the result that wind electric power generation will ultimately produce power that is competitive with alternative systems.[19] It is further argued that this economic position would not be attained in the absence of the special subsidies. However, as we pointed out above, with additional wind power development, the quality of new sites deteriorates leading to increasing costs as development continues. Thus, the declining costs anticipated in the Polydyne study may only offset increasing costs due to site quality deterioration.
One of the major problems of wind electric power generation is the intermittent character of wind energy. Power is generated only when the wind is blowing. "Such intermittence can cause the output of a wind
[18] This subsidy allegation is of questionable validity. In the past, oil and gas production in the United States has been heavily subsidized. However, the important Percentage Depletion subsidy has been entirely removed for all integrated oil companies for both their oil and gas production. The subsidy has been retained in reduced form for politically favored small oil companies. Nonetheless, the price of oil is not determined in world markets Therefore, oil and gas are not subsidized in electric power production. Coal receives no subsidies of any significance. Nuclear power received federal subsidies in the early history of its development. Any remaining government subsidies are now more than offset by regulatory burdens imposed on nuclear power production.
[19] This argument is an assumption in the Polydyne study.
farm or array to fluctuate (often by the minute), which in turn could adversely affect the operation of the grid; these adverse effects could be magnified if wind power comprises a large proportion of the system's generating capacity" (Solar Energy Research Institute, 1985, p. 34).
A related problem of reliability is due to bunching many turbines in a wind farm, creating variation in power production. This problem was not anticipated and is still not quantified. A well-known researcher in this field wrote: "Array losses, once thought to be minor, have proven to be considerable and are not well understood. It is common to see wind power stations producing 10-30% less energy than the wind speeds and wind turbine power curves indicate they should produce. Wake effects, 'off-yaw' operation, frequent starts and stops, high-wind cut-outs, soiled blades, and wire losses need to be better understood" (Lynette, 1985, pp. 94-95). As a result of the intermittence problems, wind energy conversion systems cannot be considered part of an electric utility's reliable capacity . Instead, as power from this source is delivered, it becomes a substitute for other sources of comparable or lesser value. To the extent that the alternative energy source that it displaces is available at lower cost, then the higher cost of new wind power conversion plants contributes to increased electric power rates that consumers must pay. After such plants are built, then the relevant marginal costs are very low.
On a daily basis, peak summer winds normally come after 6:00 P.M. However, peak PG&E power demand occurs around 3:00 or 4:00 P.M. (Smith, Steeley, and Hillesland, 1984, p. 4). Thus, even under normal summer conditions, peak production and peak demand do not correspond.
A particularly vexing problem occurs on the hottest days of the summer. When consumer demand for air conditioning plus other uses is highest, wind velocity falls off sharply. This problem was first documented on July 17 and 18, 1984. July 17 was the second-highest demand day in the PG&E history. The record of Altamont wind electric power generation is plotted in Figure 6.6 with PG&E load requirements by hour for these two days. We find a perversity of wind reliability, especially on the peak demand day, July 17. Wind generation was approximately zero when peak demand occurred during the 3:00 and 4:00 P.M. hours. On the following day when demand was down by only 3%, generation was again weak at midday but increased sharply to 4 P.M. and then reached a double peak at midnight. This behavior led the PG&E analyst to observe that "hot days are often followed by very windy days" (Smith, Steeley), and Hillesland, 1984, p. 4).
This problem was further documented on July 9, 1985, when PG&E experienced its three highest hourly loads in company history due again to very high afternoon temperatures in the company service area. The
record of power loads in the PG&E service area and wind power production from the Altamont wind farm area is shown in Figure 6.7. This record shows that peak level wind-generated electric power occurred a couple hours before and after midnight when the load demand was at its minimum. Then as peak loads were approached from 10:00 A.M. through 2:00 P.M., wind power output was approximately zero. By 4:00 EM., when the peak demand was reached, wind electricity output had increased only to its average for the first six months of 1985 (Smith, Steeley, Ilyin, and Hillesland, 1985).
Although diurnal wind variations at Altamont Pass are not ideally matched to the demand pattern, the seasonal variation is better matched to the summer-peaking demand. The diurnal and seasonal supply/ demand match may be better or worse at other sites.
The benefit of wind energy conversion is given by the value of its electric power. The selling price for wind energy is determined by legislation and regulations as indicated above. PG&E has the highest avoided-cost rates of California's three largest utilities. These rates, based primarily on natural gas prices and heat rates from conversion of natural gas to electric power, plus consideration of economic imports, are shown in Figure 6.7. Following the sharp decline in oil prices beginning in late 1985, natural gas prices declined also. With a lag of a few months, the computed avoided cost prices declined in 1986. Whereas energy prices averaged about 6¢/kWh from 1980 through 1985, they declined to about 2.8¢/kWh for the May-July 1988 quarter.
Capacity payments would add a minor 0.7¢/kWh to energy prices as delivered during the summer months from May I through September 30, and an insignificant 0.04¢/kWh for the winter months from October 1 through April 30. Thus even on the basis of avoided costs, the total value of electric power, including capacity payments, is no more than about 6¢/kWh in the period since May 1985.
To summarize, there are several factors that lead to uneconomic investment in solar and wind qualifying facilities. These include avoided-cost payments calculated on the basis of natural gas prices, long-term contracts with high escalation rates made on the basis of early 1980s prices, and extremely generous tax credits. At the same time, less costly electric power sources have been and are still available from the Pacific Northwest and the Southwest. Accordingly, if payments for wind or other QFs exceed these alternative costs, the nation, and California in particular, may be wasting its resources by diverting them into development of new wind and solar systems where resources used are more valuable than the power produced by such QFs.
There are great uncertainties regarding the economic feasibility of wind electric power generation. The industry has expanded rapidly, es-
pecially in California where, in 1984, 97% of the U.S. installed wind capacity existed (California Energy Commission, 1986e, pp. 1-8). The subsidies that have stimulated wind energy systems are private benefits for the investor, not social benefits for the nation. They are justified only if external benefits created by wind power are equal to or greater than the subsidies. The most likely external benefit would be due to technological spillovers in which costs of wind power generation would decline over time as technology advances. However, there is no proof that external benefits of the magnitude required actually exist. Subsidies have been in effect for nearly 10 years with little evidence that an economically viable wind industry has been established.
The best estimate of the cost for wind energy conversion is about 8.4¢/kWh for up to 100 MW of additions to output under current cost conditions.[20] Given present oil and gas costs (as well as coal and perhaps nuclear costs) wind power appears to be unattractive, from a social benefit-cost perspective. However, oil and gas prices must ultimately rise as existing reserves are depleted and costs of finding and producing new oil and gas discoveries resume their escalation. Thus around the turn of the century, wind is likely to be a more promising source for displacing oil and gas in electric power generation for California.
Energy Storage
An electric power storage system may be an economically desirable adjunct to baseload and to some intermediate generating systems. Nuclear plants are most efficient when they operate continuously. The cost of closing them down is high during the few hours from 1 A.M. to about 5 A.M. when demand is low. Similarly, coal- and baseload oil-fired plants cannot be economically shut down for short periods, although they may be operated economically at reduced output. When baseload output exceeds market demand, the power produced is of no social value. Its opportunity cost is zero. If this power can be stored, the only cost is the capital and operating cost of the storage unit.
Wind energy conversion systems create the same problem where power generation is at its peak in the weak demand hours. This is the problem in the Altamont pass wind farm area, where peak power production does not match peak daily demand. Thus, if electric power from these systems can be stored when its opportunity cost is zero, the storage system will be efficient if storage costs alone (no energy charge) are less than the value of the energy recovered during peak demand periods.
The choices for storage systems are (1) pumped-hydro storage, (2) compressed-air energy storage (CAES), and (3) battery storage. Pumped-hydro storage offers the following advantages: (1) "Creation of
[20] For alternative estimates of costs see Chapter 9.
energy reserves available almost immediately without external aid, (2) use of proven installations and machines which are easy to operate and highly efficient, (3) adoption of the characteristics of the installation to a wide range of outputs and output periods, and (4) the high reliability of installations which have a useful life and require very little upkeep" (Henry and Graeser, 1983).
For pumped-storage system costs, we may draw on the historical experience of the PG&E Helms pumped-storage facility near Fresno, California. This plant, in operation since 1984, has a capital cost of $854,661,000 ($814/kW of capacity) (U.S. Department of Energy, 1985, table 11). The cost per unit of power generated in 1985 is 2.79¢/kWh. Inflating the variable costs to 1987 prices yields a cost of 2.82¢/kWh.
Confirming estimates are provided by EPRI for three pumped-storage units of 350-MW capacity each. Using a 50-year life, a 7% real interest rate, and a 30% capacity factor, EPRI estimates mature system costs to be 3.14¢/kWh, as shown in Figure 6.4, bar n .
In effect, storage of electric power available when supply exceeds demand is a low-cost source of peak power supplies. Expansion of pumped-storage systems would seem to be in order. However, the CEC notes the difficulty of finding sites for new pumped-hydro reservoirs (California Energy Commission, 1986c, p. 17).
A CAES system may use salt domes, most of which are located in the Gulf of Mexico region, an abandoned mine (rock storage), or an aquifer. Potential sites for all three types exist in California, but with very limited choice. Based on 220 MW of capacity, a 30-year life, and a 7% real interest rate, costs are estimated to vary from 1.91¢/kWh for aquifer and salt cavern storage to 2.26¢/kWh for rock storage, in 1987 prices.
Biomass
Biomass as a source of electric power generation via incineration would seem to solve two problems—waste disposal and electric power generation. However, costs are high. Using EPRI data for a 45-MW municipal refuse steam plant having a 20-year life and a 65% capacity factor, we find a cost of 9.42¢/kWh, as shown in Figure 6.4, bar o . These estimates do not include costs of supplemental energy sources, nor offsetting benefits due to reducing the mass of refuse material to mere ash, or the recovery of ferrous metals that might be recovered from the ash. Biomass is an economically viable process only if the value of these benefits is greater than about 5¢/kWh, The CEC holds that the difficult combustion characteristics of refuse materials makes cost reductions hard to achieve. Furthermore, "requirements in many areas of the state for advanced NO emission controls and for special ash handling and disposal increase the development costs" (California Energy Commission, 1986c, p. 21).
Geothermal
Geothermal resources are already economically producing baseload electric power at The Geysers plant in California. The plants use dry steam where reservoir temperatures exceed 410°F and the generators are driven by direct-flash dry steam. There may be additional dry steam development opportunities in the 12 western states. The present 2,000 MW capacity can be increased to approximately 12,000 MW with full development of the dry steam resources.[21]
Additional baseload geothermal development opportunities exist in the form of moderate-temperature resources in the range of 300°-410°F. The potential power output from full development of these lower-temperature hydrothermal resources is estimated to be about 10,000 MW. At Heber, California, in the Imperial Valley, a 70-MW capacity (46.6 MW net) demonstration plant has established the technical feasibility of electric power generation using a binary-cycle process. Because moderate temperature reservoirs do not allow direct flash, the Heber plant utilizes a hydrocarbon working fluid mixture consisting of 90% isobutane and 10% isopentane. The heat from the geothermal hot water is transferred to the hydrocarbon via a heat exchanger. The hydrocarbon mixture has a lower boiling point and its vapor drives the turbine.
The geothermal hot water is a brine and consequently is enclosed in a loop and continuously reinjected as cooled brine. This reinjection process requires substantial electric power. Consequently, about one-third of the gross power production is utilized within the plant, and the net generation is two-thirds of the gross. The hydrocarbon mixture is also in a closed loop. After passing through a condenser, it is recycled through a heat exchanger.
According to EPRI research a commercial-scale plant with a net capacity of 50 MW can be constructed for $1750/kW of capacity, excluding reservoir development costs. The levelized cost of electricity from such a plant in 1985 dollars, using a 7% real interest rate, a 30-year life, and a 65% capacity factor, is estimated at 7.88¢/kWh. Expressed in terms of 1987 dollars the cost is 8.33¢/kWh, as shown in Figure 6.4, bar p. This cost is likely to decline with technological progress as normally occurs in a new technology. This gain could be lost if geothermal electric power generation creates severe environmental problems.
One example of further geothermal potential is the Dixie Valley, Nevada, resource. If fully developed, this resource would equal or exceed The Geysers, although it is a liquid-dominated rather than dry steam resource. Dixie Valley is now being developed in small projects, full development awaiting expanded transmission access to California markets.
[21] John Bigger, Project Manager, EPRI, quoted in Douglas (1987).
Nuclear and Conventional Coal Technologies
Nuclear fission and coal have been the major substitutes for residual fuel oil in baseload electric power generation. Crude oil price increases in the 1970s created significant advantages for nuclear and coal baseload electric power generation. In addition to the price advantage, nuclear power generation benefited from its greater supply security and its absence of air pollution (CO2 , CO, NO, and particulates). The security point was made a public issue beginning with the OPEC oil embargo in 1973-1974, and was then reinforced by threats in the 1970s of using oil supplies as a "political weapon." It is further emphasized by periodic labor disputes in which coal supplies are restricted, and by growing worldwide concern for acid rain, the greenhouse effect, and other air pollution that occurs with hydrocarbon electric power generation.
EPRI has estimated costs for a nuclear light water reactor that is scheduled to be available in 1995. For this 1100-MW (net) reactor, total capital costs are estimated to be $1,564/kW capacity. Using a 30-year life, a 7% real interest rate, and a 65% capacity factor, the levelized capital cost would be 2.21¢/kWh. The total cost, including charges for decommissioning and waste storage, amount to 3.56¢/kWh, in 1985 constant dollars. Expressed in 1987 dollars, this estimate becomes 3.76¢/kWh, as shown in Figure 6.4, bar d .
Using similar assumptions, EPRI data may be used to estimate costs for a conventional coal-steam generating plant in the West. For two 500-MW plants operating at 65% capacity for 40 years, we estimate a cost of 4.25¢/kWh in 1987 constant dollars, as shown in Figure 6.4, bar e.
The EPRI data indicate an advantage for nuclear power for the United States as a whole. However, both coal and nuclear costs differ by region, and coal is generally found to have the advantage where generating plants are located near the coal resource, nuclear the advantage in other areas.
The Organization for Economic Cooperation and Development (OECD) has provided estimates of electric power generation for new nuclear and coal-fired plants for 13 countries. Like the EPRI analysis, the OECD study estimated levelized costs for plants that would begin operating in 1995. This study assumed a 72% capacity factor, a 25-year life of plant, decommission costs amounting to 10% of the initial undiscounted investment, and a 5% real interest rate. A 7.8- to 10-year construction time was assumed for the United States. For three regions in the United States, OECD cost estimates are shown in Figure 6.4, bars a, b, c, and i. (The value for nuclear power, bar i, is an average of the values 4.76, 4.78, and 4.66 ¢/kWh for the Eastern, Central, and Rocky Mountain regions, respectively.) The ratio of coal to nuclear cost varies by region, primarily because of the variation in coal cost, nuclear having the
cost advantage in the Eastern U.S. and coal in the Central U.S. and Rocky Mountains.
The major differences between the two studies are as follows: (1) The OECD study assumed a 25-year plant life, in contrast to the EPRI 30-year life, a factor that would show higher costs for the OECD study. (2) The OECD study allowed a 72% operating capacity whereas EPRI used a more conservative 65% capacity factor. Points one and two tend to be offsetting forces. (3) The OECD study used a 5% interest rate whereas 7% was used for the EPRI data, a factor that would result in lower costs in the OECD estimates. (4) The OECD study is based on constant January 1984 dollars, whereas the EPRI base is constant January 1985 dollars. We have raised both to 1987 dollars. (5) Finally, the OECD provided estimates for three regions whereas EPRI data are not region-specific. Unfortunately, the region west of the Rocky Mountains is not included in the OECD analysis.
When we compare the two estimates, we find that coal has an advantage in regions where coal is available without significant transportation costs. The OECD findings tend to confirm the EPRI data. The differences may be due to regional versus national conditions.
The OECD findings based on January 1984 data have, in turn, been reviewed and updated to 1986 by a British consulting firm. Prices for coal delivered to electric utilities in the United States reached a peak in 1984 at $1.66/million Btu. By 1986, they had fallen 5% to $1.58, while capital costs for nuclear power construction, particularly in the United States, continued to increase. Consequently, the nuclear cost advantage that the OECD report observed had diminished by 1986. The Cambridge Energy Research, Ltd., study, using 1986 data, concluded that overall, the results show that the once-prevalent view that nuclear is cheaper than coal cannot now be used as a basis for rational decision making by utilities and governments. This does not mean that coal represents the cheaper option, simply that the uncertainty is great and that under a broad range of assumptions nuclear power is unlikely to offer substantial economic benefits. The report also demonstrates, however, that in those countries that have managed to control nuclear costs effectively, the economic advantage offered by nuclear power can be considerable (Cambridge Energy Research, Ltd., 1987, p. 52).
The record of increasing construction periods for U.S. nuclear reactors is shown in Figure 6.9. This diagram shows the number of months elapsed from the nuclear steam supply system order issue date to the date of commercial operation. Whereas nuclear plants were constructed in about four years from 1960 through 1970, rapid escalation of construction time caused plants completed in the years 1982 through 1986 to require about 13-15 years construction time. The Diablo Canyon
plant on the California coast required not 5 years but 15.5 years to completion in 1985. Instead of the planned $320 million capital cost, the final cost was $5,500 million. Part of this cost increase was due to the unexpected double-digit inflation and consequent high interest rates of the 1970s. The remainder of the responsibility belongs jointly to PG&E for faulty planning and execution of construction, and to the protest movement for its delaying tactics through repetitious legal intervention. The division of this costly burden of responsibility is unknown. Regardless of who is to blame for the cost overruns, and regardless of whether the CPUC allows full or partial cost recovery for PG&E, the cost of this overrun will be borne by society in general, because some of its resources have been wasted.
This long construction period is unique to the political institutions and power structure of the United States. Other major nations (the OECD group) are able to construct nuclear power plants in less time. This is reflected in relative capital costs. Figure 6.10 shows that capital costs are highest in the United States, approximately three times as high as in France and Belgium. The reason for the large U.S. disadvantage is not likely to be that U.S. reactor construction firms are only one-third as efficient as those in France and Belgium. Rather, the explanation is more likely to be found in the relatively extensive U.S. regulatory system, the practice of government mandating changes in construction requirements after contracts have been let, and in the effectiveness of nuclear power protest groups in the United States relative to other countries. The latter is especially important. Protest groups, through legal action, are able to halt construction repeatedly in the United States. Where lengthy construction delays can be forced, in a framework of high interest rates, the construction cycle is lengthened and capital costs increase accordingly. Support for this point is given in Figure 6.9 showing the increasingly long construction time for reactors built in the United States.
International cost comparisons may be distorted by exchange rates. To avoid this problem, we may compare ratios of electricity generating costs for nuclear and coal by country. Figure 6.11 shows costs in January 1984 constant U.S. cents per kilowatthour. Costs of electric power generated by nuclear are only 56% of coal generation costs in France.[22] The United States is on the other end of the spectrum, with nuclear power having a significant disadvantage over coal in the Rocky Mountain region. As shown in Figure 6.4, nuclear has the advantage relative to coal in the eastern region of the United States.
Future costs for nuclear-generated electric power may also be overstated. The long-run trend of costs for new technologies normally de-
[22] Low French costs may be due in part to subsidies paid by the French government.
clines as the technology is perfected. This has been true for new products of chemistry like rayon, nylon, and plastics, as well as for high technology products such as computers, televisions, and cameras. Exceptions to this generalization are rare. Nuclear power costs have defied the generalization. The protest movement may be the primary explanation. Another possible factor is that nuclear power plant construction has not been standardized in the United States. The Atomic Industrial Forum (AIF) has argued that nuclear power plants could be constructed in the United States at 55% less than recent best-cost experience (Atomic Industrial Forum, 1986). The savings that AIF anticipates would come from "shorter construction schedules, which would greatly reduce financing costs, and from amortization of the design among several buyers . . . In addition, standardization would lower manufacturing costs, sharpen construction practices, boost labor productivity, allow the use of modularization, and enable builders to share construction experience" (Atomic Industrial Forum, 1986, p. 1). The standardization approach would replace what the chairman of the Nuclear Regulatory Commission has described in recent congressional testimony as the "design-as-you-go" approach.
The coal-fired and nuclear electric power costs referred to above reflect private costs. A major issue in electric power production from coal and nuclear sources is the probable external costs. The relevant costs for decision making are the social costs—the sum of private costs and net externalities.
Ongoing studies at the University of California at Santa Barbara have attempted to place an economic value on the important health and environmental costs of conventional coal combustion and the health and mortality hazards of nuclear fission. We have not estimated the external costs of fluidized bed combustion (FBC) of coal. However, the advantages of FBC include low emissions and easier handling of residual products. Therefore the external costs are likely to be insignificant.
The estimated external costs for nuclear and conventional coal electric power generation are shown in Table 6.10. We find that, contrary to some popular views, the unpaid social costs (externalities) of coal combustion are much larger than for nuclear. The ratio is more than 20 to I unfavorable to coal. Even this unfavorable ratio may be an understatement. Because physical and biological scientists have not reached a consensus (even within broad boundaries) relative to the greenhouse effect, we have been unable to estimate the cost of this externality. Whatever the value of this potentially huge external cost, it is a problem for coal and not for nuclear. Consequently, the coal externalities are probably understated and a correct statement would raise the ratio unfavorable to coal above the 20 to 1 result shown here.
The estimated external costs have been combined with private cost estimates for these alternative power systems in Table 6.11. On a cents per kilowatthour basis, the external costs of coal power combustion amount to at least 0.07l¢/kWh. For nuclear, they are a negligible 0.0035¢/kWh. Based on OECD estimates of private costs, the results reduce the advantage for coal over nuclear power in the central region, increase the advantage of nuclear in the eastern region, and reduce the major advantage of coal in the Rocky Mountain area.
As one would expect from the foregoing data, nuclear power should have made substantial inroads into the market for oil in electric power generation until the 1080s when nuclear capital costs increased. In 1073 nuclear power had displaced only 2% of oil from its worldwide electric power market. By 1987 this displacement had increased to about 14%.[23] Given the long lag between the economic incentive for shifting from expensive oil to the coal and nuclear substitutes and the actual occurrence of such, this displacement trend must be expected to continue long after the price of oil has fallen from the $30-$39 level of the "energy crisis" years, to the $14-$20 range today.
Oil and Gas
Oil- and gas-fired baseload electric power generation has recently returned to economic viability (probably temporary) due to the sharp decline in the price of oil and natural gas. Because no oil-or gas-fired base-load electric power plants have been built in the United States since the mid-1970s, cost data are not easily available. Using EPRI data, we have constructed cost estimates for baseload residual oil-fired generation under the following assumptions: 500-MW capacity, 30 year life, 65% capacity operation, heat rate of 9680 Btu/kWh, capital cost including AFUDC of $813/kW of capacity, and a 7% real interest rate. With residual fuel oil priced at $18.61/barrel ($2.98/million Btu), the cost is 5.04¢/ kW in 1987 dollars, as shown in Figure 6.4, bar q.
Costs for intermediate-load natural-gas power generation are computed under similar assumptions except for the following: natural gas price of $2.31/thousand cubic feet ($2.23/million Btu), a 35% capacity factor due to its intermediate status, 390-MW capacity, capital cost of $433/kWh of capacity, and a heat rate of 9,650 Btu/kWh. The derived cost is 4.11¢/kWh. See Figure 6.4, bar r.
Between 1975 and late 1985, crude oil and natural gas were effectively frozen out of the baseload electric power generating market. Figures 6.12 and 6.13 show the relationship of fuel costs and total cost/kWh
[23] This figure is derived by computing the number of barrels of oil displaced by nuclear power production and dividing by world oil output (outside communist areas) plus oil displaced by nuclear.
for electric power generation for both natural gas and residual fuel oil. For oil at prices above about $20/barrel, residual fuel oil is effectively precluded from the baseload electric power generating market. Similarly for natural gas, at prices above about $4/thousand cubic feet, base-load generation from this fuel source is not economically viable.
The relevant fuel price for major baseload investment decisions is the expected future price. The present price is merely one piece of evidence useful in estimating the future price. The prevailing view is that the real price of these two nonrenewable resources will move upward early in the life of any new oil- or gas-fired baseload generating plant. Consequently, investments in these baseload plants is not given favorable consideration.
Nuclear Fusion
Nuclear fusion is occasionally offered as an inexhaustible potential source of low-cost electric power. The challenge to physicists and engineers is to produce a breakthrough in which the fusion process would produce more power than it consumes. Once this breakthrough occurs, then the economic problem appears: can electric power from fusion be produced at a cost less than its value? Given probable extremely high capital costs, fusion power does not appear to be a feasible substitute for oil in the foreseeable future.
V. CONCLUSIONS
This chapter has provided three kinds of information relative to the demand for electric power in California together with alternative energy sources to meet that demand. (1) We critically reviewed the CEC forecast of California's electric power supply and demand, leading to a shortage expected in the late 1990s. (2) The potential role of imports from the Pacific Northwest and the Southwest was evaluated. (3) We then surveyed alternative energy sources and electric power supplies available for California's future and provided cost estimates for each alternative. These estimates are summarized in Table 6.12.
Electric power consumption increased about 7%/year from 1950 through 1973 when nominal oil prices were stable and real prices were declining. Then during the energy crisis of the 1970s, energy and electric power prices increased sharply leading consumers to economize on energy use. Annual growth rates fell steadily to about 2% by the early 1980s. Recently, crude oil prices have fallen sharply to as low as $10/ barrel in 1986, and have varied from $10 to $20/barrel through 1988. If nominal oil prices stabilize below $20/barrel and real prices decline,
electric power consumption growth rates should move upward toward their historical trend.
However, we found that the CEC forecast of electricity growth rates through the year 2005 projects a continuously declining trend even below the growth experienced during the last years of the energy crisis. The CEC forecast does not rest primarily on economic theory, which would base the future growth rate on such important economic determinants of demand as price, income, population, and industrial growth. Instead, the CEC forecast mainly has a technical base that makes use of in-depth studies of end uses for electricity. This approach utilizes such information as the market penetration rates for air conditioning and insulation and the electric power used in such applications.
The state's electric utilities overestimated demand growth during the 1970s and the CEC forecasts were more accurate. Due partly to the conflict between the utilities and the CEC in growth rate forecasting during the 1970s, both parties appear to be fearful of repeating past overestimation errors. This fear appears now to lead to errors in the opposite direction. But if electric power prices remain relatively stable and decline in real terms and if an uncommonly serious recession is avoided within the forecast period, then electricity demand is likely to grow faster than the CEC has forecast.
On the supply side, the CEC economic analysis again is weak but in the opposite direction. The CEC forecast gives inadequate weight to price and cost. Instead, the commission designates electric power sources that it favors (including wind, solar, and biomass) and sources that are in its disfavor (including nuclear, coal, oil, and gas). It has reserved sources of "preferred additions" to electric power supply, and through its siting power it makes clear that it "can clearly control approval of projects . . . that seek to fill reserved need amounts" (California Energy Commission, 1985a, p. 77). The CEC boasts proudly and frequently of its energy supply diversity, pointing out that "today, California obtains electricity from more different energy sources— hydroelectric, coal, nuclear, geothermal, wind, solar, and biomass—than any other place in the world" (California Energy Commission, 1986c, p. 13). But diversity is not a free good. Wind, solar, and biomass are very expensive energy sources. The commission takes credit for the advantage of diversity, but California consumers pay the considerable bill. The CEC will enforce diversification of power supply sources but gives little consideration to costs that society must bear in exchange for the diversification advantage. It appears to underestimate the cost of wind energy conversion. As a consequence, unsubsidized new wind power investments are not likely to be made, contrary to the CEC supply expectations. Its analysis of wind costs for nonutility-owned systems incorrectly treats government tax subsidies to wind as social gains when, in fact,
they are merely transfer payments. In any event, the tax subsidies provided by both the state and federal government for wind energy conversion have now been totally removed, leaving only the avoided cost subsidy, and this in reduced value. As a consequence of its understatement of costs, and the termination of subsidies, some of the power supplies from the CEC preferred reserve additions are not likely to appear by 1996.
If demand growth is understated and if forecast additions to supply fail to appear, then for two reasons the shortage that the CEC anticipates by the late 1990s is likely to be understated by a large margin. If the shortage occurs earlier, severe costs will be imposed on the state's utilities and their customers. There is a long lag between the time at which a decision is made to construct efficient new generating facilities and the time such facilities go on-line. This lag is due to the complex process of gaining government approval of the type of facility to be constructed, its site, preparation of the required environmental impact statements and their approval, actual construction, and delays due to legal challenges. For PG&E's Diablo Canyon nuclear power plants, the total lag was over 15.5 years.
If a forecasting error is discovered when only a year or two of adequate supplies remain, then a quick fix will be necessary. But quick-fix solutions are likely to be expensive, a penalty that ratepayers will be required to bear.
Electric power imports from the Pacific Northwest and the Southwest are an attractive source of power for California. They are less costly than the full cost of constructing new generating systems in California. Furthermore, peak demand occurs in the summer for California and in the winter for the Pacific Northwest. An exchange of surpluses is mutually beneficial. The CEC includes such imports and exchanges in their forecast.
If certain problems can be overcome, imports can be increased with benefits for both importing and exporting consumers and utilities. First, imports are limited by tie-line capacity. If it can be shown that the social benefits of increased tie-line capacity exceed their social costs, then capacity should be expanded. Some capacity expansion investment is currently under way.
Second, access to the tie line is controlled by the BPA. Although the BPA is a creation of the federal government, administrators have historically managed it in the interest of its Pacific Northwest constituency. From a political view, this behavior is understandable; the organization depends heavily on Pacific Northwest congressmen for its budget and for legislation it considers favorable. This means that serving power needs in California is given a low level of priority. BPA is reluctant to enter into contracts to sell firm power. Instead, it offers primarily nonfirm
power, which may be cut off when it is most needed by California customers.
Third, a very large potential source of imports is the already available surpluses in Canada, plus development of excellent hydroelectric resources, primarily in British Columbia. Currently, BPA allocates last position in the tie-line queue for Canadian power moving to California. This means that space is not normally available and that building new generating systems to supply the California market is not a feasible investment until the intertie access issue is resolved and additional transmission capacity is constructed. In view of the likelihood that Canadian power would be less costly than new facilities in California, that such power exports would be firm, and that the potential supply would be large and for a long period of time, some solution to the access problem would be desirable. The best solution would be to construct new transmission lines from British Columbia to California that would give first priority to Canadian power. This would probably require that the full cost of the new transmission lines be advanced jointly by B.C. Hydro and a group of California utilities. Whether or not the investment is feasible should be determined by a benefit/cost analysis.
There is some merit in undertaking a study to determine whether units 1 or 3 of the WPPSS might be purchased and then completed by a consortium of California utilities. If one of these plants is unlikely to be completed under BPA ownership to serve Pacific Northwest power demand, then sunk costs become irrelevant. The cost of completion plus the cost of transmission becomes the relevant incremental cost for power from this source. The potential gains can be quite large. Such savings could be distributed among the participants in such a way that all parties would gain.
This chapter also reviewed alternative energy systems available for California, together with some alternative oil and natural gas supply sources. The latter were included because large new sources would affect the price of oil and gas and consequently affect the price of electricity.
Our cost analysis is summarized in Table 6.12. Oil and gas are currently among the least-cost baseload electric power sources for California. However, both sources are extremely sensitive to oil and natural gas prices and become uneconomic at about $20/barrel for oil and about $4/ thousand cubic feet for natural gas. Few observers believe that real oil and gas prices will remain at their present relatively low level beyond the turn of the century. Consequently any oil- or gas-fired plants authorized now and on-line in the mid-1990s would become economically nonviable early in their life.
Nuclear power suffers from a fear held in some public sectors that storage of spent fuel and/or an accident at a nuclear power plant will
cause unacceptable health risks. These are externality problems. We have evaluated the external costs of nuclear fission and conventional coal combustion. We found that the sum of fatalities, illness, and property damage from nuclear power plants is about 0.0035¢/kWh, an insignificant number. When added to current estimates of private costs amounting to 4.66¢/kWh for the Rocky Mountain region, the cost estimate is virtually unchanged.
External costs imposed by coal-fired generation were estimated to be 0.071¢/kWh, about 20 times that of nuclear. When added to estimates of coal private costs, the total becomes 3.66¢/kWh for the Rocky Mountain region. Coal has a social cost advantage over nuclear power in this region. The opposite is true in the eastern region. These numbers indicate that coal poses a much greater external cost than nuclear power and that nuclear may be a more suitable future baseload power source than coal, depending on location. The uncertainty in this conclusion arises out of the private cost estimates, plus the fact that California law currently prohibits new nuclear power development until spent fuel storage safety is certified. Over the next two or three decades, nuclear power is almost certain to account for an increasing share of electric power generation outside the United States, but not necessarily in California.
New research and development in coal use for power production have led to promising breakthroughs that may allow the United States and the world to use very large coal reserves in environmentally acceptable ways. A semicommercial coal gasification-combined cycle (GCC) plant is currently using coal to produce electric power in California. The Cool Water plant is using 1,000 tons of coal per day with air emissions averaging 10-20% of the allowable federal levels for nitrogen oxide, sulfur dioxide, and particulates emissions. A commercial plant five times as large as Cool Water would allow coal use in electric power production in California costing an estimated 4.85¢/kWh. Rather than move the coal to California, further economies might be realized by generating electric power via GCC near the coal reserves and then transmitting the electric power to consumer centers, including California.
Nuclear electric power generation is an economically attractive source and will continue to expand its share of the generation market worldwide, outside the United States. Currently, there are over 400 nuclear electric power plants in the world outside of communist areas. One hundred seven of them are operating in the United States and produced 20% of the nation's electricity in early 1988. In the United States, there has never been a life lost as a result of an accident in a nuclear power plant. Worldwide, the significant accident resulting in a loss of life was in Russia where an accident occurred at the Chernobyl nuclear plant, which has a graphite core reactor. There are no graphite reactors in electric
power generation in the United States. Furthermore, safety standards in Russia are entirely different from standards in the United States and elsewhere in the western world. The problem that U.S. nuclear power faces is partly a matter of public information and partly a matter of our political institutions, which allow repeated legal intervention and resulting litigation and costly delays. The record shows that nuclear plant construction time in the United States has increased from about 5 years in the decade of the 1960s to 13-15 years in the 1982-1986 period. Consequently, capital costs have increased such that the levelized capital cost of a nuclear plant in the United States is about three times the cost in France or Belgium. The new result is that, until regulatory and litigation procedures are changed, the nuclear option is not economically viable in California or the nation. This fact of life forces the nation to use its coal resources for future baseload electric power development.
Baseload geothermal offers some attractive opportunities. Where suitable geothermal resources exist, binary-cycle geothermal appears to be competitive for development in California.
Wind energy conversion systems have been extensively developed in California, primarily due to very generous tax subsidies from the federal and state governments and from ratepayers in the form of avoided-cost payments. Without these subsidies, the cost of wind conversion is estimated at about 8.4¢/kWh. There are also serious questions of wind's reliability, questions that reduce the benefits of electricity generated from this source. For new sources, wind does not seem to be an affordable power source for large-scale development in California. Existing wind systems will be economic sources as long as their revenue exceeds their marginal costs.
Solar thermal power generation, like wind conversion, exists only with massive subsidies. Whereas all government subsidies have been removed for wind, a 15% subsidy has been included in the 1986 federal tax revision legislation. This subsidy is not sufficient to induce new investments in solar thermal power generation. The social cost of solar thermal electric power is estimated to be 13.45¢/kWh, and this source should not be included in expected new power supplies for California.
Storage of low-cost power, particularly off-peak nuclear and other baseload power, is feasible by CAES or pumped-hydro systems. All of the storage systems reviewed here were found to be economically viable. The most appropriate system will depend on site-specific cost.
Biomass as an electric power source using municipal wastes is uneconomic on its own. It would be viable only if the alternative cost of municipal waste storage amounted to more than about 5¢/kWh. Nuclear fusion still awaits a technical breakthrough. At present, fusion still uses more energy than it is capable of producing. If and when a breakthrough occurs, then its viability depends on the value of its power
production being greater than its costs including capital, operating and maintenance, and energy inputs.
Alternative fuel sources beyond the conventional oil, gas, coal, and nuclear do not appear to be promising, with the single exception of synthetic oil production from the Canadian tar sands. Production from those resources has been under way since the late 1960s. Coal liquefaction, coal gasification, coal to gasoline, natural gas to gasoline, and sugar cane to alcohol were all found to be technically feasible but economically unsupportable. Synthetic oil production from the extremely large U.S. oil shale resources has been demonstrated on a pilot-plant basis. However, the cost of the oil produced is approximately three times its value. Similarly, the Venezuelan Orinoco tar belt oils cannot be produced economically under current technology and prices.
Thus new electric power sources that will be needed in California in the late 1990s must come from imports originating in the Pacific Northwest, the Southwest, and Canada or from nonconventional use of coal, geothermal, and in the more distant future, from conventional nuclear fission. The U.S. supplies of imports are now abundant. However, when they are badly needed in the late 1990s and the next century, they will probably not be available for export from those source regions. Canadian potential for hydroelectric development is enormous and is available on a long-term basis. Its use in California will require hydro development in Canada and some solution to the transmission problem currently under control of the BPA.
REFERENCES
Atomic Industrial Forum, Inc. (1986). Nuclear Info , October/November, No. 134.
Bonneville Power Administration (1983). Issue Backgrounder, "Surplus Power—Selling Power," November.
Bonneville Power Administration (1984). "BPA Review of WPPSS Projects I and 3 (WNP 1 and 3) Construction Schedule and Financing Assumptions."
Bonneville Power Administration (1985). Private Correspondence from R. N. Stein, Chief, Resource Modeling Section. November.
British Columbia Hydro (1985). Private correspondence from William A. Best, Senior Vice President, System Development and Research, British Columbia Hydro and Power Authority. November.
California Energy Commission (1980). Analysis of Expansion of the Pacific Northwest-Pacific Southwest Intertie System, Contractor Report, Section VII. Sacramento.
California Energy Commission (1984). Integrated Supply and Demand Report . Sacramento.
California Energy Commission (1985a). The 1985 California Electricity Report: Affordable Electricity in an Uncertain World , Vol. I. Sacramento.
California Energy Commission (1985b). The 1985 California Energy Plan: The 1985 Biennial Report . Sacramento.
California Energy Commission (1985c). The 1985 California Electricity Report: Affordable Electricity in an Uncertain World , Appendices, Vol. II. Sacramento.
California Energy Commission (1985d). Draft 1985 California Electricity Report: Back to Basics: Affordable Electricity in an Uncertain World . Sacramento.
California Energy Commission (1985e). "The Relative Cost of Electricity Production." Staff Report AD-37 RCE. August. Sacramento.
California Energy Commission (1986a). California Energy Demand 1985-2005 , Vol. 1. Sacramento.
California Energy Commission (1986b). The 1987 California Electricity Report , Draft Final. December. Sacramento.
California Energy Commission (1986c). Energy Development . June. Sacramento.
California Energy Commission (1986d). A Guidebook on Standard Offers for Electric Power Purchases . January. Sacramento.
California Energy Commission (1986e). Solar and Wind Technology Tax Incentive Impact Analysis . P500-86-010. May. Sacramento.
California Energy Commission (1987). California's Energy Outlook: The 1987 Biennial Report . Sacramento.
California Energy Commission (1988). Energy Watch, November/December. Sacramento.
Cambridge Energy Research, Ltd. (1987). Nuclear Economics and the Price of Coal . Cambridge, England.
Clifford, Thomas E. (1984). "The External Costs of Electric Power From Coal-Fired and Nuclear Power Plants. Ph.D. dissertation. Santa Barbara: University of California.
Douglas, John (1985). "Opening the Tap on Hydrothermal Energy." EPRI Journal, April/May, p. 17ff.
Electric Power Research Institute (1986). Technical Assessment Guide , Vol. 1. EPRI P-4463-SR.
Federal Energy Regulatory Commission (1989). Docket No. Ec 89-5-000, p. 31.
Forbes (1986). Forbes Magazine , November 3, Vol. 138, p. 72.
Henry, E, and J. E. Graeser (1983). "Energy Storage: Developments in Pumped Storage." Water Power and Dam Construction , Vol. 37, No. 6, p. 37ff.
Leibson, Irving (1987). "Comparative Economics for Alternative Fuels and Power Technologies." Energy Progress , Vol. 7, No. 2, June.
Lynette, Robert (1985). "Wind Turbine Performance—An Industry Overview. Windpower '85 , American Wind Energy Association Annual Meeting, San Francisco, August.
Mead, Walter J., and Mike Denning (1987). "The Social Costs of Electric Power Generation from Nuclear and Coal." In Proceedings of the 8th Annual International Conference, Vol. I, pp. 585-602, International Association of Energy Economists, Tokyo, Japan.
Melo, Fernando H., and Eli R. Perlin (1984). As Solucoes Energeticas e a Economia Brasileira . Sao Paulo: Hucitec.
Norris, H. F., Jr. (1986). "Utilizing Spreadsheets for Analyzing Solar Thermal Central Receiver Power Plant Designs." Sandia National Laboratories report SAN D86-8011.
Northwest Power Planning Council (1985). Northwest Conservation and Electric Power Plan , 1985. Vol. 1.
Nucleonics Week (1986). "Briefly." Nucleonics Week , January 30, Vol. 27, pp. 14-15.
Oil and Gas Journal (1985). "New Zealand Gas to Gasoline Plant Near Start-up." Oil and Gas Journal, August 26, Vol. 83, No. 34, pp. 38-39.
Oil and Gas Journal (1988). "U.S. Clean Coal Technology." Oil and Gas Journal , May 2, Vol. 86, No. 18, pp. 16-18.
Organization for Economic Cooperation and Development, Nuclear Energy Agency (1983). "The Costs of Generating Electricity in Nuclear and Coal-Fired Power Stations." Report by an expert group, 1983.
Organization for Economic Cooperation and Development, Nuclear Energy Agency (1986). "Projected Costs of Generating Electricity from Nuclear and Coal-Fired Power Stations for Commissioning in 1995." Report by an expert group, Paris.
Pepper Janis C. (1985). "Wind Farm Economics from a Utility Perspective." Windpower '85 , American Wind Energy Association Annual Meeting, San Francisco, August.
Santiago, Richard L. (1985). "Marketing of a New Liquid Fuel: The Brazilian Alcohol Programme." Paper presented at the Workshop of the Economics of Interfuel Substitution of LDCs, Imperial College, University of London, April 19.
Smith, D. R., W.J. Steeley, and T. Hillesland (1984). Paper presented at the American Wind Energy Association Annual Meeting, September. Mimeograph.
Smith, D. R., W.J. Steeley, M. Ilyin, and T. Hillesland (1985). "Pacific Gas and Electric Company's Wind Energy Program Results." Windpower '85, American Wind Energy Association Annual Meeting, San Francisco, August, pp. 280-286.
Solar Energy Research Institute (1985). "Wind Energy Technical Information Guide." Report SERI/SP-271-2684. March.
Southern California Edison (1987). Telephone conversation and submittal to California Energy Commission dated October 16, Docket No. 78-AFC2A by letter from M. C. Gardner, Mgr., Policy and Planning.
U.S. Department of Energy, Energy Information Administration (1985). Historical Plant Cost and Annual Production Expenses for Selected Electric Plants, 1985 , DOE/EIA-0455(85).
U.S. Department of Energy, Energy Information Administration (1988). Monthly Energy Review , January.
U.S. General Accounting Office (1986). "Synthetic Fuels, Status of the Great Plains Coal Gasification Project." GAO/RCED-86-190FS. July.
U.S. National Academy of Sciences (1979). Energy in Transition: 1985-2010 . Report of the Committee on Nuclear and Alternative Energy Systems. San Francisco: W. H. Freeman.
U.S. Synthetic Fuels Corporation (1985). Telephone conversation with Mr. John Scango, September 3.
World Energy Conference (1983). Survey of Energy Resources . London.
TABLE 6.1 | |
Period | Compound Annual Energy Growth Rate |
1990-1997 | 1.98% |
1997-2005 | 1.21% |
a SOURCE: California Energy Commission (1986b), p. 2. | |
TABLE 6.2 | |
Year | 1983 ¢/kWh |
1977 | 5.78 |
1988 | 7.80 |
1997 | 6.51 |
2005 | 6.82 |
a SOURCE: California Energy Commission (1986a), pp. B-1-B-7. The CEC report shows prices by company. The authors have computed a weighted average using consumption by company for weights. | |
TABLE 6.3 | |
Period Ending | Annual Growth Rate |
May 1987 | + 1.0 |
June | + 1.3 |
July | + 1.5 |
Aug | + 1.9 |
Sept | + 2.9 |
Oct | + 3.6 |
Nov | + 4.5 |
Dec | + 4.9 |
Jan 1988 | +5.2 |
Feb | +5.7 |
Mar | + 5.6 |
Apr | + 5.5 |
May | + 4.9 |
June | +4.7 |
July | + 5.0 |
Aug | + 5.8 |
Sept | + 5.6 |
Oct | +4.8 |
a SOURCE: California Energy Commission (1988), p. l | |
TABLE 6.4 | |
Source | Capacity (MW) |
Additional Conservationb | 1,380 |
Cogeneration Based on Gas Use | 900 |
New Geothermal | 850 |
Wind and Solar | 300 |
Imported Power | 650 |
Small Hydroelectric | 250 |
Biomass | 350 |
Unspecified | 1,669 |
a SOURCE: California Energy Commission (1985a), p. 16. | |
TABLE 6.5 | |||||||||
Firm Capacity (MW) | Firm Energy (GWh) | Nonfirm Energy (GWh) | |||||||
Year | NW | SW | Total | NW | SW | Total | NW | SW | Total |
Actual Data (1980-1984) |
1980 | 3,186 | 4,174 | 7,360 | 3,508 | 17,584 | 21,092 | 8,567 | 5,940 | 14,507 |
1981 | 3,210 | 4,143 | 7,353 | 6,258 | 18,262 | 24,520 | 20,365 | 7,311 | 27,676 |
1982 | 2,598 | 4,450 | 7,048 | 7,248 | 19,643 | 26,891 | 28,662 | 9,239 | 36,901 |
1983 | 2,424 | 4,562 | 6,986 | 1,522 | 27,966 | 29,488 | 24,842 | 7,084 | 33,822 |
1984 | 2,606 | 4,639 | 7,245 | 4,116 | 30,740 | 34,856 | 28,666 | 8,616 | 39,002 |
Projections (1989-2004) |
1989 | 2,667 | 6,296 | 8,963 | -511 | 37,491 | 36,980 | 21,779 | 9,492 | 31,271 |
1996 | 2,667 | 6,833 | 9,500 | -548 | 40,520 | 39,972 | 17,572 | 13,396 | 30,968 |
2004 | 2,667 | 6,764 | 9,431 | -485 | 40,081 | 39,596 | 16,084 | 13,968 | 30,070 |
a SOURCE: California Energy Commission (1984), pp. 4-37, 4-38. | |||||||||
TABLE 6.6 | ||
Fiscal | BPA | Non-BPA |
Year | Firm | Nonfirm | Total | Total |
1976 | 1,241 | 973 | 2,214 | 1,020 |
1977 | 668 | 0 | 668 | 753 |
1978 | 1,031 | 223 | 1,254 | 1,200 |
1979 | 614 | 13 | 627 | 876 |
1980 | 560 | 278 | 838 | 848 |
1981 | 1,017 | 428 | 1,445 | 1,565 |
1982 | 1,348 | 977 | 2,325 | 1,067 |
1983 | 1,371 | 1,396 | 2,767 | 919 |
1984 | 1,192 | 1,375 | 2,567 | 1,012 |
1985 | 906 | 998 | 1,904 | 2,062 |
a SOURCE: Bonneville Power Administration (1985). | ||||
TABLE 6.7 | |
Fiscal Year | Firm Energy |
1985/86 | 11,085 |
1986/87 | 10,130 |
1987/88 | 9,895 |
1988/89 | 8,780 |
1989/90 | 7,105 |
1990/91 | 6,330 |
1991/92 | 5,115 |
1992/93 | 4,310 |
1993/94 | 3,695 |
1994/95 | 2,990 |
1995/96 | 1,680 |
1996/97 | 760 |
1997/98 | (75) |
1998/99 | (590) |
1999/00 | 760 |
2000/01 | 455 |
2001/02 | (500) |
2002/03 | 630 |
2003/04 | 6,630 |
a SOURCE: British Columbia Hydro (1985). | |
TABLE 6.8 | |
Year | Percent of Capacity |
1985 | 13% |
1986 | 13% |
1987 | 16% |
a SOURCE: California Energy Commission, telephone conversation. | |
TABLE 6.9 | ||
Required Price (1987 ¢/kWh) at: | ||
Increment of Capacity | 33% Capacity | 25% Capacity |
100 MW | 6.4 | 8.4 |
600 MW | 8.5 | 11.2 |
1400 MW | 15.9 | 21.0 |
2100 MW | 21.1 | 27.9 |
a SOURCE: Developed from Pepper (1985). | ||
TABLE 6.10 | ||
Type/Cause | Nuclear | Coal |
Fatalitiesb | ||
Normal Operationsc | 18,700-29,200 | 467,200-1,869,000 |
Reactor Accident | 300-163,500d | — |
Air Pollution | — | 1,985,800 |
Illnesses/Injuries | ||
Normal Operations | 7,100-16,100e | 9,900-39,600f |
Reactor Accident | 100-44,600g | — |
Air Pollution | — | 322,900 |
Environmental Effects | — | 559,600h |
Property Damage Due to Reactor Accidents | 500-121,500 | — |
Totalsi | ||
Ranges | 26,700-374,900 | 3,345,400-4,776,900 |
Midpoints | 200,800 | 4,061,000 |
a SOURCE: Mead and Denning (1987). | ||
Fatalities | $1,175,000/case |
Air pollution Illnesses: | |
Acute | $120/day |
Chronic | $1,250/case |
Radiation Illnesses: | |
Nonfatal Cancer | $10,100/case |
Genetic Defect | $584,600/case |
For an explanation of the derivation of these values, see Chapter 7 in Clifford (1984). The value of human life was originally estimated to be one million dollars for the year 1982. This estimate has been inflated to 1987 conditions GNP deflator. c The health effects of normal operations of nuclear power include the discounted value of health effects occurring over long periods into the future. These effects have been discounted at the rate of 5%/year for the values reported in the table. d The expected damages in three categories of reactor accidents were assumed to be compensated for by utility insurance policies. The categories were early fatalities, early illnesses, and property damage. The amount of damage insured was assumed to equal 40% of the overall expected value of damage in these categories. This assumption led to a reduction in the total value of. reactor accident damages of approximately 18% (at the upper bound values), almost all due to me reduced property damage estimate. e The estimated number of annual illnesses per 1000 MW due to normal operations of the nuclear fuel cycle include the following: 0.016-0.025 nonfatal cancers and 0.012-0.027 genetic defects. |
f The illnesses/injuries externality for the coal fuel cycle is based on the injuries suffered by the public in accidents during the transportation of coal fuel. Each injury is assumed to cause a temporary disability, with an average of 100 work days lost associated. Based on data presented in U.S. National Academy of Sciences (1979), p. 448. g The annual illnesses per 1000 MW associated with accidental release break down as follows: 0.0029-1.412 nonfatal cancers, 0.0001-0.052 genetic defects. h The Environmental externalities of the coal fuel cycle are broken down as follows: | |
Materials | $81,800 |
i The damages shown here differ from prior reports by Clifford and Mead due to additional research results. By the same token, the present findings will probably be modified by subsequent research. | |
TABLE 6.11 | ||
External Costs: | ||
Coal: | $4,061,100 | = 0.071¢lWj |
1,000,000 kWh × 24 hours × 365 days × 65% capacity | ||
Nuclear: | $200,800 | = 0.0035¢/KwH |
1,000,000 kWh × 24 hours × 365 days × 65% capacity | ||
Social Costs (Private Costs + External Costs) (1987 ~/kWh) |
Central U.S Coal/Nuclear. | Eastern U.S. Coal/Nuclear | Rocky Mountains Coal/Nuclear | |
Private | 3.95/4.78 | 5.13/4.76 | 3.59/4.66 |
External | 0.071/0.0035 | 0.071/0.0035 | 0.071/0.0035 |
Total | 4.02/4.78 | 5.20/4.76 | 3.66/4.66 |
TABLE 6.12 | |
Alternative Electric Power Technologies | ¢/kWh |
Baseload Nuclear, Light Water Reactor, OECD Data | |
Plus Net | |
External Cost | |
Central Region | 4.78 |
Eastern Region | 4.76 |
Rocky Mountain Region Rocky Mountain Region | 4.66 |
Baseload Conventional Coal, OECD Data Plus Net | |
External Costs | |
Eastern Region | 5.20 |
Central Region | 4.02 |
Rocky Mountain Region | 3.66 |
Baseload Residual Fuel Oil, EPRI Data | 5.04 |
Intermediate Load Natural Gas, Combined Cycle, EPRI Data | 4.11 |
Baseload Coal Gasified Combined Cycle, Texaco Process, EPRI Data | 4.85 |
Baseload Atmospheric FBC, EPRI Data | 4.41 |
Baseload Pressurized FBC, EPRI Data | 5.05 |
Baseload Geothermal-Binary, EPRI Data | 8.33 |
Intermittent Load Wind Energy Conversion, PG&E Data | 8.40 |
Intermittent Load Solar Thermal, EPRI Data | 13.45 |
Intermittent Load, Solar Photovoltaic Central Station, EPRI Data | 7.72 |
Energy Storage Systems, EPRI Data | |
Intermediate Load, Pumped Hydro | 3.14 |
Compressed Air Energy Storage | |
Aquifer or Salt Cavern Storage | 1.19 |
Rock Storage | 2.26 |
Biomass-Municipal Refuse Incineration, EPRI Data | 9.42 |
Nuclear Fusion | Not now |
economic | |
Alternative Fuel Technologies | $/unit shown |
Coal Liquefaction, Breckenridge, U.S. Synfuels Corp. Data | $96/barrel |
Coal Gasification, Great Plains, U.S. Synfuels Corp. Data | $8.59/10 cu. ft. |
Coal to Gasoline, West German data | $2.20/gallon |
Natural Gas to Gasoline, New Zealand data | $1.30/gallon |
U.S. Oil Shale into Synthetic Oil (oil company data) | $45-60/barrel |
Canadian Tar Sands into Synthetic Oil (Bechtel data) | $25.70/barrel |
Venezuelan Orinoco Tar Belt | Not now economic |
Sugar Cane into Alcohol (Melo and Perlin Data) | $2.52/gallon |
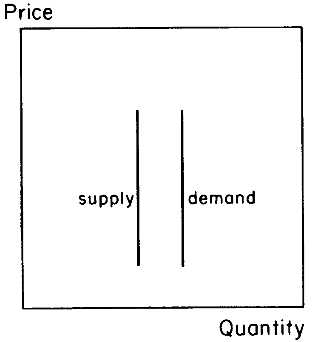
6.1. "Price-independent" supply/demand curves.
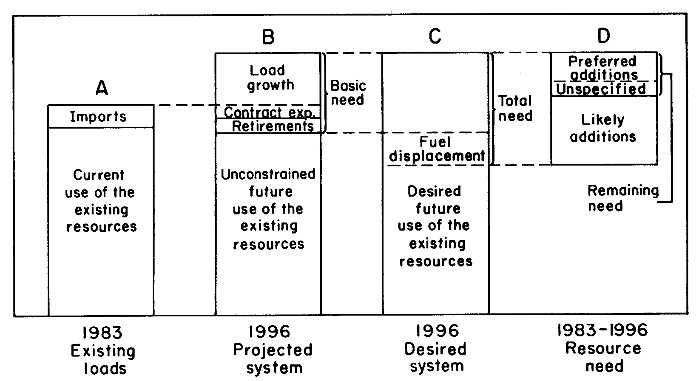
6.2. Conceptual flow of the California Energy Commission's integrated assessments forecasting methodology. Source: California Energy Commission (1985a), p. 45.
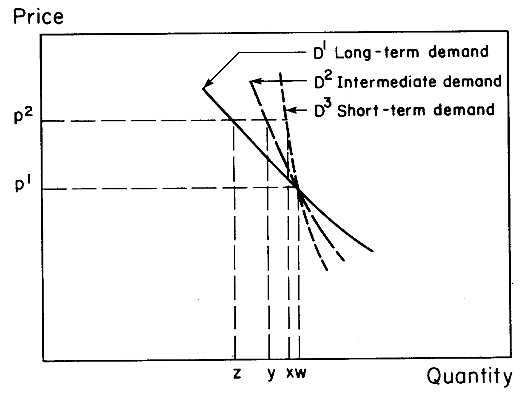
6.3. When the price of a commodity increases, demand declines. The demand reduction expands with the passage of time as buyers continue to adjust to the higher price.
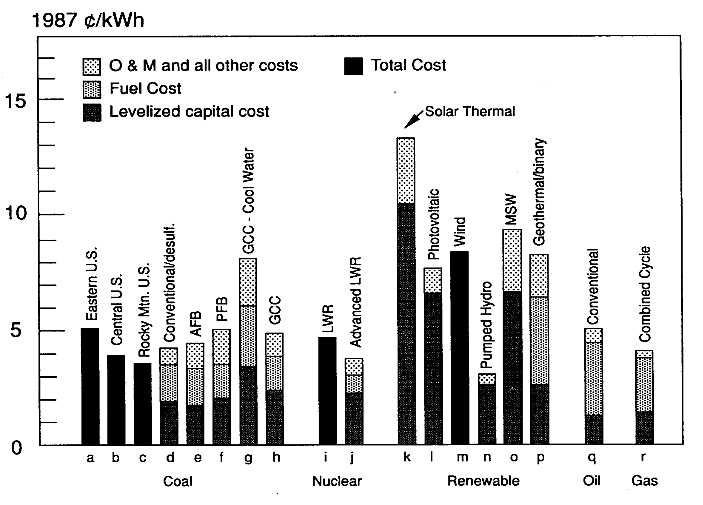
6.4. Costs and cost estimates for alternative electricity generation technologies. Based on data from Electric Power Research Institute (1986), pp. B-45 to B-105, a 30-year plant life, a 7% real interest rate, and a coal cost of $1.5l/million Btu, unless otherwise noted. (a-c) actual data on conventional coal plants in the Eastern, Central, and Rocky Mountain regions of the U.S., respectively. Source: Organization for Economic Cooperation and Development, Nuclear Energy Agency (1986), p. 11; (d) estimate for two 500-MW (net) conventional coal-steam plants with wet limestone flue gas desulfurization and a subcritical 2400 psi Steam system (40-year plant life, 65% capacity factor); (e) estimate for a 500-MW (net) AFBC plant (heat rate 10,000 Btu/kWh, 40-year plant life; (f) estimate for a 500-MW (net) PFBC plant (heat rate 8980 Btu/kWh); (g) actual data for the 103-MW (net) Cool Water GCC plant (65% capacity factor, fuel cost includes oxygen at 1.00¢/kWh and coal at $1.56/million Btu; the coal cost is likely to increase when the existing contracts expire). Source: Southern California Edison (1987); (h) estimate for a 500-MW (net) GCC plant (fuel cost includes oxygen); (i) actual data on conventional light-water nuclear plants in the Eastern, Central, and Rocky Mountain regions of the U.S. Source: Organization for Economic Cooperation and Development, Nuclear Energy Agency (1986), p. 11; (i) estimate for a 1100-MW (net) nuclear light water reactor plant to be available in 1995 (65% capacity factor); (k) estimate for a 150-MW solar thermal central receiver plant with dry cooling; (j) estimate for a 100-MW Solar Photovoltaic Central Station Plant; (m) estimate for addition of next 100 MW of wind power capacity (beyond 1985 levels), at 25% capacity factor. Source: Developed from Pepper (1985); (n) estimate for a pumped hydro storage system consisting of three 500-MW (net) plants; (o) estimate for a 45-MW (net) municipal refuse steam electric power plant (20-year plant life, 65% capacity factor); (p) estimate for a 50-MW (net) geothermal binary-cycle baseload plant (65% capacity factor); (q) estimate for a 500-MW (net) baseload residual oil-fired plant (heat rate 9,680 Btu/kWh, fuel cost $2.98/ million Btu); (r) estimate for a 390-MW (net) intermediate load, combined-cycle natural-gas-fired plant (heat rate 9,650 Btu/kWh, fuel cost $2.23/million Btu).
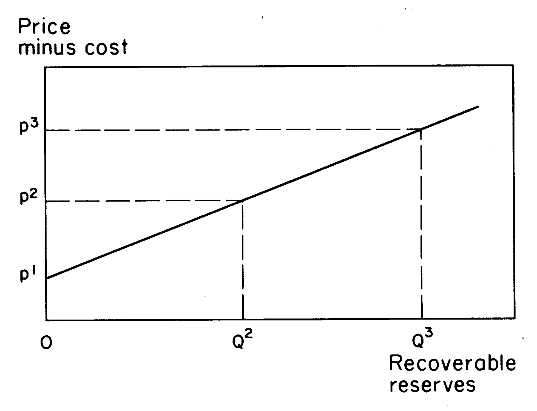
6.5. Recoverable reserves are a function of production costs and product prices.
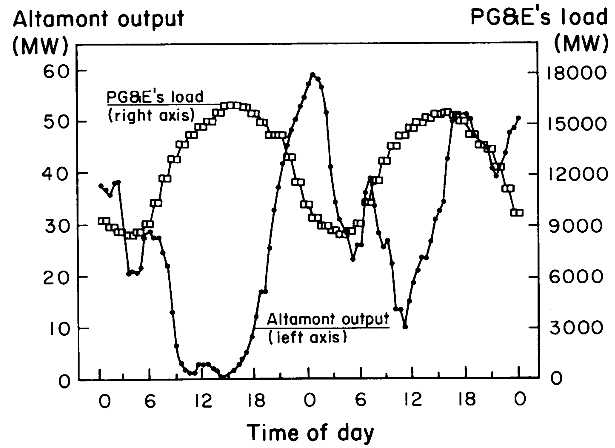
6.6. Comparison of the \ Pass wind farms output with PG&E system demand on peak demand days, July 17-18, 1984. Source: Smith, Steeley, and Hillesland (1984), p. 9.
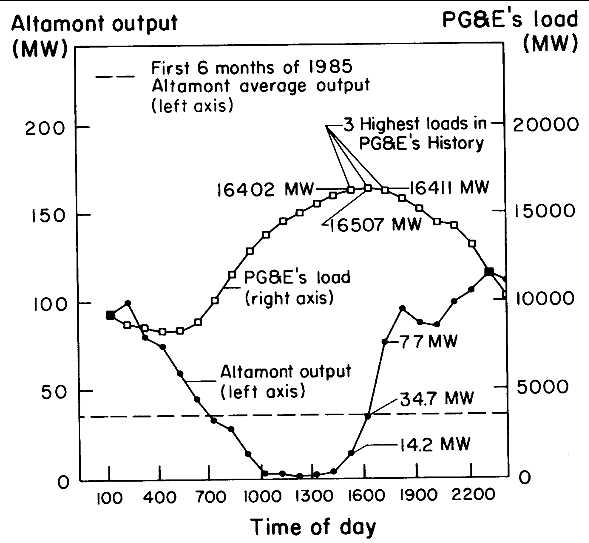
6.7. Comparison of the Altamont Pass wind farms output with PG&E system demand, July 9, 1985. Source: Smith, Steeley, Ilyin, and Hillesland (1985).
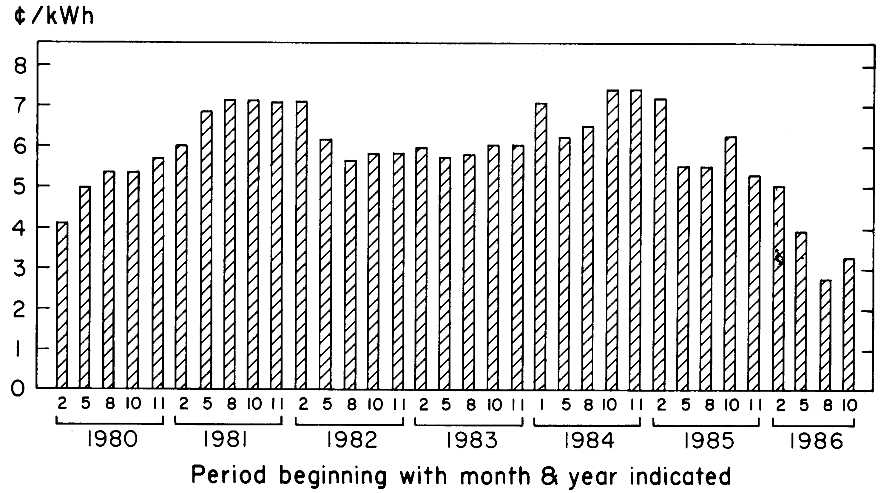
6.8. PG&E average avoided-cost rates for as-delivered energy, 1980-1986.
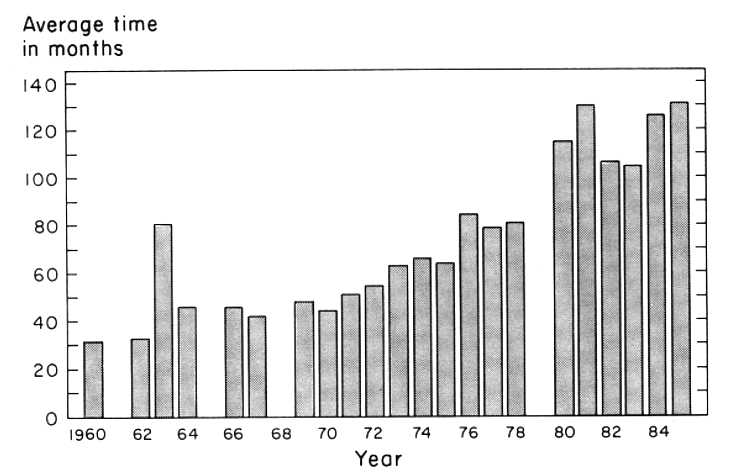
6.9. Length of construction period for U.S. nuclear power plants (interval from construction permit to full operation). Blanks indicate that no operating licenses were issued in the years shown. Source: Nuclear Regulatory Commission.
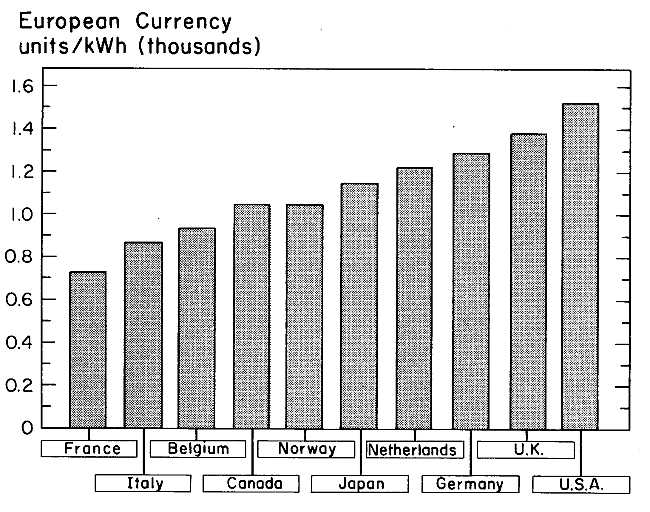
6.10. Capital cost of nuclear power plants, international comparison. Source: Organization for Economic Cooperation and Development, Nuclear Energy Agency (1983), p. 37.
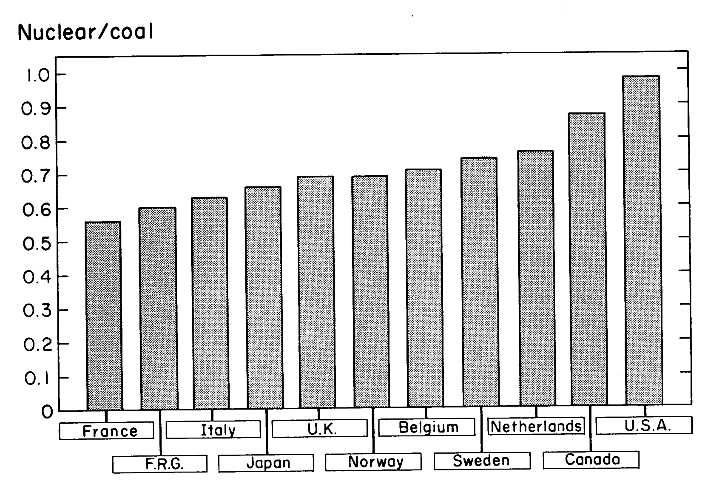
6.11. Ratio of nuclear-generated to coal-generated levelized electric power costs, international comparison. Source: Organization for Economic Cooperation and Development, Nuclear Energy Agency (1985), p. 37.
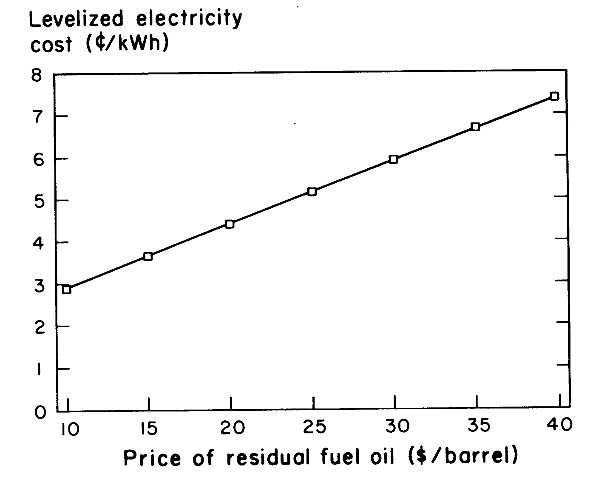
6.12. Cost of residual oil-fired electric power as a function of fuel price.
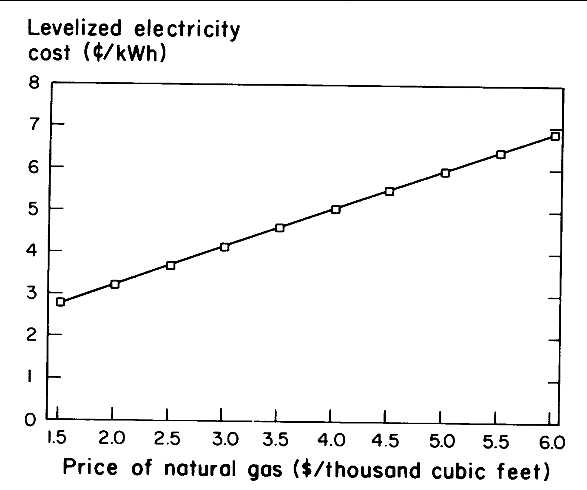
6.13. Cost of natural-gas-fired electric power as a function of fuel price.