3
THE GREENHOUSE EFFECT
We come now to a subject with even larger implications. In many countries today, governments are beginning to take actions that may well have far-reaching economic and social consequences for all of us, actions based on a chain of scientific reasoning and scientific evidence that may seem slender, uncertain, and to some people even arcane. This subject is the greenhouse effect.
The greenhouse effect seems to me to be the paradigm problem that defines what we mean by global-change research. It's a much more difficult problem than the ozone hole, and, like the ozone hole, it's been widely publicized. By now many people have at least a basic notion of what the greenhouse effect is all about. There are gases in the atmosphere—including water vapor, carbon dioxide, methane, nitrous oxide, ozone, and chlorofluorocarbons—that act a little like the glass of a greenhouse. They're partially transparent to sunlight. As sunlight comes through, some ultraviolet radiation gets absorbed by the ozone, and some sunlight gets absorbed by other constituents of the atmosphere, but the sunlight reaches the Earth's surface largely unimpeded by these gases in the atmosphere. This sunlight, or solar radiation, is largely absorbed at the surface of the Earth and re-emitted as infrared radiation, or heat. But these same gases are not transparent to the infrared radiation, or heat, that the Earth emits. They absorb some of it, and part of what they absorb is radiated back toward the surface of the Earth. The overall effect of these gases is to trap some of the heat, and thus, like a blanket, they make the Earth warmer than it would otherwise be.
Except for water vapor, these are trace gases, meaning that they are present in very small concentrations, typically just a few parts per million. Recall that the major gases in the atmosphere, nitrogen and oxygen, combine to make up 99% of the molecules in dry air. But nitrogen and oxygen contribute nothing to the greenhouse effect. It is water vapor and the trace gases that are responsible for the natural greenhouse effect. We shall refer to them as the "greenhouse gases." When the Earth radiates heat in the form of infrared radiation out toward space, heat that you can feel coming off a hot street or a hot desert, it's these greenhouse gases that trap some of it. Clouds, too, are big contributors to the greenhouse effect. There are everyday examples of the greenhouse effect due to clouds. When you're outdoors at night, clouds keep you warmer than you would be on a clear night, because they trap some of the heat. Clear nights arc colder.
The greenhouse effect isn't mysterious. It has been keeping the planet habitable for billions of years. Without the greenhouse effect, the surface temperature of the Earth would be well below freezing.
Concern about the greenhouse effect does not involve whether or not it's there. It's as real as gravity, and we should be grateful for it. The worry is that we're adding to the greenhouse effect in a variety of ways by adding more of these trace gases to the atmosphere. When we refer to the greenhouse effect as a problem, we're being rather careless with our terminology. What we really mean is the problem of the enhancement of the greenhouse effect, the unnatural change we're forcing on the planet by changing the chemical composition of the atmosphere.
One of the things to think about as we examine this issue is the difference between the enhancement of the greenhouse effect, on the one hand, and the ozone hole, on the other. These two global problems, both serious, are very different in many ways.
We're adding carbon dioxide (CO2 ), the main culprit in the greenhouse problem, by burning coal, oil, and natural gas. It comes out of our chimneys, and it comes out of our tailpipes.
We're adding methane in a variety of ways, too, some of which aren't particularly pleasing to contemplate. It comes out of both ends of cows, for example. It also comes from rice paddies, leaks in natural-gas pipelines, and swamps. Like carbon dioxide, methane is also one of the products of combustion, released into the atmosphere whenever wood or fossil fuels are burned.
In the main, the greenhouse gases we produce are by-products of the modern industrial world. One of the main reasons why the enhanced
greenhouse effect is so much more difficult to grapple with than the ozone hole is that these gases are not like CFCs, which are manmade, have very specific applications, and for which we can invent ingenious substitutes. It's difficult to find a substitute for CO2 . To put it another way, there's no efficient engine that doesn't produce CO2 when it burns gasoline. CO2 is an inevitable by-product of combustion. It's in many ways an innocuous gas. It's what's in the bubbles in soft drinks, beer, and champagne. It's colorless, odorless, and tasteless. But it contributes to the greenhouse effect.
It's difficult to imagine today's governments signing an international treaty, one like the Montreal Protocol, calling for the elimination of most CO2 emissions by phasing out fossil fuels. This would be a lot tougher problem to face than the problem of how to phase out CFCs. The problem is not that alternative sources of energy would necessarily require major lifestyle changes. Indeed, for many, perhaps most, of the Earth's people, little or no change would be necessary. Even for the people of the developed world, accustomed to energy-intensive living, alternative energy sources are at least conceivable. Airplanes and automobiles can run on alternative fuels. The major obstacles to such a massive change in the way humankind generates energy are not so much technical as they are economic and political. When we discuss how best to arrive at a sustainable future, we should distinguish carefully between what we do not know how to do and what we cannot bring ourselves to do.
Another difference between the story of the ozone hole and the story of the greenhouse effect is that in the example of the ozone hole we have a rather dramatic confirmation, so striking and so convincing that there's no longer any serious argument about whether CFCs cause ozone depletion. For a while there was skepticism that CFCs were the culprit, just as there used to be skepticism that cigarette smoking causes lung cancer. But the scientific case is now much more than a statistical connection. There's now a very persuasive chain of physical reasoning that links CFCs to ozone loss, and there are extensive corroborating observations that have convinced not only scientists but also the governments of the world, that CFCs really do deplete ozone.
With the greenhouse effect, we don't yet have that "smoking gun." We don't have a Joseph Farman, who has seen the environment change dramatically, and has measured the change. Although we've been putting increasing amounts of carbon dioxide into the atmosphere for over a century, we still don't have clear evidence of global climate change
that we can point to and say, "This is something our production of CO2 is responsible for." It's hard to get people excited, and it's hard to get governments to react, when you can't lay out that kind of convincing evidence.
Though we can't prove to everyone's satisfaction that the greenhouse effect will get stronger soon enough and fast enough to matter, we think it will . In fact, scientific consensus is that the greenhouse effect, during our lifetime—perhaps during this decade, perhaps during the next—will increase enough that everyone will notice the results. Then we won't have just a long list of questions like, "OK, it was warm this year and there were some warm years in the '80s, but is that a global effect? Couldn't these have been natural fluctuations? Wasn't this just Mother Nature tossing a coin?" Instead, there will be an unambiguous, incontrovertible, impossible-to-deny climate change. We'll see warmer temperatures; icecaps will begin to melt and sea level will rise; and we may see changes, too, in specific climatic phenomena, such as a greater frequency of drought. That's the consensus.
Unfortunately, it's the nature of the problem, as we understand it, that the longer we wait to react, the greater the problem we must cope with. Scientists use the word committed in this context to refer to future change that will occur because of past human actions. The scientific consensus is that we're already committed to a certain amount of climate change, because of the CO2 we've already put in the atmosphere, even if today we suddenly stopped adding it, which we can't. Furthermore, people have not yet agreed on a practical and relatively simple technological fix analogous to the development of substitutes for chlorofluorocarbons. Instead, there are competing paths to attaining energy sufficiency while reducing dependence on fossil fuels. So we don't yet have a consensus on how best to go about reducing CO2 emissions, even if we had a very strong consensus that it was worth doing. And that applies to many of the other greenhouse gases too.
Although there is a scientific consensus on the issue of climate change owing to an enhanced greenhouse effect, it's by no means a unanimous consensus. Some scientists dissent from it emphatically, and the scientists who generally subscribe to it typically disagree with one another on specific points, such as how fast climate will change. Even if everybody were to agree on all these issues, everybody might later be found wrong. What we shall try to do here is to examine the basis for this consensus, to understand which parts of the scientific evidence seem relatively firm,
and which are more speculative and conjectural. We'll have the exciting experience of tracking a branch of scientific research while it proceeds, not one like plane geometry that is dead and fossilized and codified in textbooks.
With both the greenhouse effect and the ozone hole, we're talking about scientific predictions that appear to be generally consistent with actual observations, although in both instances the observations have been different from what the scientists who originally developed the theories envisioned.
In the case of ozone depletion, Rolland and Moline theorized in the early 1970s, purely from doing interesting basic science, that there might be a slow, gradual depletion in stratospheric ozone due to a growing accumulation of chlorofluorocarbons. They did not predict the catastrophic 50% loss of ozone in the Antarctic spring. They didn't predict either the existence or the magnitude of the hole, and they didn't anticipate that ozone loss would be most severe over Antarctica. The basic idea that CFCs could cause ozone loss turned out to be true, but the way in which the phenomenon first came to be observed was a surprise to the theorists.
In the same way, enhancement of the greenhouse effect started out, from the scientist's point of view, as an interesting abstract problem, an experiment. Roger Revelle and Hans Suess, two scientists at Scripps Institution of Oceanography of the University of California, San Diego, remarked in the 1950s that humankind was doing a onetime geophysical experiment by putting carbon (in the form of carbon dioxide) back into the atmosphere from its storehouse in fossil deposits tike coal and oil. They didn't think of the process as anything catastrophic or calamitous, or even necessarily bad for humankind. It was just an interesting idea. In a way, it was rather nice that the Earth would conduct an experiment, so to speak, and let scientists observe it.
The person who originally contemplated the enhanced greenhouse effect, purely theoretically, was Svante Arrhenius. An eminent chemist who won a Nobel Prize in chemistry, he published in 1896 what is arguably the first theoretical paper on the enhanced greenhouse effect. Arrhenius was from Sweden, a cold place, and he looked at the idea of the planet warming up as something that, on the whole, might be a good thing. Arrhenius's final words on the greenhouse effect, from his 1906 book Worlds in the Making, are not at all gloomy: "By the influence of the increasing percentage of carbonic acid [carbon dioxide]
in the atmosphere, we may hope to enjoy ages with more equable and better climates, especially as regards the colder regions of the Earth, ages when the Earth will bring forth much more abundant crops than at present, for the benefit of rapidly propagating humankind." Thus, the notion that the greenhouse effect—or, more accurately, its enhancement due to human causes—might have deleterious consequences for people is a realization that has dawned on us only slowly. A train of thought has evolved—in scientific circles, in the public mind, in the policy world—concerning what those consequences might be. That evolution continues.
The greenhouse effect is a complicated problem. It involves pure science, and, like the ozone problem, it also involves public perception and interaction between the scientific world and the world of policy-makers. But it's inherently a more difficult problem and one that's harder to comprehend than the issue of the ozone hole.
And it's a global problem. Everybody contributes to the greenhouse effect. Chlorofluorocarbons get produced mainly in industrialized countries, but carbon dioxide gets produced everywhere. Even China, which has a low per-capita consumption of resources compared to the United States, has so many people—four or five times the population of the United States—that it may well surpass the United States as the leading producer of carbon dioxide by about the year 2020. So Americans could all go back to eating nuts and twigs and living in caves and not producing any industrial gases at all, and we'd still have a problem. That's not to say that the United States need take no action. On the contrary, the United States can do more than any other single country to lead the world toward a sustainable future. American initiative is essential, but global problems require global solutions, and all countries will have to play a part.
Like so many other global problems, this one is inextricably linked to population. Thus, the question of sustainability of the Earth's environment is linked to how many people there are and how they behave. That's a theme that links all the global-change issues. We'll examine population and its relation to the sustainability of the planet in greater depth later. For now, let's delve into the science of the greenhouse effect.
Most sunlight passes through the atmosphere unimpeded. The Earth is warmed mainly by the sunlight that's absorbed at the surface, by both
the land and the sea. Some sunlight, about 30%, is reflected back to space, mainly by clouds, and thus doesn't interact with the climate system at all. This fraction of reflected radiation is called the albedo of the Earth.
The Earth radiates heat in the form of infrared energy. It doesn't radiate visible light as the sun does. We'll analyze why in detail later, but the short answer is that the sun is much hotter than the Earth. Instead, the energy that goes out from the Earth is in the form of heat. It's this infrared energy that's partially trapped by the greenhouse gases in the atmosphere.
Real greenhouses, by the way, don't work entirely by the greenhouse effect. One of the ways the greenhouse in the nursery keeps plants warm is simply by keeping wind out. When wind blows across plants, it carries heat away. The glass in the greenhouse, aside from whatever it does to the radiation, helps keep plants warm just by preventing air circulation around the little leaves and shoots.
There are many convincing demonstrations of the greenhouse effect in the atmosphere. A clear example of the impact it can have on climate is seen when comparing the Earth and the Moon. Both are about the same distance from the Sun, both get their energy from the Sun, and in fact the Moon's albedo or reflectivity is lower than the Earth's, so you might expect that the climate of the Moon would be warmer than that of the Earth. Instead, the Moon is much colder than the Earth. The average temperature difference between them is about 35° Celsius, or 63° Fahrenheit. This difference is due almost entirely to the presence or absence of a greenhouse effect. You wouldn't want to live on the Moon, quite apart from the fact that there's no cable television. The Moon has a brutal day/night temperature difference, with scorching hot days and bitter cold nights, because there's no atmosphere to mediate the temperature change and make sunrise and sunset less jolting.
The Earth has an atmosphere that traps heat, but the Moon has no atmosphere; it's so small, its gravity so weak, that any atmosphere it once had long ago escaped to space. What surrounds it, right down to its surface, is space. The early Moon may have had an atmosphere, but small planets and small satellites of planets—small moons—no longer have atmospheres, because they're not gravitationally strong enough to hold them. For the same reason the astronauts frolicking on the Moon could make gigantic leaps almost effortlessly. Earth has sufficient gravity to have retained an atmosphere, and the giant planets like Jupiter and Saturn, with their massive gravitational fields, have very heavy, very dense atmospheres.
The greenhouse effect can also be seen on other planets. Compare the climates of Mars and Venus. Both have mostly carbon dioxide in their atmospheres, but Venus has a very dense atmosphere, about 100 times denser than Earth's. The Martian atmosphere is about one hundredth as dense as Earth's. So the greenhouse effect is very small on Mars and very powerful on Venus. Venus is very hot; Mars is very cold. You need radar and a satellite to look at Venus, for two reasons. One is that it's completely covered by clouds, so you can't "see" the surface unless you use the special capability of radar to penetrate the cloud cover. The other is that you wouldn't want to put an instrument on the surface of Venus. It's been done, but the instrument doesn't last very long, because the surface of Venus is hot enough to melt metal.
The graph on the facing page is in some ways the most famous in all of Earth science. It is the Keeling curve, the result of the persistence, vision, and skill of Charles David Keeling, who has spent his entire career at Scripps Institution of Oceanography at the University of California, San Diego.
This wiggly curve (scientists call every graphed line a curve, no matter what its shape—nobody knows why) shows the results of measuring atmospheric carbon-dioxide concentrations since 1958. This curve is now the result of measurements made by many people. But originally, and for many years, the work was carried on entirely by Keeling himself. He realized it needed to be done. He created the technology. There was no instrument to measure CO2 accurately until he invented one. There are nearly six billion people on this Earth, and one of them has measured CO2 and shown the rest of us that it can be done, that CO2 is rising, and that it's rising due to human causes. Keeling has received many awards for his research, and his fellow scientists regard him and his work with great respect. His attention to detail and his passion for accuracy are legendary. His measurements of atmospheric CO2 are unanimously acknowledged to be rock-solid. Scientists like to argue, and they do argue about many aspects of the greenhouse effect and climate change, but nobody argues about Keeling's data. (Incidentally, there are two prominent Keelings in atmospheric chemistry. Charles David Keeling's son Ralph is also a faculty member at Scripps, but he has not been measuring carbon dioxide. Among other things, he has been measuring the concentration of oxygen in the atmosphere.)
The annual average concentration of CO2 in 1995 is almost 360 parts per million, which reflects a rise of more than 10% since Keeling first
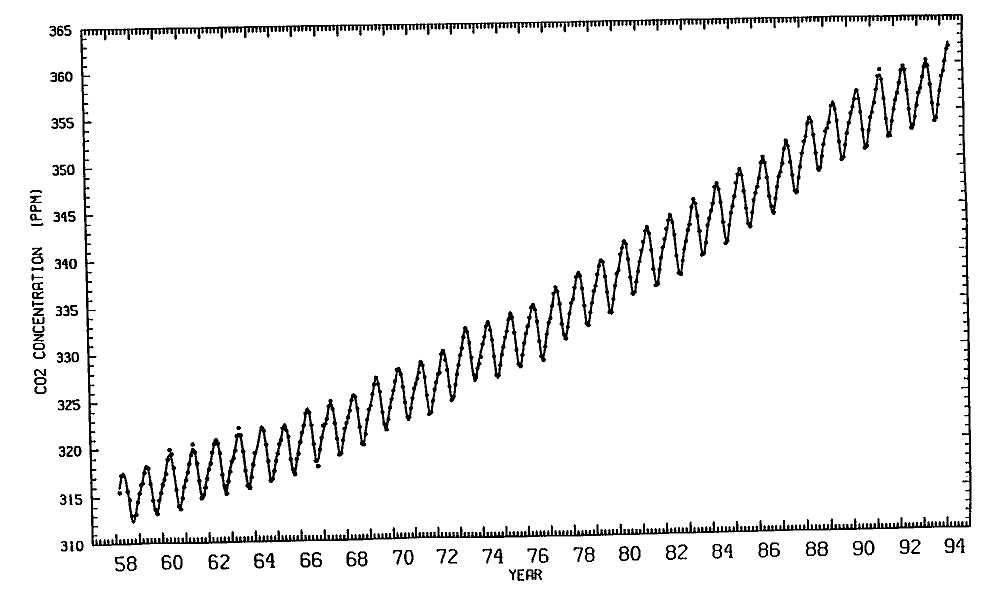
Keeling curve, showing rise of atmospheric carbon dioxide concentration, in parts per million by
volume (ppmv), since 1958. (Source: C. D. Keeling, Scripps Institution of Oceanography, UCSD)
measured it at 315 in 1958. From analysis of ice cores, we know that the concentration was about 280 parts per million in the late 1800s. So, it has gone up about 25% since preindustrial times, and we know it was lower still during the ice ages. Thus, we have a very convincing record. CO2 is now rising at a little less than 0.5% per year.
In Keeling's data, incidentally, you can see the temporary slowing in the rate of rise of CO2 due to the 1973 oil crisis, as well as the effects of natural changes. The recurring wiggles in Keeling's CO2 curve are evidence of the natural annual cycle of carbon in the biosphere, the world of living things. Plants, mainly the trees on land, grow during spring in the Northern Hemisphere—since there is far more land in the northern half of the globe than in the south, most of the trees are found there. During the spring they take in carbon in the form of CO2 from the atmosphere, producing the low points on Keeling's curve. In the fall, when these plants shed their leaves, they give off carbon and the curve goes back up again. The rhythmic, seasonal rising and falling of the curve that results is the signature of the biosphere breathing, the trees taking in and subsequently giving out carbon in a yearly cycle, lt's a clear example of how living things influence the global environment.
The feature of the Keeling curve that's significant to the greenhouse effect, however, is its steady upward climb, due primarily to the release of CO2 every time we burn coal, oil, gasoline, or natural gas. Today, fossil-fuel combustion is the main source of CO2 . Deforestation—the ravaging and incineration of rainforests and other wooded areas—is the secondary source. Not long ago, when we didn't burn so much fossil fuel and when there were more forests, deforestation was the primary source.
The fuel that we're burning today was formed in the distant geological past from the carbon-rich remains of plants and animals (hence the term "fossil fuel"). It's in this sense that Revelle and Suess spoke of our doing a onetime geophysical experiment. We can do it only once, for once we've taken the fuel that's stored up as coal, oil, and natural gas and burned it, thus putting the carbon back into circulation, we can't do it again. It will be used up. It took millions of years to form, and we can use up essentially all of it in a few centuries, which is but the twinkling of an eye on the geological time scale. Thus, fossil fuels are truly nonrenewable resources.
A central, evolving issue in global change is people: how many there are, where they live, and how they use energy. The places with big potential
differences between current and future use are not North America or Western Europe or Japan, but rather the Third World and the former communist world, or Second World. The developing countries are the countries that are expected to increase their energy consumption the most.
The annual global production of CO2 is something we know, approximately. We don't have accurate estimates of the amount of CO2 added from deforestation and other land-use changes, but we do know how much coal, oil, and gas is extracted from the ground. From fossil fuels, we're currently putting 5 to 6 billion tons of carbon in the form of CO2 into the atmosphere every year—about 1 ton for every person on Earth. Only about half of the carbon produced by the burning of fossil fuels appears in the form of an increase in the measured atmospheric concentration of carbon dioxide. The other half apparently is absorbed by the ocean and by the terrestrial biosphere, that is, the world of living things on land, such as trees. Carbon is transferred continuously between the atmosphere, the oceans, and the land, and many aspects of this "carbon cycle" are imperfectly understood.
Let's look again at the composition of the atmosphere. It's important to keep these facts in perspective. Dry air is a mechanical (not chemical) mixture of gases, of which the most abundant by far is nitrogen (78%). The second most abundant is oxygen (21%). Thus, together they make up about 99% of the dry atmosphere. Argon (chemical symbol Ar), an inert gas, accounts for most of the remaining 1%. The greenhouse gases altogether are thus very rare relative to those three gases.
Real air contains not just dry air, of course, but also water vapor, which is present in all natural air in highly variable concentrations. There's hardly any of it over the desert, for example, and there's a great deal of it in tropical rainforests. It's also much more abundant near the Equator than near the poles. In the tropics, water vapor may be as much as 4% of the atmosphere, by volume. Near the poles, it may be much less than 1%. In any one place, the abundance of water vapor in the air also varies a great deal from day to day. Its abundance, as measured by relative humidity, is reported as a standard meteorological observation. (Relative humidity is a measure of how saturated the air is, expressed as a percentage. It's the ratio of the amount of water vapor in the air at some spot compared to the maximum amount that the air could "hold" at the particular temperature and pressure at that spot.)
Water vapor is a powerful greenhouse gas, whereas nitrogen, oxygen, and argon don't contribute at all to the greenhouse effect. The reason
for this difference lies in the fundamental physics of how gas molecules interact with radiation. To absorb infrared radiation significantly under the pressure and temperature conditions of the Earth's atmosphere, a gas molecule has to have at least three atoms. Both nitrogen (N2 ) and oxygen (O2 ) have just two atoms and therefore don't absorb infrared radiation. Water (H2 O) has the necessary three atoms to produce a greenhouse effect. The water molecule is thus able to absorb radiation, but only at certain wavelengths. Other substances, too, have the ability to absorb radiation, but at different wavelengths, so that each absorbing substance has its own unique radiative signature. Other molecules with three atoms or more include carbon dioxide (CO2 , one carbon and two oxygen atoms) and methane (CH4 , one carbon and four hydrogen atoms). Both of these molecules absorb radiation. In the atmosphere they're present in relatively small concentrations.
At almost 360 parts per million, (CO2 comprises 0.036% of the atmosphere. That's 36 thousandths of 1%. It's a very rare gas. And the concentrations of the greenhouse gases other than water vapor are even smaller. Intuitively, it may seem unlikely that a gas that makes up so little of the atmosphere should have such a large effect on radiation, but nature is sometimes surprising.
Chlorofluorocarbons (CFCs) are present in even tinier concentrations, but molecule for molecule they arc incredibly effective at trapping heat in the form of infrared radiation, as we've seen. One of the many intricate linkages between the greenhouse problem and the ozone depletion problem is that the CFC substitutes being developed as a result of the Montreal Protocol, designed to be less harmful to the ozone layer, nonetheless have serious greenhouse consequences. The substitutes are themselves greenhouse gases, absorbing infrared radiation just like the CFCs they will replace. In addition, they have long lifetimes in the atmosphere. In calculating how much the greenhouse effect is changed by adding a gas, it's important to know not only what an individual molecule can do in terms of absorbing heat but also how long that molecule will stay in the atmosphere. CFCs typically have a lifetime of about a century. CO2 lingers about that long too. Methane is cycled through the atmosphere relatively quickly, in about 11 years.
In units of parts per million by volume (ppmv), the present-day (1995) CO2 concentration is almost 360. Remember, that figure varies from spring to fall as trees take in and give off CO2 . But it was 315 when Keeling started his measurements. These are well-established numbers and are not at all controversial.
The number 280, for the nineteenth-century CO2 value, is a little less certain, since it's measured from air trapped in ice. The process used to arrive at that figure involves actually drilling into glaciers in Antarctica and Greenland and the Alps and bringing up an ice core, a slender cylinder often many meters long. The core is kept frozen before being crushed and analyzed in the laboratory. The air thus released from the ice is trapped, and its CO2 content is determined by shining an infrared laser through the air to determine its ability to absorb infrared radiation.
That process allows us to determine the CO2 concentration in the late nineteenth century and in earlier times as well. Since the ice can be dated, we also know what the concentration was thousands of years ago, so there's essentially an unbroken record of CO2 measurements, from the geological past through the preindustrial period and into the twentieth century—right up to 1958, when the amount of CO2 in recently formed ice matches the concentration Keeling found when he first started measuring it in the air. Thus, Keeling's curve, the record of the last 35 years or so, is tied to and extended backward in time through this ancient record.
The present rate of increase of CO2 is about 0.5% per year. That figure depends not only on the amount of CO2 we put into the atmosphere but also on the carbon cycle, which determines how carbon is transferred between the ocean, land, and atmosphere. One of the uncertainties, yielding an area of major active research, is the nature of the carbon cycle. We know that carbon is transferred from fossil fuels into the atmosphere in the form of CO2 . From there, some of it is absorbed by plants in the process of photosynthesis. And plants, when they decompose, return carbon to the soil. This is one of the ways in which carbon is cycled from the Earth to the atmosphere through living things. Carbon is also continually exchanged between the oceans and the atmosphere. Thus, carbon is constantly cycling through the land-sea-air system, including the biosphere—the world of living things both in the sea and on land. The rates at which this happens—the rates of "flux" or exchange of carbon between oceans, land, and air—are still imperfectly understood. Right now, about half of the CO2 put into the atmosphere appears in the measured record of increasing atmospheric CO2 abundance.
In recent years, about 6.5 to 8.5 billion metric tons of carbon have been added each year to the atmosphere by human activities, but only about 3 billion of these metric tons of carbon have appeared in the atmosphere in the form of an increased amount of CO2 . What became of the other 3.5 to 5.5 billion metric tons? We're not sure. Presumably,
they've somehow been taken up by the land, including the plants, and the sea. This area of research is complicated by the difficulty of measuring the rates of exchange of carbon on a global basis. Yet it's vital that we understand more about the carbon cycle if we're to forecast its behavior and its role in climate change. For example, will the fraction of carbon added to the atmosphere that appears in the form of additional CO2 remain at 50%, or will it change? We're not yet able to say.
We've been focusing on carbon dioxide, but remember that CO2 is only half of the man-made problem. The other half of the enhanced greenhouse effect is due to methane, nitrous oxide, ozone, and chlorofluorocarbons. The growth rates of some of those gases, the rates of increase of their concentrations, are higher than the rate of increase of CO2 , but may be more changeable. For example, if we're successful in phasing out the manufacture of chlorofluorocarbons, their growth rate in the atmosphere will fall to zero. (Production of the major CFCs decreased 40% from 1986 to 1991.)
When we speak of CO2 increasing the greenhouse effect, then, we're using it as shorthand for a whole suite of gases, of which CO2 is the most important, because it's the most abundant. Like every other aspect of this problem, the mix of these gases will change as time goes on.
With an understanding of how the atmosphere's chemical makeup has changed to date, we can now move on to the central questions: Is the Earth warming, and if so, why?
Scientists have been able to compile a record of how the global average temperature has changed over the last century or so. This record is an estimate—it's not free of errors and uncertainties. How does one estimate the global average temperature? By carefully piecing together records from many thermometers, including measurements made both on land and from ships at sea, correcting them for known errors, and judiciously interpreting them. The record shows that temperatures in recent years are about half a degree Celsius (about one degree Fahrenheit) higher than the average temperatures of a century ago. But we don't know why . We can't unambiguously claim, thereby convincing ourselves or anyone else, that this observed warming of the surface of the Earth is due to the enhanced greenhouse effect, either entirely or in part. Although the temperature rise is consistent with the greenhouse theory, it's not convincing evidence in support of it.
Measuring the temperature of the Earth is neither easy nor straightforward, though there are fewer difficulties today than there were in the
past. I want to mention a few of the difficulties to help you start thinking about how to interpret this kind of scientific data.
One of the things to keep in mind is judging how much we should trust the results of a certain kind of science. We shall see that neither observational data, like the temperature measurements, nor theoretical results, like climate predictions, are perfectly reliable. The models that we'll look at later, the computer programs on which our projections of the climates of the twenty-first century are based, are subject to considerable interpretation and uncertainty.
Models are uncertain because the equations we feed into the computers aren't perfect representations of the way the real world works. Science is not yet at the point where we understand the climate system well enough, or have the resources to collect sufficient data, to make the equations accurate enough. So the models give us a prediction, and then we have to make a judgment about how far to trust it.
Data, as contrasted with models and equations, do have a certain reassuring solidity to them. You make a measurement, you get a number. And isn't that a scientific fact, and shouldn't you believe it? Shouldn't we take such a number for what it purports to be?
No. Measurements, just like theories, models, and equations, are subject to uncertainties, for lots of different reasons. Maybe a thermometer was inaccurate. And there are many, more subtle reasons than that.
The measurements on which we base our estimates of the Earth's global average surface temperature are contaminated by several serious sources of error. One of them is sampling error: we haven't made measurements uniformly in space and time with identical instruments at identical locations over the whole 100-plus years of record. About 70% of the Earth is covered with ocean, and the Southern Hemisphere is nearly all ocean. Few measurements are made at sea because people don't live there. And even within the remaining 30% that is land, there are vast areas (imagine the great wastes of Antarctica and Greenland) where very few people live and very few measurements are made.
The climate record includes measurements not only of air temperature but also of ocean temperature. The early part of the record of sea-surface temperature comes from very sparse measurements made from ships, originally sailing ships, and, later, motor-driven ships. Those data are also contaminated by changes in the way measurements were made as time went on. The earliest measurements were made by hoisting a bucket of water up on the deck and sticking a thermometer in it. Later, people measured the incoming temperature of the sea water used
to cool the ship's engine, using instruments placed under the water line at the cool-water intake. But as ships got bigger, this intake was located lower in the water. Measurements were made at gradually lower depths, on the average as bigger ships gradually replaced smaller ships. The temperature of the upper ocean changes rapidly with depth. It gets colder quite quickly as you descend in the ocean, as you may know from swimming. Hence, a cold bias was introduced into the data as ships got bigger and measurements were taken deeper in the sea. Moreover, ships don't travel everywhere on the ocean, but remain confined mainly to well-established areas. As shipping lanes changed over the years, these geographical sampling errors changed for that reason, as well.
Air-temperature measurements, too, are not immune to error. Measurements on land are made largely from the network that's in place to take daily records for weather-prediction purposes. A lot of those Measurements arc made at airports, but temperatures at many airports have increased artificially as the cities around the airports have grown. This phenomenon is known as the urban heat-island effect, and it arises because city streets and buildings absorb sunlight more effectively than does bare or vegetated land. The airport that was built outside of town is often now well within the city's developed periphery, resulting in higher temperature readings.
There arc many other ways in which these measurements have been dirtied up—by instrument errors, by sampling errors, by plain old mistakes. Some of those ways occur despite great technological sophistication. In the modern record, the weather-forecasting people, before they use data, run them through a complicated series of quality checks. But remember the story of the ozone hole. The quality check on the satellite measurements of ozone levels threw out the first satellite evidence of decreasing ozone because the readings were "too low," lower than what some computer programmer had set—with all good intentions—as the threshold. Because of someone's preconceptions, a great body of accurate measurements was discarded as being unbelievable.
In the same way, processing the data used by weather services as a basis for the daily forecast involves, passing the measurements through several "filters"—running them through a model like the weather-forecasting model, checking them for internal consistency. As time has evolved, models have changed, quality checks have changed, filters have changed. In fact, a very, large and expensive re-analysis of the raw data of about the last 30 years is now under way to try to reprocess at least
the most recent data—presumably the best measurements—with one consistent procedure.
These comments apply in general to climate measurements other than those of temperature, as well. Measurements themselves arc like results from theories and models. They need to be questioned. They need to be interpreted. They need to be treated intelligently by people who know how they were created. If you don't understand where the numbers came from, you're likely to make errors in drawing conclusions from them.
So it remains a matter of debate today not only whether the Earth is warming but also how rapidly. The average consensus figure is that the planet is about one-half degree Celsius, close to one degree Fahrenheit, warmer now than it was about a century. ago.
The warming hasn't been the same in the two hemispheres. If we had broken the data down into smaller regions, it would be clear that the warming has been different even from region to region. And it's clear that the warming hasn't occurred uniformly through time, either. Although the atmospheric concentrations of carbon dioxide and the other major greenhouse gases have always been increasing over this period and have never diminished, the average global temperature has nonetheless sometimes declined. There was apparently a warming trend for about the first 40 years of the twentieth century and then a prolonged decrease, from about 1940 to about 1970, that we don't really understand. That decrease appears to be mainly a Northern Hemisphere phenomenon (again, the Southern Hemisphere is much less well observed). Some scientists attribute the decrease to a change in the circulation pattern of the North Atlantic Ocean, rather than to any global phenomenon. These uncertainties of fact and tentative interpretations are typical of all kinds of weather and climate records.
One of the most useful things you can do with climate records is to get an idea of how variable climate can be. Sometimes the best way to think about what the climate of the future might be is to look at how the climate has varied over the past. Even if you don't understand what caused the variations—and we surely don't—you at least gain insight into how variable Mother Nature herself can be. There's more to be learned from the global average surface-temperature record than just the fact that an irregular warming has occurred over the last century.
There are imaginative ideas afloat in the scientific community about alternative ways to measure changes in the Earth's temperature. One is
by using sound in the sea. Walter Munk is a renowned physical oceanographer who has spent his whole career, more than 50 years, at Scripps Institution of Oceanography at the University of California, San Diego. He and other scientists have recently carried out an experiment at Heard Island, which is near Australia. The experiment consists of creating sound waves in the ocean off Heard Island and listening for them all over the world.
The reason Heard Island was picked is that it just so happens, as an accident of geography, that there are sound paths from the island to the other side of the world over all the ocean basins. One set of sound waves comes up around the bottom of South Africa, up the South Atlantic, and into the North Atlantic. Another set goes through the New Zealand region and the archipelago there, past Hawaii, and up into the North Pacific Ocean. Thus, you can sit in many places in the world, put an earphone, so to speak, into the ocean, and hear the noises made at Heard Island. It's an extraordinary location for that purpose. Otherwise, it's a ghastly, barren place, with miserable weather and huge seas.
As the ocean warms up, the speed of a sound passed through it changes. Sound waves travel faster in warmer water and thus arrive sooner. Though the ocean is warming up, if it's warming up at all, by only small fractions of a degree over several years, these sound travel-time measurements arc very accurate. You can measure the time between the moment Munk makes the noise at Heard Island and the moment when somebody off the west coast of North America hears it. You can measure that to the one-thousandth of a second. The idea is that by making these measurements intermittently over a period of a decade or so, you can tell whether the ocean is warming. It's a method that has tremendous natural advantages.
One is that it naturally averages over the whole Earth. In fact, Munk has confessed that to him one of the aesthetic appeals of the experiment is the global scale of it all. He isn't just sitting somewhere measuring a local change; the whole Earth is his laboratory. That's what's needed anyway. We'd like to have a globally averaged measurement that avoids some of the problems of sampling errors.
The ocean ought to be warming, if the theory, of global climate change due to an enhanced greenhouse effect is valid. These high-accuracy, large-scale geographical measurements, taken over a long time span, should be able to establish whether such an ocean warming is detectable. The method is feasible, too, in contrast to the impossible problem of sending out lots of ships to cover the whole ocean. But it has its disadvantages as well. One is that the measurements follow a part of
the ocean called the sound channel, where sound waves are trapped. In parts of the oceans, that channel is near the surface; in other parts, it's deeper down, and the method is therefore not measuring the same slab of ocean, so to speak, everywhere.
One interesting aspect of this novel technique is that the speed of sound in the sea is affected by the oceanic equivalent of storms. There are eddies in the ocean, big, swirling things that last for months and are hundreds of kilometers across. If a sound wave passes through an eddy, both the signal and its travel time are distorted, but because the sound travels across an entire ocean basin, the measured speed, which is convened to temperature, is an average over many such eddies. The averaging process greatly reduces the error that might occur if the measurement were made in a geographically limited region.
Incidentally, much of the equipment used in this experiment was made available by the U.S. Navy. It was originally designed for detecting submarines, and its conversion to peaceful civilian research use is a triumph of both politics and technology. The sound waves that this equipment produces are readily distinguishable from all the other noise in the ocean because what is being sent is essentially a code. Munk and his colleagues can listen specifically for that code. Think of it as Morse code, if you want. But it's not just somebody clapping hands under water. It's a special signal, and the very sensitive receivers used in this experiment are tuned to recognize it, dependably.
As you can imagine, it takes very large gadgets to make enough noise to be heard around the world. One of the worries was whether that sound would bother animals who live in the sea. Suppose you were a whale and someone set off the equivalent of a blaring horn next to you. That might bother you. This was a very serious concern for a lot of the countries involved, including particularly the countries through whose waters the sound had to pass. Several of these countries had to decide whether to issue permits allowing the experiment to take place, and so they were especially sensitive to this concern.
So were Munk and his fellow oceanographers. A Scripps expedition to Heard Island in 1990 included biologists and environmental officials from various countries, who would study the effect of the first test pulses on sea animals. Apparently there was no ill effect, and some big marine mammals even seemed attracted to the sound. Perhaps they were curious about what the small oceanographer animals were up to.
The team is continuing its research on the effects of sound on marine mammals, including whales. In fact, the effort to measure ocean temperature by acoustic techniques is now the largest single source of
research funding on the little-understood subject of how animals in the sea react to sound. We're now confident that the sound signals do no physiological damage to marine animals. There is no basis whatever for fears that animals might be deafened or otherwise injured. The intensity, of the sound is comparable to the noise made by a large ship, such as a tanker, and, of course, there are many tankers at sea. Thus, the experiment simply adds a little more noise to an already noisy environment. And in any case, the sound sources arc at low frequencies and are run in pulses, not continuously. Because the intensity is increased gradually during each pulse, an animal that's nearby has time to move a comfortable distance away. An area of research that's still under way is that of possible effects of sound on the social behavior of animals such as whales. Very little is now understood about that aspect of the effects of sound on marine life, and much may be learned from the current research.
The Heard Island expedition actually got the experiment off to a premature start. The sound pulses first put in the water as a test of the system and as a preliminary test of the effect on animals were actually heard by the people that were setting up their receivers around the world. Before the experiment had even begun, the first results were in. The scientists had heard Heard before they had planned to.
Plans are well along for a larger-scale experiment, known as ATOC, an acronym for acoustic thermometry of ocean climate. I think we can say with certainty that if we do that experiment for ten years, we'll learn a good deal about the ocean that we didn't anticipate. We may have the first clear, unambiguous evidence of a systematic change in ocean temperature. It's a nice experiment, essentially an upgrading of the Heard Island project. The hope is to have a decade-long experiment under way pretty soon. It's expensive, but the U.S. government has agreed that it's worthwhile and will pay for it.
"It is a test of true theories not only to account for but to predict phenomena," wrote William Whewell in 1840. After all this analysis of the past and present, what can we say of the future?
As far as carbon-dioxide levels are concerned, we don't know what will happen in the decades to come. The farther ahead we look, the more uncertain we are about how much energy we'll be using and what sources it will come from, and therefore the more uncertain we are about how much higher the CO2 concentrations will go. We can predict how much of each energy source we'll use next year and the
year after that. But ten years from now, who knows? Fifty years from now, who would dare guess? Who can predict whether nuclear fusion will become an energy, source that's reliable and cheap in 50 years? I don't think anybody can. Neither can we predict whether political attitudes will change so that in 50 years the United States, like France today, will make most of its electricity from nuclear power. Nobody knows.
And who can deal with the most important question of all when trying to forecast global production of CO2 : What will the developing world do? Can anyone predict what China and India will do—especially China, with its enormous population and, relatively speaking, almost inexhaustible reserves of coal, enough for the next century, or so?
The farther ahead we look, the more difficult it is to predict what the CO2 burden on the environment will be, because we're forecasting human behavior, something even harder to predict than the weather.
It seems likely, however, that sometime in the mid-twenty-first century—2030, 2040, 2050, nobody knows just when—CO2 will have doubled its preindustrial concentration. A CO2 level that was 280 parts per million in the nineteenth century and is almost 360 in 1995 will be twice 280, or 560.
This particular benchmark, the doubling of CO2 , predominates in the scientific analysis of this problem, because it's easy for a climate modeler, someone who is carrying on research with one of the big computer programs we will look at later, just to turn the CO2 value up to twice its present-day value. Doing so provides a measure of the sensitivity of the climate system to CO2 . Settling on "doubling" also simplifies efforts to educate governments, the press, and the public.
But there's nothing magical about this doubling. It's just a benchmark. If your son is 2 feet tall and on his way to adulthood, he'll grow to 4 feet tall, too. He'll double his size. Later he may triple his earlier 2-foot stature. Those are just benchmarks. Similarly, CO2 , which has already grown considerably, will indeed double and later may well triple its preindustrial concentration.
But remember that the greenhouse gases that matter most—methane, nitrous oxide, chlorofluorocarbons, and ozone—are generally growing at faster rates than CO2 , and the rule of thumb is that carbon dioxide right now is only about half the problem, while the other greenhouse gases account for the other half. Although we'll use the doubling of atmospheric CO2 as our benchmark, keep these other gases in mind as well.
So how will the addition of these greenhouse gases affect the climate? If answering this question is not absolutely impossible, it's at least frighteningly difficult.
When we try to foresee the future global climate, we're not simply extrapolating past behavior. We're not projecting into the future the changes we've observed in the past. You can't look at the child who is 4 feet tall today and predict that he'll be 6 feet tall later just because he used to be 2 feet tall. But you can use your knowledge of the growth of children and of parents' heights to predict what his height is going to be. In the same sense, we're not simply extrapolating a past trend into the future when we make a climate prediction. We're using our understanding—rudimentary, fallible, and incomplete as it is—of how that system works.
Keeping that distinction in mind, then, 2.5°C (Celsius), or 4°F (Fahrenheit), is the typical benchmark figure by which many scientists predict the climate will warm in response to a doubling of CO2 . Later we will consider in detail where that figure comes from.
It's interesting to note that this number of 2.5°C is not so far from the prediction made in the first paper published on this topic, by Svante Arrhenius—in 1896. He predicted an average temperature increase of 5° to 6°C (9 to 11<A0176F) due to the anticipated doubling of CO2 .
Now is a good time to mention one of the special consequences of characterizing climate only by global temperature. It's misleading in many ways to talk about climate change in terms of temperature change, as misleading as it would be to talk about health in terms of body temperature alone. If you say, you have a fever of a degree or two, you've made it clear that you're not entirely healthy, but you haven't said what's bothering you. We don't know whether you have a mild cold or a serious disease. In the same sense, when we talk about a climate change of 3 degrees Celsius, we can judge that it's more serious than a change of I degree, but we haven't addressed the full nature of the climate change reflected by that single number. We haven't said anything about other aspects of climate that really matter. We haven't talked about whether droughts will be more frequent. We haven't talked about whether the strongest hurricanes will be still more intense. We haven't talked about whether sea level is going to rise, what the pattern of rainfall will be, what the effects on agriculture are likely to be. We haven't talked about the aspects of climate that matter to human beings and other living things, or the aspects of the economy that are
sensitive to climate, especially agriculture. So it's rather artificial and abstract to talk of climate change simply in terms of temperature.
The idea of using carbon-dioxide doubling as an index of climate change on which to base the discussion is likewise a bit misleading. In the real world, we're not instantaneously doubling CO2 —making it twice as much tomorrow as it is today—and then waiting for the climate to come into equilibrium with that new chemical composition of the atmosphere. Instead, we're gradually adding CO2 , and while we're adding it, we're also adding the other gases. We're doing all this over a period of many decades. And while that's happening, we're also making other changes on the planet. We're changing the land surface by deforestation and by urbanization and by agriculture, for example. Other global factors may be changing as well. Over a century, the Sun can change intensity, for instance, or volcanoes and people can add aerosols—small particles—to the atmosphere. Climate researchers have only recently realized that aerosols can have globally large effects.
A lot of things are happening at the same time. The experiment we're all conducting on the Earth isn't an instantaneous one in which we hold everything else constant and change only the greenhouse gases. Instead, it's an experiment in which we're modifying the evolution of a planet, one that would have been evolving into something different anyway, without our help. We know from the temperature record of the distant past that climate is always changing. It shifts on time scales of hundreds of thousands of years between ice ages and interglacial periods like the one we're in now. On shorter time scales, we see climate variations that we can't explain and can't predict. We think such variations, such as the Dust Bowl of the 1930s in the U.S. Midwest or the more recent drought in sub-Saharan Africa, are due to the natural variability of the climate.
Hence, in addition to all this natural evolution—on top of what an engineer would call "noise"—we're adding something else to the climate. We're stirring one more potent ingredient into what is already a very complicated soup. What we're doing is very different from, and vastly more complex than, the clear, simple, idealized computer experiment of instantaneously doubling CO2 .
In short, using the doubling of carbon dioxide as a prime indicator is partially misleading, and measuring climate by globally averaged temperature is also partially misleading.
Keep in mind that the difference between one climate and another can be due to a subtle change somewhere. The difference between a
desert and a neighboring rainforest can be due to nothing more than a mountain range or a difference in the pattern of storms. Climate is subtle, and big changes in climate can arise from small causative effects. Just as a finger on a trigger can set off an explosion, so a very subtle change in a climate input can have a massive change in a climate output. There are also processes in the climate system that have an amplifying effect. We'll see that again and again as we look at the climate consequences of a change in the greenhouse effect, as simulated by the climate models we'll examine next.