2—
Education and Number of Siblings
Has number of siblings affected the life chances of individuals in this country by significantly influencing the amount of education they have been able to attain? If so, where in the educational process has sibsize been most influential? What has been its relative importance compared to other background variables? Do the findings differ by age cohorts?
In this chapter, the first to consider empirical results, we will concentrate mainly on establishing the effect of sibsize in a variety of studies of adults and, in addition, within these studies demonstrate its relative importance compared to the major control variables to be used throughout the analysis.
Initially, we will discuss total years of educational attainment, and then we break down this experience into components—years of graded schooling (grades 1 through 12), proportions completing high school, proportions of high school graduates going to college, and years of college schooling.[1] For visual convenience, many of the findings are presented in charts, but the full tables may be found in appendix B. Since the educational losses with each increase in sibsize are obvious from the figures and appendix tables, our discussion will emphasize particular comparisons such as those between only children and children from two-sibling families; between children from two-sibling families and those from families of four siblings or more; and between only children and children from families of seven siblings or more.
Sibsize and Total Years of Education
Figure 2.1 summarizes the bivariate relation between sibsize and total years of education for respondents in each survey. Numerical
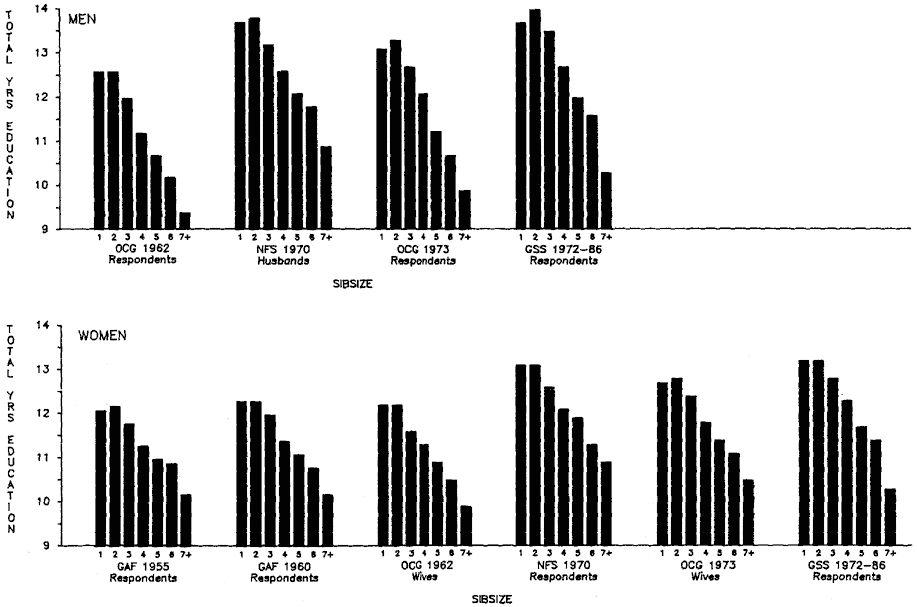
Figure 2.1.
Total Years of Education (Unadjusted Means) by Sibsize, White Men
and Women Age 25 and Over, Various Surveys.
| |||||||||||||||||||||||||||||||||||||||||||||
| |||||||||||||||||||||||||||||||||||||||||||||||||||
data supporting figure 2.1 are in table B.1 in appendix B. As is evident, except for the only child, there is a marked linear relationship between sibsize and total years of education attained. The somewhat less distinguished performance of the only child, versus those from sibsize two (in five instances) is due primarily to the effect of disproportionate numbers of broken families among only children, as may be seen from table 2.1, comparing only children and those from sibsize two who came from intact families. From table 2.1 we see that the only-child deficit is reduced in general, that it now appears in only three instances, and that it has been translated into an advantage in three instances.
The correlation ratios (etas) for the relationships in figure 2.1 range between .298 and .389. Table 2.2 indicates that the difference in educational attainment between only children and those from sibsize seven-plus is, in most surveys, close to a standard deviation. On average, taking all surveys combined, this difference is .94 of a standard deviation among men and .87 of a standard deviation among women. A less extreme comparison, contrasting respondents from sibsize two versus sibsize four-plus, table 2.2 shows that the difference is still very large—on average .70 and .65 of a standard deviation among men and women respectively.
Another way of looking at sibsize differences is to compare them with other types of variability in educational attainment to which we customarily attach importance, such as differences by race and age. During the mid-1970s in the United States, the black–white differential in years of education among men age 25 to 64 was 2.2 years and, among women, was 1.2 years (U.S. Bureau of the Census 1977). By age, the differential between those aged 25 to 29 and those aged 60 to 64 was 2.6 years among white men and 2.0 years among white women. During a comparable time period, our analysis of the surveys used here shows that, for example, in GSS 1972–1986 (table 2.3) the educational gap between white men who were only children and those from sibsizes seven-plus was 3.4 years. For comparable women, this gap was 2.9 years. The gaps for white men and women in the OCG 1973 study were 3.2 and 2.2 years respectively. In effect, the difference between the extremes of sibsize exceeded by a substantial margin the racial and age difference. A less sensational comparison of sibsizes, respondents from sibsize two versus sibsize four-plus families, shows the difference in educational attainment to be 2.6 years for men and 2.0 years for women
| |||||||||||||||||||||||||||||||||||||||||||||||||||||||||||||||||||||||||||||||||||||
in the GSS 1972–1986 study, which is comparable to or exceeds racial differences or variability among the extremes of age.
Obviously, the variability in educational attainment by sibsize is not assignable entirely to the fact of sibsize alone. These differences are partly a function of other family characteristics known to be associated both with sibsize and with people's educational attainment. As discussed in chapter 1, we have controlled insofar as possible for the same background variables in each survey. Congruent with Featherman and Hauser's model (1978), we have used as controls the respondent's age, the parental family's socioeconomic status (as measured by the father's score on the Duncan
SEI index), the father's educational attainment, whether the family was intact, and farm background.
For total years of education, the adjusted means by sibsize for each survey are shown in figure 2.2 (appendix B, table B.2). Although the adjusted means control for the major background variables just discussed and, hence, reduce the sibsize differentials somewhat, the latter continue to be impressive. Table 2.3 compares the differences in the unadjusted and adjusted means for only children and those from families of seven or more; and for those from two-child families and those of four or more children. These results show that, even after adjustment, the difference for men between sibsize one and sibsize seven-plus is approximately 2 years of total education in relation to a grand mean of between 11 and 12 years, depending on the study. For women the corresponding difference is 1.5 to 1.8 years. In sum, with regard to total years of education alone, increases in number of siblings exert powerful downward pressure on schooling, and, as we have seen, coming from a large family is very common in the samples studied here. The large family disadvantage is perhaps best appreciated when compared to other handicaps we are more accustomed to considering. For example, even after taking account of family socioeconomic status, a white adult male in the mid-1970s from sibsize seven-plus was as disadvantaged educationally compared with sibsize one or two as a black male compared to a white one taking account of no other differences between them.
In the next section, we will see that the sibsize difference in total years of education tells only a small part of the story, since number of siblings affects the process of education in significant ways.
Sibsize and the Educational Process
At what point, or points, in the process of acquiring an education does sibsize intervene most importantly? Because of free schooling and compulsory education in the United States, one might think that the dilution of family resources resulting from many children would make little difference to educational attainment through high school but that, after high school, sibsize would be a major determinant of who would go to college. Actually, our results are quite different from commonsense expectations. Sibsize has a major
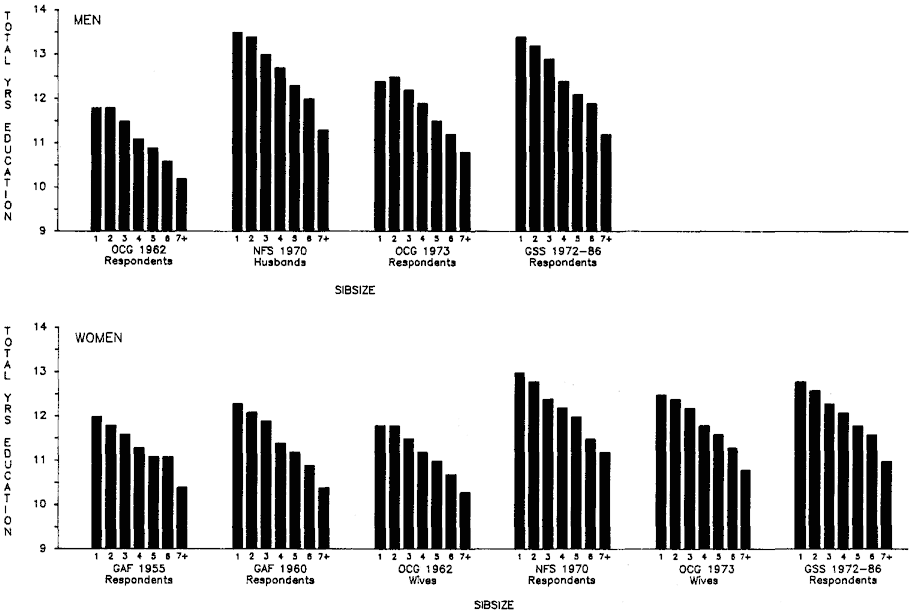
Figure 2.2.
Total Years of Education (Adjusted Means) by Sibsize, White Men
and Women Age 25 and Over, Various Surveys.
effect on educational attainment even during graded schooling (grades 1 through 12). In fact, as we shall see, in most studies attainment is more highly correlated with sibsize at the graded level of schooling than at the postsecondary level.
Consequently, another aspect of the importance of sibsize for educational attainment is that it has exerted its effects early in the schooling process. It has operated to select out a high proportion of students prior to high school graduation, thereby cutting them off from further academic advancement. This finding suggests that sibsize operates not simply by diluting parental economic resources for postsecondary schooling, but by impinging on basic education at the graded level in a manner that includes both economic and noneconomic effects.[2]
Years of Graded Schooling
Figure 2.3 shows, for all of the adult studies, the adjusted means for total years of graded schooling by sibsize (see also appendix table B.3). As between sibsize one and sibsize seven-plus, it is typical for respondents to have lost about a year or more of graded schooling even after taking account of family background. In judging the importance of such a deficit (all other factors in our analysis controlled), we must bear in mind that the loss of a year of graded schooling inevitably translates into large proportionate decrements in high school graduation. Hence, the loss of a year of graded schooling, on average, can be judged as very significant because of the great marginal importance of completing the last year of high school. We shall consider this next.
Proportions Graduating from High School
Figure 2.4 shows the adjusted percentages graduating from high school according to sibsize (see also appendix B, table B.4). Despite the theoretical importance of the background variables for which we have adjusted, it is clear that the sibsize differences in high school graduation remain large. Singleton boys are nearly half again as likely to graduate from high school as boys from families of seven children or more, and singleton girls are about half again as likely to do so as girls from families of seven children or more.
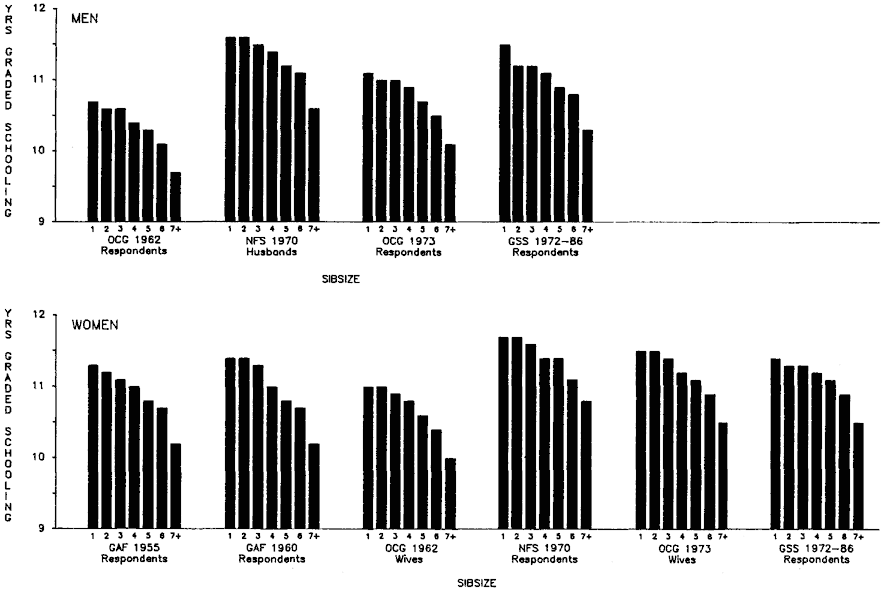
Figure 2.3.
Years of Graded Schooling (Adjusted Means) by Sibsize,
White Men and Women Age 20 and Over, Various Surveys.
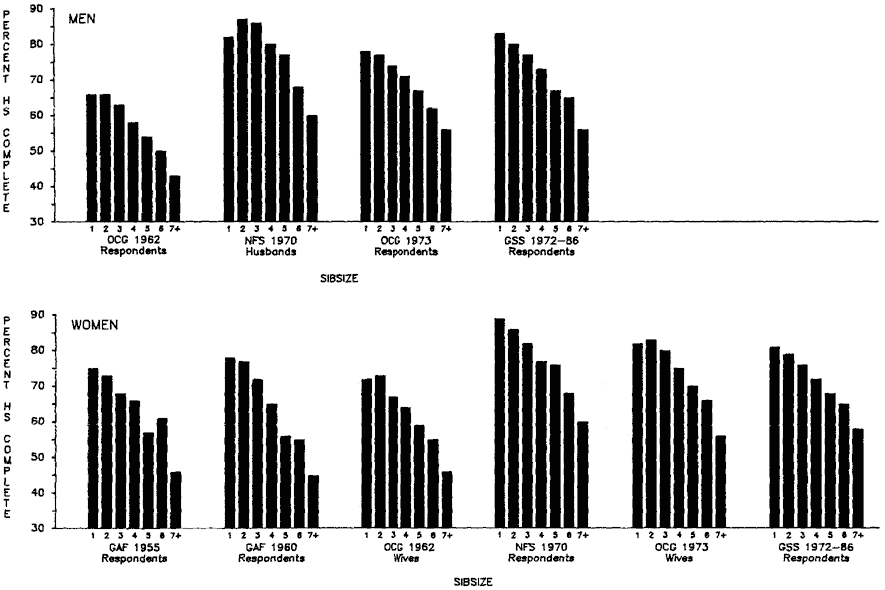
Figure 2.4.
Percentage Who Graduated from High School (Adjusted Means) by
Sibsize, White Men and Women Age 20 and Over, Various Surveys.
| |||||||||||||||||||||||||||||||||||||||||||||||||||||||||||||||||||||||||||||||||||||
The percentage point differences in high school graduation between sibsize one and sibsize seven-plus, and between sibsize two and sibsize four-plus, are summarized in table 2.4.
These data thus strongly reinforce the finding that total educational differentials by sibsize do not simply reflect relative advantage and disadvantage after high school graduation. Even in the graded schooling years, and with major parental background variables controlled, increasing sibsize has deleterious consequences for educational attainment.
In a later chapter we will document in detail the intense and early school dropout levels of men from large families. If the precocity of this school leaving seems strange to some readers, they should refer to an article by Suter that deals with part of the process by which such early school leaving comes about (Suter 1980). As Suter makes clear, the major reason historically so many men in the United States did not finish high school was because they fell behind (were "left back") early on—often in grade school. Even after the advent of compulsory schooling to ages 15–16 (depending on the state), such men did not simply drop out of high school, they dropped out of lower grades in which they had remained until the school-leaving age came around.
Postsecondary Education
Among the selected population of high school graduates, we see in figure 2.5 (and appendix B, table B.5) that attendance at college (percentage of high school graduates who went to college) is also influenced by sibsize (background factors controlled). Interestingly, however, among large sibsizes in particular (sibsizes six versus seven-plus), there is less difference than there is for proportions graduating from high school. This suggests that, among these large sibsizes, the high school selection left a population of "survivors" who had about equal chances of getting to college—in effect, that the differences in life chances between being from a six-child or a seven-plus–child family had already been taken into account at the high school level. We may also note that female-only children appear to be uniformly advantaged relative to females from other sibsizes in all of the surveys when it comes to going to college. This advantage does not persist, however, for years of college schooling (fig. 2.6).
If people have managed to enter college, does sibsize affect the number of years of college schooling they have been able to achieve? Figure 2.6 (appendix B, table B.6), for respondents and their wives in OCG 1962 and 1973, shows that the effects of sibsize are relatively small for this select group. That these effects exist at all, given the process of prior selection by sibsize that we have witnessed, is quite remarkable.
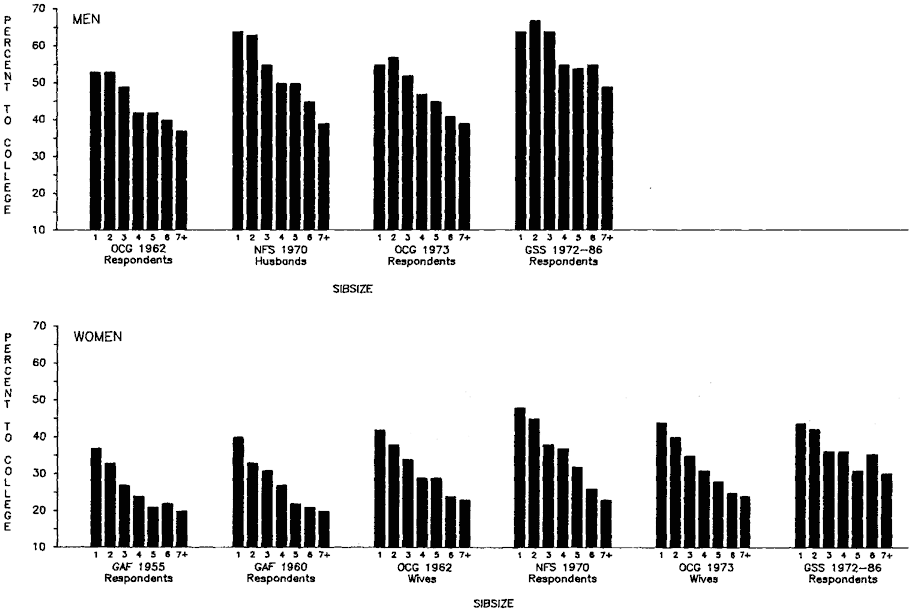
Figure 2.5.
Percentage of High School Graduates Who Went to College (Adjusted Means)
by Sibsize, White Men and Women Age 25 and Over, Various Surveys.
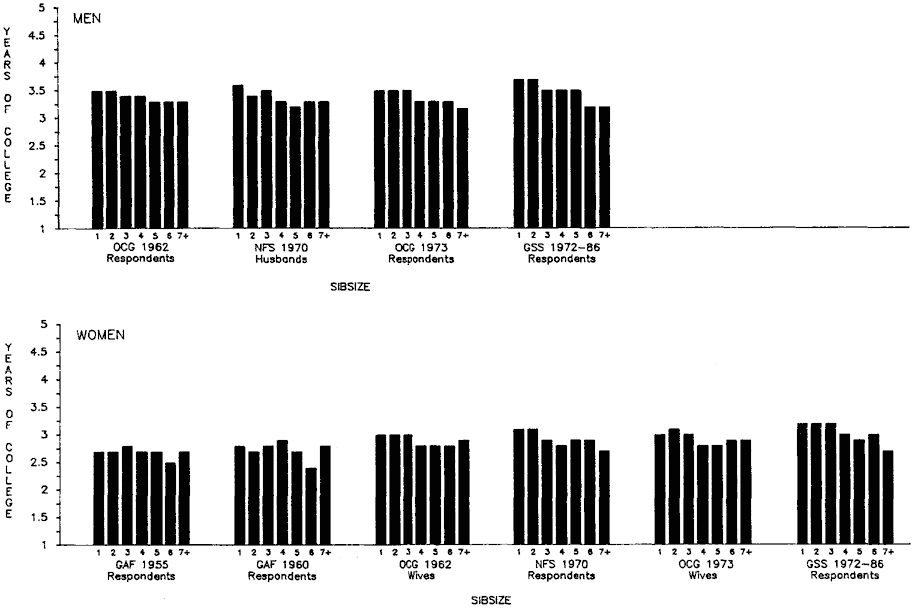
Figure 2.6.
Years of College Schooling among Those Who Went to College (Adjusted Means)
by Sibsize, White Men and Women Age 25 and Over, Various Surveys.
| ||||||||||||||||||||||||||||||||||||||||||||||||||||||||||||||||||||||||||||||||||||||||||
The Relative Effects of Sibsize on Graded and Secondary Education
Our results so far, using multiple classification analysis, suggest that as the level of schooling rises the effect of number of siblings decreases. The truth of this is most succinctly exemplified by the unstandardized regression coefficients (slopes) for sibsize at each educational level. These are shown in table 2.5. From this table we see that the effect of sibsize diminishes with each level of schooling, the greatest effect being at the graded-schooling level. We have suggested that the selection against large families that occurs so early in the educational process is probably due to two factors: (1) outright school leaving (dropping out) among those from large families, and (2) being "left back" in high proportions among those from large families until dropping-out occurs at a legally permissible age. Here we may note for the first but not the last time, that this selection has important methodological implications for all research on the "effects" of number of siblings among juniors and seniors in high school, or among college populations. Such populations will have been already strongly selected by number of siblings at an earlier stage in the educational process.
The Importance of Sibsize Relative to Other Family Background Variables
In our introductory chapter, we pointed out that the effects of sibsize, relative to the effects of other family background variables, have tended to be understated by students of social stratification, who investigate the consequences of family background for educational opportunity.
One reason for investigators' underestimating the relative importance of number of siblings is that the influence of this variable is often incorporated into the overall influence of family background or "home" effects (so-called ascriptive influences) versus the respondent's own characteristics and performance (viewed as meritocratic). Thus absorbed into family background, number of siblings serves to overestimate the importance of parental "SES" and turn attention away from sibsize as an independent influence. For example, the following quotation from Alexander and Eckland is fairly typical of discussion of even those studies that have specifi-
cally included number of siblings as a predictor (Alexander and Eckland 1980, 34).
More recent research, in revealing the range of advantages and liabilities conferred by the family of origin, serves only to broaden and deepen our appreciation of the residue of ascription in the supposed meritocracy (Blau and Duncan, 1967; Duncan, Featherman and Duncan, 1972; Hauser and Featherman, 1977).
To what is this persistent importance of the family attributed? Largely, it appears, to the simple fact that children from high SES families tend to go further through school than their low SES counterparts, and hence reap the labor market benefits that advanced schooling accrues.
A second reason for underestimating the relative importance of number of siblings to an individual's attainment is that models of status attainment (including those used here) treat parental SES as exogenous—in no way influenced by parental reproductive behavior. Yet parental educational attainment and occupational achievement are not independent of parental age at marriage and childbearing, including number of children. Hence, to the extent that parental SES is itself influenced by numbers of children, the effect of the respondent's sibsize on measures of parents' education and occupation is not counted.
Additionally, insofar as investigators have studied the educational process among high school students (for example, the high school seniors in the Wisconsin Study, Sewell and Hauser 1980, or the National Longitudinal Study of the High School Senior Class of 1972, Eckland and Alexander 1980), the importance of number of siblings to postsecondary educational goals and attainment will appear relatively small (compared to other variables) because of the selection process by sibsize that has already taken place. Many youngsters from large families have already dropped out (or been held back) leaving a selected group of survivors from these families, whereas those from small families are less selected.
Finally, as a number of critics of the sociology of status attainment have noted (Spaeth 1976; Williams 1976; Scarr and Weinberg 1978), parental socioeconomic status is itself, in part, the translation of parental ability into socioeconomic currency. Were it possible to control for parental ability, the effect of parental SES on the
son's achievement would probably be less and an additional effect of the parental ability transmitted to the child would be added. This point, which is increasingly being addressed by economists and sociologists (see, for example, Eckland 1967; Griliches 1970; Bowles 1972; Griliches and Mason 1972; Bowles and Gintis 1974; Bowles and Nelson 1974; Taubman and Wales 1974; Welch 1974; Griffin 1976; Hauser and Daymont 1977), will be discussed in more detail in chapter 4 on number of siblings and intelligence.
Here we will examine the relative effects of sibsize and other background variables for the adults in some of our samples. Table 2.6 shows, for OCG 1962 and 1973 as well as GSS 1972–1986, the standardized regression coefficients of the principal variables in our model for each level of the respondent's educational attainment. Standardized regression coefficients express the value of variables on the same scale so that their relative importance can be judged. The reader should be reminded that data on the father's education for the wives of the men in the 1962 OCG study are not available, and for these calculations we have made the two OCG studies comparable. To our knowledge, this is the first time that the standardized coefficients for disaggregated amounts of education (using the basic educational attainment model for adults) have been presented.
Among the variables in the model, all the surveys show (table 2.6) that the father's education is the most important influence on the son's total educational attainment. In this regard, the following quotation from Hauser and Featherman's analysis of total educational attainment in the two OCG studies is worth noting (1976, 105):
We have not shown any standardized regression coefficients; some readers may be interested to know that in virtually every subpopulation we have looked at, father's education is relatively more important than any other background variable.
In both OCG 1973 and GSS 1972–1986, sibsize is second in importance and outweighs, in negative effect, the positive effect of the father's SEI (the third most important influence). In OCG 1962, sibsize is close to the father's SEI and probably would also exceed it in this study as well were it not for the anomalously high SEI (see, Hauser and Featherman 1976, 104).
| ||||||||||||||||||||||||||||||||||||||||||||||||||||||||||||||||||||||||||||||||||||||||||||||||||||||||||||||
| |||||||||||||||||||||||||||||||||||||||||||||||||||||||||||||||||||||||||||||||||||||||||||||||||||||||||
Turning to the relative status of the variables in the disaggregated process of education, we find some interesting results. Among the educational levels, the relative influence of the father's education and sibsize is greatest for graded schooling, whereas the father's SEI is unimportant at this level. This finding might suggest that, given free schooling, whether the grades are completed depends more on the value placed on education by the parents and the child's ability (both native and as a consequence of socialization in the home) than on socioeconomic factors. However, the dilution of material resources is represented by sibsize at this level of schooling as is the corresponding ability of parents to sustain the direct and indirect costs of early schooling. How much the sibsize variable operates by influencing IQ and grades, and how much by influencing the direct and indirect costs of maintaining offspring in school, cannot be measured in these adult samples, since data are not available on either IQ or school performance. In later chapters, we shall see, however, that among samples of youngsters, the effects of sibsize on IQ are substantial, especially among samples of very young children. Hence, one can speculate that the early drop-out rate among men from large families was not due entirely to the diluting effect of sibsize on material resources but was due as well to sibsize effects on IQ, and the influence of the latter on school performance. It should be noted also that men whose fathers were farmers (farm background in the equations) experienced some relatively important negative effects at the graded-schooling level. Thus, although in general the father's occupational status was unimportant for graded schooling, having a father who was a farmer was a disadvantage.
Once a boy graduates from high school, table 2.6 shows that college attendance and years in college depend more on the father's SEI than on either his education or sibsize. By the college-going level, there are a number of reasons why father's SEI should move up in relative importance. One reason is that there has been a drastic selection out of school of children from larger families reducing, thereby, the relative importance of sibsize. Second, college involves not only indirect costs (the student's time and consequent loss of earnings) but usually substantial direct costs as well.
Among young women, although the father's education is not included for OCG 1962 and 1973, the patterns by educational level
of the other variables are, with two interesting exceptions, the same as for men. First, in all of the surveys, farm background has a fairly substantial positive relative effect on whether a high school graduate goes to college. This difference is evident in the unstandardized coefficients as well. We may speculate that this effect is due to the traditional emphasis in land-grant colleges on applied subjects, nursing, and school teaching. Second, the GSS 1972–1986 data, table 2.6, based on female respondents and including the father's education, suggest that whether a girl goes to college and stays in college is relatively more dependent on her father's education than on his SEI—a finding that is also evident in the unstandardized coefficients (table 2.5)—and one that is different from men. It is thus probable that increased education among fathers is important in influencing the value placed on advanced education for women.
The Effects of Number of Siblings by Age Cohorts
The overall effects of family background on education by detailed cohorts have been discussed by Hauser and Featherman (1976) and Featherman and Hauser (1978) using the OCG samples for all races. Their analyses have shown that the influence of men's family backgrounds on total years of educational attainment has diminished somewhat over time. As they say (p. 241):
As a block, the six aspects of social origin explain one-third of the variance (R2 = .33) in schooling among cohorts born prior to World War I, but the same factors account for about one-quarter of the variance among men born during and after World War II.
Featherman and Hauser also emphasized that the results for total years of education are a composite of offsetting trends in background effects for graded and college schooling respectively (Featherman and Hauser 1978, 244–245). As the authors point out:
Together, the five variables that denote social origins in Table 5.9 explain about 13% of the variance in graded schooling . . . for the younger cohort. . . . Among the oldest cohort . . . these variables account for 30% of the variance.
| ||||||||||||||||||||||||||||||||||||||||||||||||||||||||||||||||||||||||||||||||||||||||||||||||||||||||||||||||||||||||||||||||
In contrast to this trend, enrollment in college and continuation toward the college diploma show little systematic variation across cohorts in their association with social background. Where changes have occurred they have tended to increase the dependence of college attainment on social background. But in any case the association is modest at best, as given by the R2 values that range between .186 and .235 in the "college" equations.
In effect, the society has become more "open" as far as years of graded schooling are concerned but, for the greatly augmented proportions who were thereby at risk of going to college, family background has increased as an influence on men's chances of a postsecondary education.
For the white men and women in OCG 1962 and 1973, as well as in GSS 1972–1986, table 2.7 shows the marked decline in the explanatory value of the basic model as one goes from older to younger age groups in each study when graded schooling is taken as the dependent variable. By contrast, there is an increase in explained variance when college schooling is examined. For total years of education, the explained variance is thus simply a composite of these offsetting effects at the graded and college levels. How has number of siblings contributed to this differential explanatory power of the model over time?
In order to examine this question, the unstandardized regression coefficients (slopes) for each variable by age group are presented in table 2.8. In addition, in the parentheses next to each unstandardized coefficient, the variable's rank order has been given, as determined by the standardized coefficients in each equation. The reader is thus able to compare, across age groups, the changes in the unstandardized coefficients, at the same time that he is aware of the relative importance of each particular variable in each equation. For example, the table shows that the father's education is the most important variable for men's total and graded schooling in virtually all equations. It is also clear that the number of siblings is the second most important variable in most cases for total and graded schooling and that the father's SEI ranks third or fourth in importance. By contrast, when college schooling is one's focus, the father's SEI moves to first place, the father's education to second, and sibsize to third in almost all equations.
| ||||||||||||||||||||||||||||||||||||||||||||||||||||||||||||||||||||||||||||||||||||||||||||||||||||||||||||||||||||||||||||||||||||
| ||||||||||||||||||||||||||||||||||||||||||||||||||||||||||||||||||||||||||||||||||||||||||||||||||||||||||||||||||||||||||||||||||||||||||||||||
| ||||||||||||||||||||||||||||||||||||||||
Has the model's explanatory power declined for graded schooling because the effect of sibsize is less among younger than among older men? Not to judge from OCG 1962 and 1973 (table 2.8). In those studies, the effect (slope) of sibsize is virtually unchanged over the age groups, but the father's education, farm background, and SEI markedly lose explanatory power. In the GSS 1972–1986, sibsize also loses explanatory power over time, but the loss is not as great proportionately as is experienced by the other variables in the model. Hence, with regard to graded schooling for men, it appears that the main reason family background factors have explained less variability in men's graded schooling (as between younger and older men) is because of a decline in the explanatory power of father's education, farm background, and father's SEI, not because of a decline in the explanatory importance of number of siblings.
Turning to college schooling (table 2.8), the increases in the explanatory power of the model over time seen in table 2.7 reflect proportionate increases in the coefficients for number of siblings and father's education, as well as some increases in the effects of other variables. Because of the rising influence of sibsize over time at the college level, and the maintenance of influence at the graded level, the power of sibsize to explain total years of education seems to have increased rather than decreased over time. Put in substantive terms, comparing younger with older respondents large families have been a continuing drag on the society's ability to reduce
family background effects on educational attainment at the graded-schooling level, and an increasing drag on our ability to reduce the influence of background factors at the college level. Even when society provided the resources increasingly to overcome a dependency on the father's background (education and occupational status), the reproductive choices that these respondents' parents made continued to exert an influence at the graded-schooling level.
Among women, the variance in total years of education explained by the model shows little sign of decreasing over the ages represented in the three studies considered here (table 2.7). Indeed, in the two OCGs the younger cohorts of women appear to be more bound by family factors than the oldest cohort. The time trend in total years of education is a result of the changes in the graded level and the college level as with men. At the graded level, the decline in the explanatory power of the model as between younger and older women is relatively modest in the OCGs, although more marked in GSS. At the college level, the model greatly increases in explanatory power; in the GSS 274 percent, in OCG 1973, 190 percent, and in OCG 1962, 174 percent. Which variables contributed most to the influence of the model on women's education chances over time?
Table 2.9 is identical to table 2.8 for men. For graded education in the OCG data, we may assume that the father's SEI is a good proxy for the father's education. Clearly, there is a marked proportionate reduction in SEI effects and father's-education effects (see the General Social Surveys, 1972–1986) on graded education over time. However, the proportionate reduction in the sibsize effect is generally less than for the other variables from older to younger age groups. At the college level, there are substantial increases in the effect of sibsize from the oldest to the youngest ages, suggesting that the increasing numbers of women from large families who complete high school have resulted in greater blockage at the next level of education if the young woman has many siblings.
A Sex/Sibsize Interation?
In considering the question of whether sibsize makes more difference for men than women when it comes to educational attainment, it is possible to think of two conflicting hypotheses. One could argue that girls may be at a particular disadvantage in large families
| ||||||||||||||||||||||||||||||||||||||||||||||||||||||||||||||||||||||||||||||||||||||||||||||||||||||||||||||||||||||||||||||||||||
| ||||||||||||||||||||||||||||||||||||||||||||||||||||||||||||||||||||||||||||||||||||||||||||||||||||||||||||||||||||||||||||||||||||||||||||
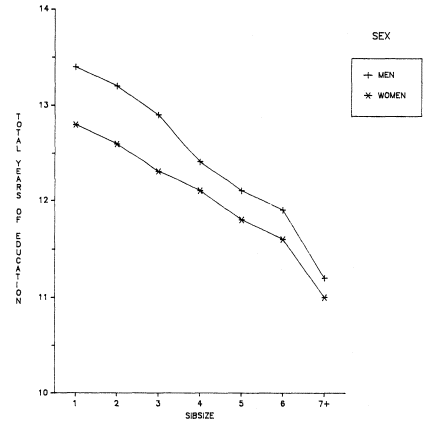
Figure 2.7.
Total Years of Education (Adjusted Means) by Sibsize and Sex, White
Men and Women, Age 25 and Over, General Social Surveys, 1972–1986.
where there will normally be some boys, and that in small families girls should fare approximately equally with boys. By this argument, sibsize might be more important for girls than for boys. However, it seems equally plausible that women's educational disadvantages have not inhered primarily in the dilution of parental resources but in a definition of sex roles that puts marriage and childbearing as the focus of girls' upbringing. By this reasoning one would expect sibsize to be less important for women than for men because of what might be called a "feminine override." Even if
families are very small, girls will not, on average, have been reared like boys, and if families are very large the consequent relative disadvantage for girls will be less than for boys.
The regression coefficients in table 2.5 for the General Social Surveys, 1972–1986, allow us to begin to examine these hypotheses. The OCG data in the table are not useful for this purpose since the women in those samples are the wives of the male respondents and, hence, any comparison by sex is contaminated by the high probability that men and women with similar characteristics will marry. Table 2.5 suggests that the sibsize coefficients for women are somewhat lower at each level of education. Indeed, the results in figure 2.7 (also see appendix B, table B.2) imply that the relative positions of men and women who come from large families in the GSS 1972–1986 are closer in total years of schooling than the positions of men and women from small families. In effect, men seem to gain disproportionately out of coming from small families. We may thus entertain the hypothesis that there is a feminine role "override" that does not predispose parents of small families to encourage girls to attain (or the girls to seek) an educational advantage similar to that enjoyed by boys in the same situation. We shall return to this idea in chapter 6.
Conclusion
In this chapter, we have analyzed the effects of number of siblings on total years of education, years of graded schooling, proportions graduating from high school, proportions of high school graduates going to college, and years of college schooling. Even after controlling for family background variables, we have found differences by sibsize in level of total education that rival simple bivariate educational differences by race and age. Those from large versus small families lose about a year of graded schooling on average, which translates into large differences in proportions graduating from high school. Hence, although it seems logical to think that the deleterious effect of large families centers on chances for postsecondary education, the actual fact is that the greatest impact is early in people's schooling—in the grades. Since, as we shall see, there are marked negative effects on IQ of increasing sibsize, it is possible that IQ, as well as the dilution of material resources among many children, affects the drop-out rates among those from large families.
Sibsize influences college attendance much less than it influences graded schooling. We believe that this finding reflects the biases introduced by the high drop-out rates among those from large families at the graded-schooling level. Those children from large families who have made it through high school are a sample of survivors. They are quite probably highly selected for IQ, motivation, performance, and whatever other factors contribute to college attendance.
If sibsize is important as a predictor of educational attainment, how does its importance rank relative to that of our predictors in the family background model? For total years of education and years of graded schooling, the father's education ranks first and sibsize second. The father's SEI ranks third for total years, but it is unimportant for graded schooling. By contrast, college schooling depends more on the father's SEI than on his education or on sibsize. These results may be surprising for some students of educational mobility, since there has been a tendency to lump sibsize along with parents' education and father's occupation under the category "socioeconomic background," and to assume, thereby, more importance for socioeconomic effects in the "macro" sense than seems justified. As we shall discuss, it is one thing to look at socioeconomic effects controlling for sibsize, and another to aggregate a major predictor like sibsize into the overall effects of socioeconomic status.
In their analysis of educational opportunity by age cohorts, Featherman and Hauser found that the society was somewhat more open for younger than for older cohorts when total years of education were under consideration. But this overall finding was actually a result of offsetting influences of family background for graded and college schooling respectively—graded had become more egalitarian and college more ascriptive. Here we asked how number of siblings contributed to these trends in the explanatory power of the whole model. We found that the declining power of the model to explain graded schooling was, in general, not due to declining effects of sibsize but to declining effects of the other variables. And, with regard to college schooling, the influence of sibsize increased over the age cohorts along with father's education. Thus, we find that large families have been a continuing drag on the society's effort to provide openness in graded schooling, and an increasing drag on our ability to provide equal opportunity at the college level.