Results
Age-specific Survival
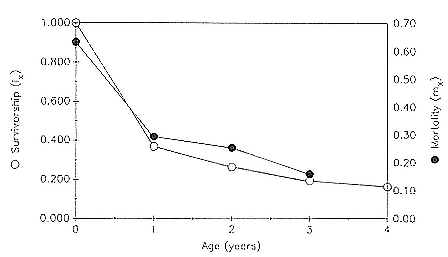
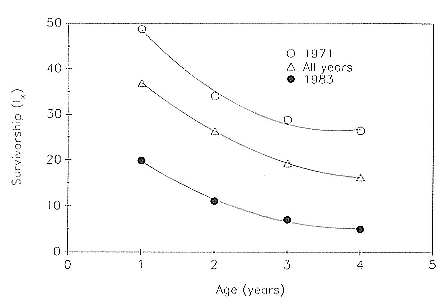
Of the pups born during the years 1971–1988, the mean percentage that survived to age 1 was 36.8 ± 8.5; to age 2, 26.3 ± 6.3; to age 3, 19.4 ± 5.1; and to age 4, 16.3 ± 5.2. These data are presented as partial life tables in table 7.1 and figure 7.1. Age-specific survival varied widely over the years, with the following range of values being observed: 19.9–48.7% to age 1; 11.1–37.4% to age 2; 7.1–28.9% to age 3; and 5.0–26.5% to age 4. Survival rates were highest for the year 1971 and lowest for the year 1983 (fig. 7.2).
Age-specific Mortality
Age-specific mortality for the entire sample was highest during the first year of life, 63.2%, and then dropped steadily until reaching a low of 16% between 3 and 4 years of age (table 7.1, fig. 7.1).
Mortality on the Rookery and at Sea during the First Year
Over the study period, a mean of 31.5 ± 12.4% of the first-year mortality was due to neonate death on the rookery; the majority of the first-year mortality occurred at sea. The proportion of first-year mortality occurring on the rookery reached a high of 61% of pups born in 1983 due to the rookery being inundated by storm-whipped high surf at high tide during the peak

Fig. 7.1
Survivorship (lx ) and mortality (mx ) curves for the northern elephant seal at
Año Nuevo, California, during the years 1971–1988. Based on data in table 7.1.

Fig. 7.2
Survivorship (lx ) curves for northern elephant seals from Año Nuevo, California,
during the best (1971) and worst (1983) years in the study period, 1971–1988,
and for all years combined.
pupping period (see also Le Boeuf and Condit 1983; Le Boeuf and Reiter 1991).
Survival Rates of Weanlings
For all years combined, the mean survival rate of weanlings over the periods at sea was 46.0 ± 7.7% (range = 35.0%–61.1%) to age 1; 32.8 ± 5.9% (range = 21.6–44.5%) to age 2; 24.2 ± 5.5% (range = 13.8–33.8%) to 3; and 20.3 ± 5.8% (range = 9.8–30.9%) to age 4.
The Effect of Year and Associated Conditions
The role of a specific year and associated conditions, such as weather and prey availability, is reflected by the annual survival rates of 1-, 2-, 3- and 4-year-olds in that year. For example, in 1981, survival to age 1 was 42.5 ± 4%; the survival rate of the 1980 cohort from age 1 to 2 during 1981 was 91.9%; the 1979 cohort survival from age 2 to 3 in 1981 was 96.0%; and the 1978 cohort survival from age 3 to 4 in 1981 was 97.5%, giving 1981 a mean score of 82.0%.
Calculated in this way, the mean score of all cohorts was 79.1 ± 3.6%. There were three years with mean scores one standard deviation or more above the mean, an indication that they were exceptionally good years: 1974 (84.6%), 1985 (83.3%), and 1980 (82.6%). There were three poor years: 1983 (72.7%), 1986 (74.0%), and 1978 (76.0%). All three poor years are categorized as El Niño years by oceanographers.
Cohort Variation
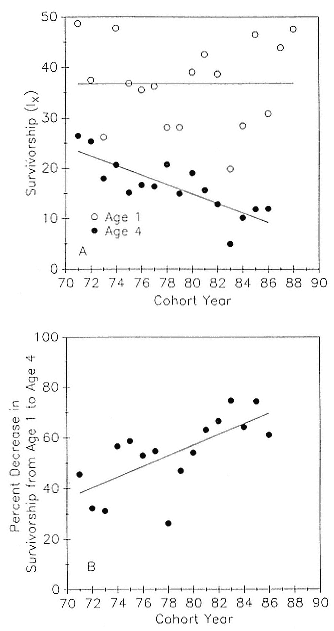
As the size of the Año Nuevo colony increased more than fivefold from 1971 to 1988 (an increase similar to that of the entire population; see Stewart et al., this volume), one might expect lower survivorship values in the later years due to increased competition for resources either on the rookery or on the foraging grounds. Pup mortality on the island prior to weaning increased from a low of 14.5% of pups born in 1971 to a high of 70% of pups born in 1983; preweaning pup mortality is density dependent, and there is a significant interaction with weather (Le Boeuf and Briggs 1977; Le Boeuf and Reiter 1991). There was no tendency for survivorship to age 1 to decrease with time and increasing density (fig. 7.3a); however, survivorship to age 4 decreased with time (the regression of y on x = 90.1 – 0.94x; r = 0.81).
An indication of the relative long-term strength of a cohort is the percentage decrease in the juvenile survival rate from year 1 to year 4. The percent decrease in survivorship from age 1 to age 4 increased over the study period (fig. 7.3b); that is, the mortality rate over the juvenile years increased with time.
The mean percentage decrease in survivorship from age 1 to 4 (fig. 7.3b)

Fig. 7.3
(A) Survivorship to age 1 (open circles) and to age 4 (closed
circles) as a function of cohort year. The regression equation
for the latter is y = 90.1 – 0.94x; r = .81. (B) The percent
decrease in survivorship from age 1 to age 4 as a function
of cohort year. The regression equation is
y = –111 + 2.1x; r = .69.
for all 18 cohorts was –55.2 ± 14.1%. The three strongest cohorts, those with the lowest percentage decline over the three-year period, were 1978 (–26.2 ± 3%), 1973 (–31.3%), and 1972 (–32.3%). The three weakest cohorts were 1983 (–74.4%), 1985 (–74.4%), and 1988 (–66.9%).
The Effect of Weaning Mass, Size, and Condition on Age-specific Survival
Although the weight of weanlings varied greatly, with animals in the highest weight category being almost twice as large as those in the lowest weight category (fig. 7.4a), there was no significant relationship between mass at weaning and survival to 1 year of age (chi-square = 8.17, df = 8, p > .05) or to 2 years of age (chi-square = 6.83, df = 8, p > .05) (fig. 7.4b). Seals with the most common weights at weaning, in the range of 120 to 150 kg, had the lowest survivorship to year 1, 34.8 to 41.7%). However, these rates did not differ significantly from that of other weight categories. The extreme low and high weight categories incurred the greatest decline in survivorship from year 1 to year 2, but these differences, too, were not significantly different from the declines in other weight categories (chi-square = 8.53, df = 8, p > .05).
Survivorship to 1 year of age varied significantly as a function of standard length at weaning (chi-square = 12.9, df = 8, p < .05)—weanlings with the smallest standard lengths had the lowest survivorship—but this effect did not hold for survival to age 2 (fig. 7.5). Survivorship did not vary significantly with condition index.
Reasoning that high weight or great size might be advantageous in a poor year, we examined separately the year 1986, the only year in the weighed weanling sample that physical oceanographers categorize as an El Niño year. During El Niño years, foraging may be more difficult because of lower prey availability (Arntz, Pearcy, and Trillmich 1991). Using the same weight and length classes shown in figures 7.4 and 7.5, survivorship of the 1986 cohort did not vary significantly with any measure of condition.