Empirical Analysis of Birth-Order Differences in Educational Attainment
We have data on birth order and educational attainment for three major data sets—Occupational Changes in a Generation, 1962 and 1973, and the National Fertility Study, 1970. In the interest of space, we will not present our analysis of the National Fertility Study because it completely parallels the findings from the other two analyses. As mentioned above, we have controlled for parental background factors in the same way as for the analysis of birth order and intelligence. First we created residuals that are free of the effect of background factors, and then we ran analyses of variance (ANOVAs) of birth order (within sibsize) against the dependent variable.
Turning first to Occupational Changes in a Generation, 1973 (the largest data set having information on birth order), figure 5.12 plots the adjusted means by birth order within sibsize for total years of education, as well as percentages having at least a high school education. The figure suggests a number of important points. First, on the one hand, at small sibsizes the birth-order effects
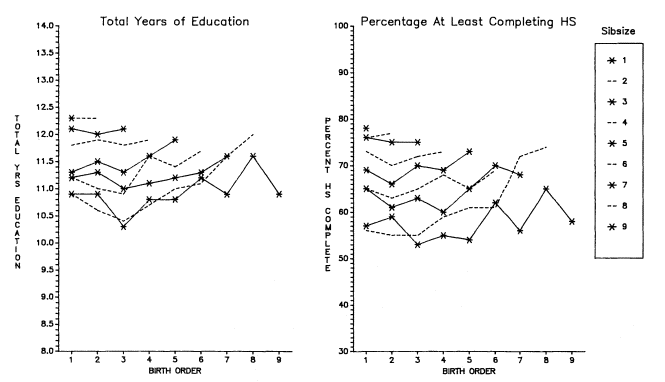
Figure 5.12.
Two-Stage Adjusted Total Years of Education and Adjusted Percentages Who Have
at Least a High School Education by Sibsize and Birth Order, White Men, OCG 1973.
appear negligible. Indeed, the ANOVAs indicate that, even given the very large numbers, the differences between any two birth orders in families of one to four children are not statistically significant. Second, and on the other hand, the shape of the birth-order distributions (even in small families) conforms to theoretical expectations—last-borns do better than middle-borns. Third, among large families, the parabola is very clear.[5] In fact, it is not unusual for last borns and next-to-last borns to do considerably better than firstborns. Consequently, if we fit a quadratic equation to the birth-order data within sibsize (among families of four or more siblings), we find a high correlation of birth order and educational attainment, see table 5.1.
The high correlation of birth order with total years of education and the position of later birth orders in large families suggests that, in such families, birth order can somewhat mitigate the effects of sibsize. For example, as may be seen from figure 5.12, last-born and next-to-last-born children in large families may do better educationally than children in somewhat smaller families. However, those from small families (one, two, and even three children) are obviously in a class apart. The particularly positive effect on youngest and next-to-youngest children in large families suggests that it is help from older siblings that makes a major difference, and not merely that older siblings may no longer be a drain. To achieve this last-child and next-to-last-child effect, the family size must be sufficiently large to give time for older siblings to be mature enough to help. It is probably also true that the parents in these very large families were traditional and familistic and, hence, enforced strong norms of family assistance by older children to younger ones.
This analysis also highlights the fact that we must specify the idea of the "middle" child more carefully than, for example, was the case in the Blau and Duncan (1967) analysis of the OCG 1962 data. In large families, it is not merely being "in the middle" that is detrimental, it is being in the middle at an early stage of parental family building. Actually, among large sibsizes in the OCG 1973 data, the third child is in the trough. Conditions begin to improve from fourth children onward, so that many later-born "middle" children do as well or better than firstborns.
One way of dramatizing the effect of differential birth order in
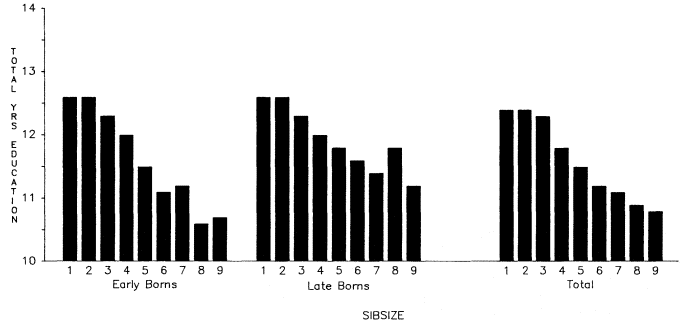
Figure 5.13.
Total Years of Education Achieved by Sibsize Contrasting Early and Late-Born Children, White Men Age 25
and Over, OCG 1973. (Early borns were computed by using the only child, two children and three children
and the first three children in each remaining sibsize. Late-borns were computed by using only children,
two children and three children, and the last two children born in each remaining sibsize.)
large families is to look at the sibsize relation to total years of education but, for sibsizes larger than three, to include only the first three birth orders. This tabulation may be contrasted with the sibsize tabulation including all birth orders, and with a tabulation of education by sibsize that includes only the two last-born children in each sibsize (fig. 5.13 presents all three tabulations). As may be seen from figure 5.13, the sibsize differential is widened if one considers only the first three children in each sibsize. If, however, one looks at only the last two children in each sibsize, the sibsize differential is mitigated. It is clear that the negative effects of large sibsize on educational attainment can be partially overcome if one is among the two last-born children.
Before proceeding to Occupational Changes in a Generation, 1962, we may ask whether the adjusting process changed the shape and position of the birth-order curves for OCG 1973. Looking at figures 5.14 and 5.15 for OCG 1973 (which contasts the unadjusted and adjusted findings) we see that it did. At the smaller family levels (four and under), the adjustment corrected for depressants to the status of the only child and reversed a downward tendency of values by birth order within sibsize. At the larger sizes of family, the adjustment sharpened the parabolic tendency, getting rid of some of the depressants to the upward movement of the curve.
Turning to OCG 1962, figures 5.16 and 5.17 summarize the same analysis on this data set that we did for OCG 1973. It is evident that the results of the 1973 analysis are replicated very closely. Moreover, in table 5.1, we again find that when a quadratic is fitted to the data for birth orders within larger families, a high correlation is achieved between birth order and total years of education within each sibsize.
Although our findings concerning birth order and educational attainment in OCG 1962 and 1973 accord with the more aggregated analysis for OCG 1962 by Blau and Duncan (1967), it is worth noting that Hauser and Sewell (1985) have found no birth-order effects on education in their analysis of the followup data for respondents who were Wisconsin high school seniors in 1957 (and in a derived sample of their siblings). When study designs differ radically, it is never easy to pinpoint the causes of differing results.[6] However, we may mention a few relevant points.
First, the Hauser and Sewell data originate from a sample of
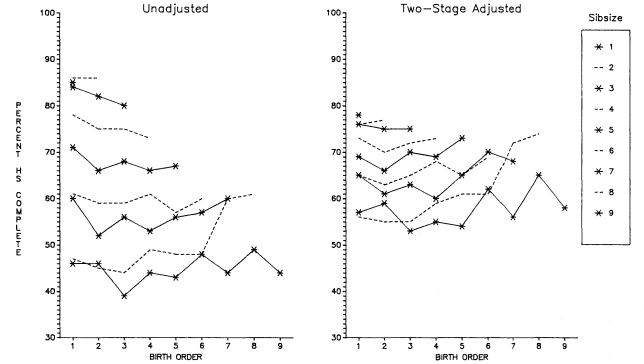
Figure 5.14.
Comparison of No Adjustment and Two-Stage Adjustment, Percentages Who Have at Least a
High School Education by Sibsize and Birth Order, White Men Age 20 and Over, OCG 1973.
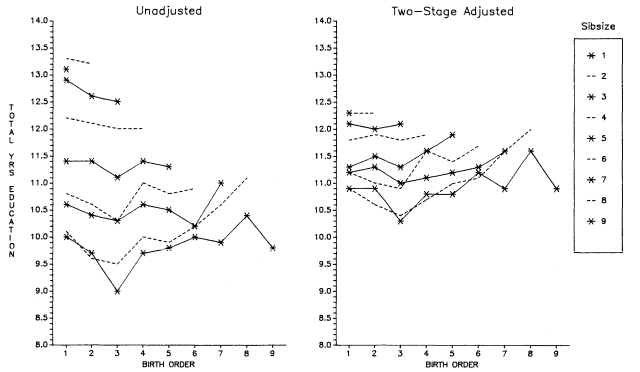
Figure 5.15.
Comparison of No Adjustment and Two-Stage Adjustment, Total Years of
Education by Sibsize and Birth Order, White Men Age 25 and Over, OCG 1973.
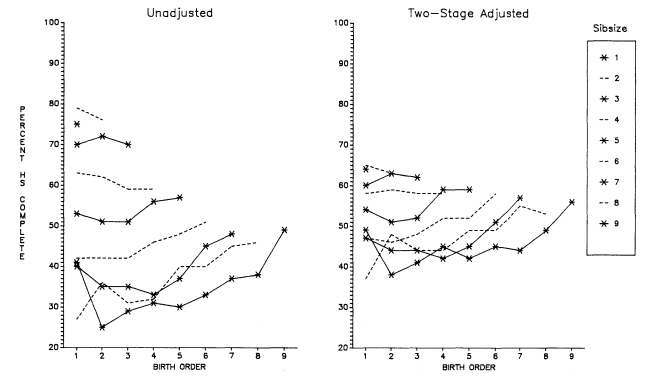
Figure 5.16.
Comparison of No Adjustment and Two-Stage Adjustment, Percentages Who Have at Least a
High School Education by Sibsize and Birth Order, White Men Age 20 and Over, OCG 1962.
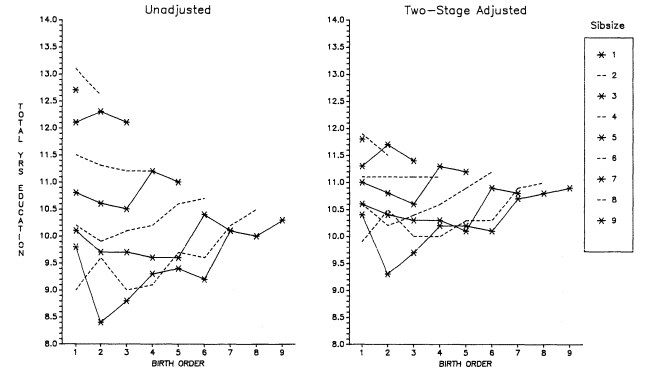
Figure 5.17.
Comparison of No Adjustment and Two-Stage Adjustment, Total Years of
Education by Sibsize and Birth Order, White Men Age 25 and Over, OCG 1962.
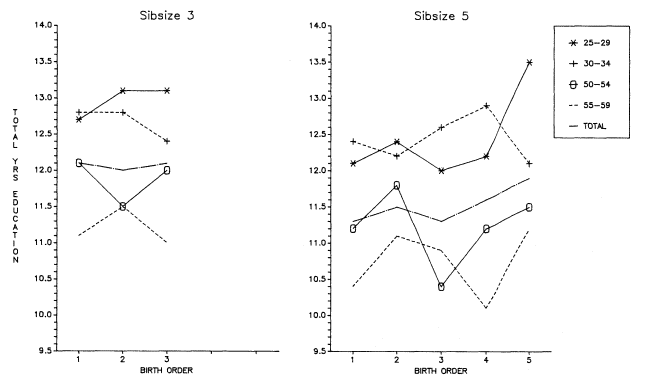
Figure 5.18.
Two-Stage Adjustment for Selected Cohorts, Total Years of Education, Sibsizes
Three and Five, by Birth Order, White Men Age 25 and Over, OCG 1973.
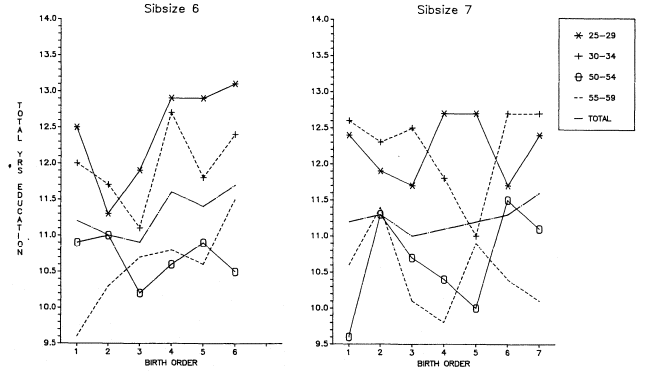
Figure 5.19.
Two-Stage Adjustment for Selected Cohorts, Total Years of Education, Sibsizes
Six and Seven by Birth Order, White Men Age 25 and Over, OCG 1973.
graduating seniors in 1957 whose sibsize is skewed toward small families because the respondents had already achieved high school graduation. As Hauser and Sewell (1985) state:
The combination of the facts that respondents tend to appear in low birth orders and are all high school graduates further confounds the interpretation of birth order effects on mean levels of schooling.
Second, in addition to the overall selectivity of the sample, the authors find a strong selectivity in large families of respondents' educational attainment in relation to that of their (nonrespondent) siblings. In effect, the high school graduates (the respondents) who came from large families were more different from their siblings than the high school graduates who came from small families. Further, as Hauser and Sewell point out, most of the siblings of the respondents were younger than the primary respondents (the high school graduates), many substantially so. In sum, the primary respondent who had achieved high school graduation was an older child in most cases, thus greatly limiting variability in educational attainment for earlier born children. By definition, most of them graduated from high school. Moreover, later-born children invariably had an older sibling who had achieved this status. Given these biases and anomalies in the basic data, it may be that they are not well suited to the study of birth-order effects on education.
Returning to our own analysis, as mentioned earlier, we expect period effects to be very important as confounders in the analysis of birth order and educational attainment, but our findings for the entire OCG samples have probably averaged out the period effects. However, supposing we had not been fortunate enough to have such a broad range of ages for analysis, would our results have been different? In effect, if we look at the same kinds of curves for separate age cohorts, what will we see? The answers are highly instructive concerning the importance of period effects for birth-order analysis.
Figure 5.18 (showing birth order by sibsize for sibsizes three and five disaggregated further by four age groups) illustrates the difficulties, due to period effects, of interpreting educational data on birth order by sibsize. Although the period effects appear to average out when a wide age range of subjects is considered, period effects
create marked differences in the curves when the latter are examined by cohort —in this case, those ages 25–29, 30–34, 50–54, and 55–59. It is tempting to interpret these cohort curves in relation to depressions, wars, economic booms, and the like. But such a level of specificity strains the data beyond their limits. At minimum for such an interpretation, one would want to use data by single years of age, but given the size of the sibsize–birth-order matrix, this requirement would transcend the resources of even a sample as large as OCG 1973. The complexity of the period effects is again illustrated in figure 5.19, which plots education by birth order for sibsizes six and seven among the four age groups. It is clear as well, that assumptions about spacing could introduce considerable bias into one's thinking, but some such assumptions would have to be made if one were to match up birth orders with periods in order to attempt to understand how the periods impinged on various points in the individual's educational cycle.
Do period effects undo the curvilinear relationship we have seen for large families? Figure 5.19 shows that the well-defined parabola for larger sibsizes that was evident when all age groups were averaged together is less clear-cut in age groups taken separately. However, the tendency for younger children to benefit at the expense of older children is obviously present in some (but not all) of the age-specific curves.
This consideration of separate age cohorts is thus a sobering check on interpretations of data that may be highly period-specific instead of spanning a broad range of periods as do both the OCG samples.
In sum, this analysis, which involves unusually adequate controls for family background and period effects, suggests that among large sibsizes the relation of birth order to the achievement of adults is curvilinear. A curve fitted to this parabola gives a high correlation of birth order with educational attainment after major background factors have been controlled. This correlation is evident in three major data sets, two of which are shown here. The correlation accords with a reasonable set of expectations regarding how educational attainment should be related to sibsize and birth order, and, hence, offers a fairly strong challenge to disproof.
The curvilinear relationship among birth orders in the largest families suggests that the youngest and next-to-youngest children
can benefit educationally by having many siblings and, as a consequence, frequently bring their performance up to levels comparable with those in four-child families (figs. 5.12, 5.16, and 5.17). However, this accomplishment is at the expense, as it were, of siblings at earlier birth orders who are left far behind in the educational race. Additionally, not even the youngest in large families can equal the educational performance of those in family sizes one through three.
Among birth orders in small families, statistically significant effects are not evident. However, controls for background factors serve to raise the values for only children relative to other birth orders and sibsizes.