Selection Effects
We have already seen, with regard to the only child (considered as a sibsize), that selection effects can be important in affecting the relative position of children from a particular sibsize. We have also seen that selection effects, such as when seniors in high school are studied, can influence relative sibsize standings on IQ tests or National Merit Scholarship Qualifying Test findings. This is because less able young people in large families are more likely to have dropped out of high school than less able young people in small ones, and this differential drop-out rate has biased the IQ—sibsize relationship. Now we must consider how selection can affect birth-order findings.
The reader should consider this discussion to be illustrative only, since there are probably as many selection effects as there are research designs.
Age-truncation Biases
The problem of age truncation (sampling a single age or a very restricted age group) occurs quite frequently in birth-order research on intelligence because young people are being sampled. For example, if one has sampled 11-year-olds, those who are the oldest and from large families must come from closely spaced families because all of the children in the sibsize must have been born during an 11-year period. The youngest 11-year-olds from large families have not necessarily come from such closely spaced sibsizes. Thus, it is not at all uncommon to find that, among youthful samples, there may be an upturn for later-born children in the dependent variable (say, in IQ), an upturn that cannot be interpreted out of hand as a birth-order effect. The upturn at later birth orders in IQ testing is a not-infrequent result among age-restricted samples of young people, as figures 5.3 through 5.5 illustrate.[2]
We should emphasize here that in general very wide spacing in large families (six or seven or more siblings) is not possible. For example, women beginning childbearing at age 20 and having a child every five years would be limited to five children even assuming that their last child was born when the woman was 40. It is thus not practical to think of wide spacing in families of six or seven or more as a generally compensatory mechanism allowing parents to provide more attention to each child—although obviously an individual child, or even two children, can be widely spaced in an
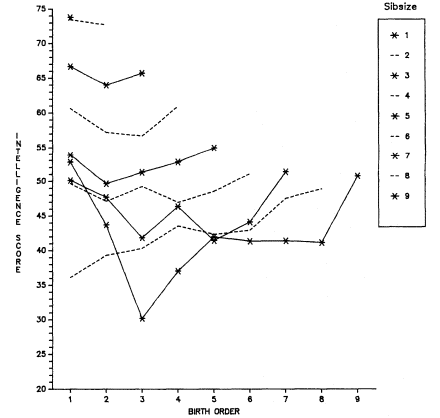
Figure 5.3.
T-Scores on Group Test of Intelligence by Sibsize and Birth Order
among Scottish School Children Age 11 in 1947. Data from the
Scottish Council for Research in Education (1949). Scores have been
restandardized with a mean of 50 and standard deviation of 10.
otherwise closely spaced family. Although extremes in spacing are uncommon, it would be desirable to know more about spacing in data sets such as we have been using because such information would provide an important test of the dilution hypothesis. Other things equal, we would expect widely spaced youngsters to have characteristics associated with smaller family size.
School-grade Attrition Biases
Just as youngsters from large sibsizes may be selected out of school at an early age, it is also not improbable that youngsters of particular birth orders may stay in school
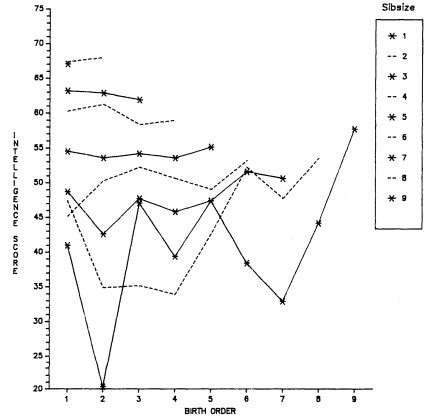
Figure 5.4.
T-Scores on Benedetto Test of Intelligence by Sibsize and Birth Order among
100,000 French School Children Age 6–14 in 1965. Data from Institut National
d'Etudes Demographiques (1973). Scores have been restandardized with
a mean of 50 and standard deviation of 10.
or drop out early, particularly in large families. For example, we shall see in a later section that, in large families, youngest and next-to-youngest children seem to stay in school the longest, whereas "early" middle-born children in such families (for example, third-born in families of six, seven, and eight or more) seem to be most deprived. It would appear, therefore, that sampling seniors in high school (and college students) for ability tests may well be selecting students from large families by birth order as well as by sibsize. Since last-born and later-born children appear to enjoy some economic advantages in large families (to be discussed), such
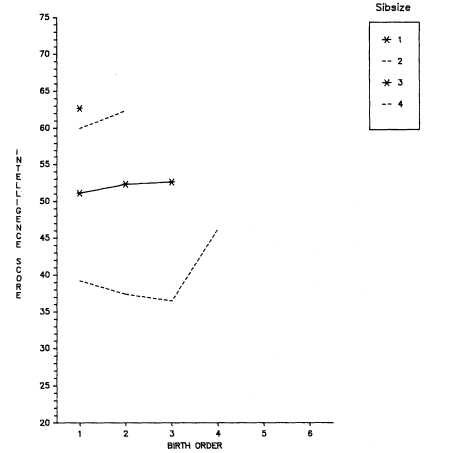
Figure 5.5.
T-Scores on Moray House Picture Test by Sibsize and Birth Order among
9523 Aberdeen School Children Age 7 in 1962. Data from Illsley (1967).
Scores have been restandardized with a mean of 50 and standard deviation of 10.
children may be less selected intellectually, other things equal, than earlier-born children in large families and, hence, on this count test less well as high school seniors (or college students) than youngsters from large families of other birth orders.
Other Selection Biases
The difficulty of distinguishing selection effects from birth-order effects is again illustrated from the Belmont and Marolla data on 19-year-old Dutchmen. As may be seen in
figure 5.1, not only do the results by birth order decline within each sibsize, but the last-born child in each sibsize takes a particularly sharp drop. The acute drop for each last-born child is quite different from the curves by birth order in any other data (figs. 5.2 through 5.5). It seems highly probable that this systematic drop in scores for all last-born children is related to the effects of the catastrophic famine in Holland during 1944 and 1945 (Smith 1947a and 1947b ; Stein and others 1972 and 1975; Blake 1981a ). In brief, since the famine drastically affected fertility, fetal mortality, and infant deaths, being an only child or other last-born child was a status that would occur selectively in those families worst hit by the famine (those families in which the woman could not become pregnant or stay pregnant to term or in which a next-born child would die). Moreover, since the adult death rate rose as well, many only and last-born children who were born during the 1944–1947 period, were partially or completely orphaned by the famine and, hence, remained "last-born." Again, on average this adult mortality would occur in those families worst affected by the famine. Since severe starvation in childhood is known to affect intellectual functioning adversely, it is hardly surprising that only and other last-born children in the Dutch data evidence an unexpectedly sharp drop in performance on the Raven Progressive Matrices test. The sharp drop among youngest children in the Dutch data led Zajonc (1976) to speculate that it was occasioned by a "teaching deficit." According to Zajonc, youngest children lagged intellectually because they (along with only children) had no siblings to whom they could act as mentors. In fact, I think it can be shown that this acute effect in the Dutch data is due to selection bias and that it is inadvisable to construct ad hoc substantive explanations for it.
To summarize our discussion so far, we have seen that theoretical expectations for birth-order differences in ability are weak and conflicting. We have no systematic, clear-cut reasons for expecting such effects. Moreover, when birth-order effects are found in empirical data, we have suggested that such effects are probably a consequence of one or more confounders—that the interpretation of effects as due to birth order may well be spurious. Different confounders will produce different "effects," and it is, therefore, hardly surprising that birth-order curves are so varied and difficult to interpret.
Before turning to our own empirical analysis of whether there
are birth-order differences in cognitive ability, we will consider in some detail the use, by Zajonc, of birth-order data to interpret the trend in SAT scores in the United States.