Results and Discussion
Radio telemetry tracking allowed positive identification of subjects and their location (fix precision: 

No subject was observed to scratch, pull, or otherwise react to the telemetry collar once it was attached. Upon release subjects seemed to have little difficulty negotiating dense vegetation; after recapture several months later no skin chafing was evident. Based upon these observations it was assumed that the telemetry collar had little or no effect upon the subject wearing it.
Temporal Behavior
Statistical independence of subject circadian activity was tested by contingency analysis (Ostel 1963; Adler and Roessler 1972). No substantial evidence was found to suggest that subjects exhibited different circadian activity probabilities, and male:female activity probabilities did not significantly differ (p = 0.05).
The apparent similarity of subject activity probabilities was used to justify lumping all fox data. This in turn provided a larger sample for statistical inference. The pooled data were examined by testing a series of hypotheses. The first assumed the probability of activity to be random with respect to time; that is, the probability of activity equals the probability of inactivity for any given hour. Chi square analysis resulted in the rejection of this hypothesis (p = 0.05) for 19 hours of the day (fig. 3). The five hours where activity was random were the first, second, and sixth hours after sunrise, the first hour prior to sunset, and the seventh hour after sunset. Failure to reject the null hypothesis for the seventh hour after sunset was considered to be due to an inadequate sample (n = 2). Three of the four remaining one-hour intervals appeared random because these intermediate periods occurred while significant increases or decreases (p = 0.001) in activity states were in progress. The remaining period, six hours after sunrise, could not be explained on the basis of these data.
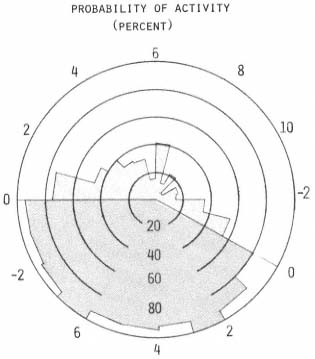
Figure 3.
The probability of activity [(active fixes/total fixes)
x 100] is shown for each hour. Hourly polar divisions
relate either to sunrise or sunset. The diurnal period
is shaded lightly with respect to the nocturnal period.
In general, it appeared that gray fox activity periods occurred in non-random fashion, foxes being significantly (p = 0.001) less active during diurnal periods than nocturnal. Statistically significant changes (p = 0.01) in activity appeared during the first two hours after sunrise and the first and third hours prior to sunset. Minimum activity observed was during mid-afternoon, which was significantly less (p = 0.001) than that observed in late morning.
Gray fox activity probabilities seem to be similar to those observed by Storm (1965) for five red foxes (Vulpes fulva ) in Illinois. Storm stated that the daily journeys began as early as two hours before the night and usually continued throughout most of the night; sometimes they continued as late as four hours after dawn. Rymills (1979) found that gray fox activity at Point Reyes National Seashore, California, generally began just before dark and continued until dawn.
Travel Rates
An animal's rate of movement probably depends upon many factors, such as its activity, travel conditions, the weather, and presence of other animals (Sanderson 1966). Since the mean rates, computed for each hour, were influenced greatly when extremes were encountered, no statistical inference was made. However, several interesting trends were apparent. Rates were relatively constant during diurnal periods and considerably lower than nocturnal values (fig. 4). This suggests that the type of activity occurring during diurnal periods was similar for each hour, regardless of activity probability. In contrast, nocturnal rates averaged about twice the diurnal values and exhibited two peak periods, while activity probabilities remained consistently above 80%.
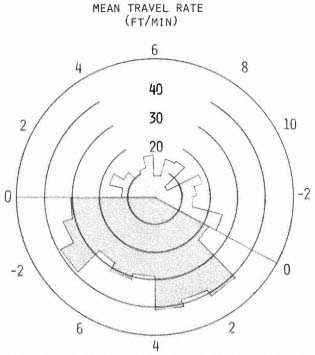
Figure 4.
The mean travel rate in feet per minute
was calculated for each hour. See figure
3 for description of polar graph.
Rate Indices
Neither activity probabilities nor mean travel rates seemed to reflect properly the intuitive impression of gray fox temporal movement developed while monitoring the subjects. However, by computing a rate index statistic (rate index is the product of activity probability and respective mean travel rate), that took into account both the probability of activity and mean travel rate, a more representative graph was constructed (fig. 5). The nocturnal period was clearly the most active time for each subject. Animals did not move long distances during diurnal periods, except perhaps just before dusk.
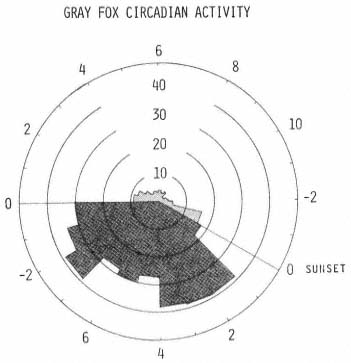
Figure 5.
An index representing the product of the hourly activity
probability from figure 3 and the respective mean travel
rate from figure 4 was calculated for each hour. See
figure 3 for description of polar graph.
Field observations suggest that three categories of activity may exist; short moves, meanders, and purposeful traverses. Extrapolation from these assumptions, based upon the available literature, suggests that a gray fox is likely to leave its diurnal resting site shortly before sunset and move only short distances while investigating the immediate area before beginning a purposeful traverse toward a foraging area some distance away. Perhaps this was the type of movement observed by Richards and Hine (1953) in Wisconsin when they reported that gray foxes frequently followed fence rows or well-defined trails. Upon arriving at the foraging area, more time was spent investigating thickets and crevices.
During meandering movements, many abrupt turns and reversals in direction occurred, as was also observed by Trapp (1978) in southwest Utah.
Two or three hours before sunrise a subject often made a second purposeful traverse toward the area in which it would spend the day, before extensive movement ceased at sunrise. Only short distances were traversed during diurnal periods as, perhaps, a fox moved from one resting site to another to take advantage of varying sun-shade conditions or pursued a potential meal.
Seasonal Activity
Spring and summer diurnal activity probabilities could not be demonstrated as similar by contingency analysis (p = 0.05). Spring diurnal activity was essentially non-existent from mid-morning through mid-afternoon. During the summer, substantially more activity occurred for the same period. No tangible evidence was found that explained this dichotomy. However, it seems reasonable that diurnal activity would be reduced for secretive carnivores during that portion of the year when only sparse vegetative cover was available.
The study area provided little cover during March and April, since the annual and perennial grasses were short and deciduous trees and shrubs
did not provide an extensive canopy. The only heavy groundcover available was an occasional brush pile or milk thistle stand. Similarly, certain spring and summer nocturnal activity probabilities could not be demonstrated as being the same, although the differences were not as dramatic as the diurnal differences. This may have been because the concealment afforded by darkness reduced the cover's influence. These assumptions are not supported in the literature since Wood (1954) and Richards and Hine (1953) stated that gray foxes are most active in the fall and winter, presumably when cover is minimal.
Further support for the "availability of cover" hypothesis was shown by the location of diurnal resting sites. In spring, it was not uncommon for a gray fox to return to the same resting area each day for several days in a row. Once the deciduous canopy began to develop, it was more common for subjects to rest in different areas each day. On 26 occasions, actual diurnal resting sites were visually located with the aid of a portable yagi antenna and receiver. In early spring, these sites were always in a dense stand of milk thistle. By late spring, after the vegetative canopy began to develop subjects were found in dense sandbar willow thickets or occasionally in a brush pile or under a tamarisk. None of the sites, except one in a milk thistle stand, appeared to be subterranean.
Reference to computer-drawn maps for each observation period suggested that subjects daily traversed more of their respective home ranges during June and July than in earlier months.
Home Range
Individual gray fox home ranges (fig. 6) were delineated by minimum polygons (Hayne 1949) drawn around the perimeter of fixes from each subject using Ables' (1969) "atypical habitat elimination method." The subjects were found to have a mean home range of 129 ha. (range = 106–172, n = 4). Fuller (1978), working approximately 6.4 km. (4 mi.) west on Putah Creek in more diverse habitat, calculated four home ranges (30, 132, 142, and 185 ha.) which gives a mean home range size of 122 ha. For eight gray foxes in Zion National Park, Utah, Trapp (1978) calculated a similar mean home range (107 ha.). However, Rymills (1979) computed a smaller mean home range (50 ha.) for three gray foxes at Point Reyes National Seashore, California.
Home ranges for all subjects closely coincided with the riparian zone and adjacent agricultural belts. The importance of the riparian zone as habitat seems evident, since 96.1% of the inactive observations were made within it. Probably less than three hours in any 24-hour period were spent in the bordering agricultural areas, and much of this time undoubtedly was spent travelling the dirt roads that separated riparian and agricultural areas (cf . Richards and Hine 1953; Wood 1954).
The 6-m. high flood-control levees apparently had minimal effect upon lateral movement outside the riparian zone, since the band of lateral activity remained relatively consistent even in the southeastern portion of the study area where no levee existed (fig. 1).
Figure 6.
Individual home ranges of four gray foxes on the Putah Creek study area, Davis, California.
Each home range was determined from computer analysis of radio-telemetry data. The
levee boundary can be compared with the study area photograph in figure 1.
The home ranges of all four subjects closely coincided (fig. 6). The activity centers (Hayne 1949) were also nearly coincident, suggesting that these animals were not territorial toward each other.
No subject limited its inactive periods to a specific region within the riparian zone, and only 5.9% of the fixes for different subjects appeared to overlap. This suggests that no apparent regional territoriality existed between subjects, although certain inter-individual distances were maintained.
Reducing the number of inactive areas by only counting those locations in which eight or more fixes were recorded reduced the number of inactive sites from 101 to 23 (fig. 7). These 23 sites reflected 60.9% of the inactive observations. Each subject still appeared to rest in various areas throughout the riparian zone, but never was observed at a resting site that had been frequented by another subject.
The apparent solitary diurnal behavior of the subjects did not change appreciably during nocturnal periods. None of the subjects were observed to travel together, although they may have met for brief periods. The frequency of such meetings could not be determined since the subjects often followed what appeared to be erratic paths with many reversals in direction. Presumably, erratic and solitary behavior would allow maximum exploitation of a rather limited range by several gray foxes.
Figure 7.
The spatial distribution of known diurnal gray fox resting
areas as determined from computer analysis of radio-telemetry
data taken on the Putah Creek study area, Davis, California.