Gray Fox Temporal and Spatial Activity in a Riparian/Agricultural Zone in California's Central Valley[1]
Donald L. Hallberg and Gene R. Trapp[2]
Abstract.—Gray fox (Canis [Urocyon ] cinereoargenteus )[3] temporal activity is quantitatively described from 1,094 radio telemetry fixes obtained from two male and two female subjects studied on Putah Creek, near Davis (Yolo County), California, from March through July 1973. The subjects were found to exhibit similar non-random temporal activity. Significant (p £ 0.05) increases in diurnal activity occurred one to two hours prior to sunset. Minimum activity began mid-morning and reached a low in late afternoon. Regardless of time, diurnal travel rates were conspicuously lower than nocturnal travel rates. All subjects occupied essentially the same area and had similar home range size (129 ha.). They spent 75.7% of the nocturnal and 91.6% of the diurnal period in riparian zones and the rest of the time on agricultural lands.
Introduction
The extensive range of the gray fox (Canis [Urocyon]cinereoargenteus ), both in Latin America and the contiguous United States, as shown by Hall and Kelson (1959), suggests an ability to adapt readily to widely varying environmental situations. Hence, it is of value to learn how behavior varies in specific parts of its wide range.
Gray fox temporal activity is poorly understood. In 1972, an extensive gray fox literature review was conducted by Trapp and Hallberg (1974). At that time, the number of published references to fox circadian activity were limited to less than a half-dozen (Seton 1929; Grinnell etal . 1937; Taylor 1943; Gander 1966). With the exception of Taylor's (1943) work, little more than passing remarks were made concerning circadian activity.
In Texas, Taylor (ibid .) quantitatively described the activities of four captive animals during one 22-hour period. His conclusions generally agreed with those of Grinnell et al . (1937) in California and Seton (1929), who suggested crepuscular and nocturnal activity is most common.
Howver, Gander (1966), observed that gray foxes visited his southern California feeding station at all hours of the day and night, implying that diurnal as well as nocturnal activity is not unusual. A more recent and somewhat more quantitative investigation conducted from 1967 to 1969 in southwest Utah by Trapp (1978) concluded that: "Foxes, though active mostly at night, also forage diurnally and crepuscularly to a lesser, but important, extent."
Only limited information was available concerning gray fox home ranges. Richards and Hine (1953) in Wisconsin reported home ranges of 13–310 ha., while Lord (1961) in northern Florida estimated gray fox home ranges to be about 770 ha. Using telemetry techniques in southwest Utah, Trapp (1978) determined the mean home range to be 107 ha. It is not clear if the variation in home range size was due to differences in population densities (Trapp and Hallberg 1974), variations in habitat productivity, sampling errors, or other factors.
The present project's objective was to expand upon the temporal aspects of gray fox
[1] Paper presented at the California Riparian Systems Conference. [University of California, Davis, September 17–19, 1981.]
[2] Donald L. Hallberg is Associate Data Processing Analyst, California Department of Fish and Game, Sacramento. Gene R. Trapp is Associate Professor of Biological Sciences, California State University, Sacramento.
[3] New genus as suggested by Van Gelder (1977, 1978).
natural history by quantitatively describing circadian activity in relation to habitat utilization. Activity data were secondarily expected to provide information concerning home range and intraspecific interactions.
This paper is based on thesis research undertaken in 1973 (Hallberg 1974).
Description of Study Area
The study area (fig. 1) is located at 38° 32' N and 121° 41' W, 6.4 km. (4 mi.) southeast of Davis, California. The site is situated on private agricultural land immediately adjacent to the Yolo Bypass. Putah Creek's south fork bisects the study area longitudinally for approximately 4.8 km. (3 mi.) and is paralleled by flood control levees. Putah Creek meanders between the levees and in most cases is bordered by a 0.16 to 0.32-km. (0.1- to 0.2-mi.) wide agricultural belt. During the study period, principal crops associated with the belt included varieties of tomatoes, beans, melons, and wheat.
The area study contained approximately 88 ha. (218 ac.) of stream and riparian zone consisting of approximately 36% tree and shrub cover, 46% open grassland, and 18% covered by water. Fremont cottonwood (Populusfremontii ), black walnut (Juglanshindsii ), and large willow (Salixlaevigata ) were plentiful, bordering the creek channel. Less abundant were blue elderberry (Sambucusmexicana ), box elder (Acer negundo ), tamarix (Tamarisk gallica ) and valley oak (Quercuslobata ). Dense sandbar willow (Salixhindsiana ) thickets were common in low, damp, sandy areas.
Extensive milk thistle (Silybummarianum ) stands, some as large as 0.2 ha. (0.5 ac.), were common in early spring. They were usually associated with disturbed areas around the perimeter of open grassy areas. By July, most of the areas of annual grass were overgrown by yellow star thistle (Centaureasolstitialis ).
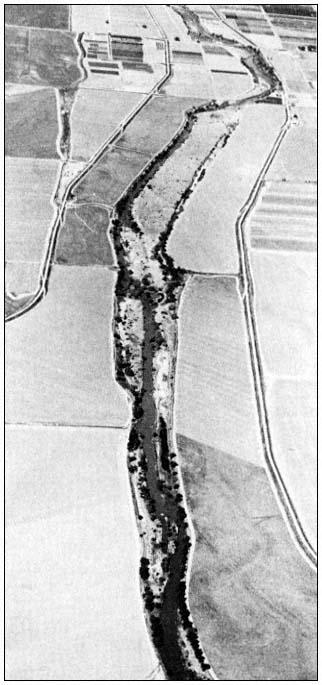
Figure l.
Gray fox study area along Putah Creek, southeast of Davis,
California, as seen from an altitude of approximately 914 m.
(3,000 ft.), looking west. Stream and riparian ststem are
flanked by agricultural fields and flood control levees. All
telemetry fixes were taken from gravel roads on the
levees paralleling the narrow agricultural belts.
Methods and Materials
Field data were obtained primarily by radiotelemetric monitoring (Hallberg etal . 1974) and secondarily by direct observation.
Trapping
Trapping and processing techniques were similar to those employed by Trapp (1978) to capture gray foxes and ringtails (Bassariscusastutus ) in Zion National Park, Utah. Nineteen collapsible Tomahawk double-doored livetraps (23 x 23 x 66 cm.) were placed in the field during March 1973 and left for the project's duration. Each was positioned in or near a well-defined trail, camouflaged with surrounding debris, and baited with raisins whenever it was necessary to capture animals.
Telemetry
Four gray foxes, two males and two females, were captured. Each was fitted with a radio-
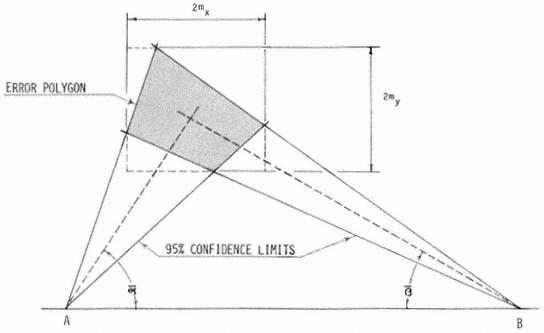
Figure 2.
Error polygons were computed by first calculating confidence limits (95%) for
bearing means (


intersection. Each fix was then expressed as the intersection of bearing means
(
polygon. The dimensions 2mx and 2my represent the 95% confidence range
associated with the fix along the X and Y axes respectively.
[4] Source listings of all Fortran IV computer programs are included in Hallberg (1974).
telemetry collar and monitored from 25 March through 27 July 1973. The effective telemetry range varied with atmospheric conditions, but the system usually performed well when within 0.16–0.8 km. (0.1–0.5 mi.) of the subject. Under ideal conditions signals were received from distances exceeding 1.6 km. (1 mi.).
Diurnal resting places were located with a three-element, hand-held yagi antenna and Davidson Model W portable receiver. All triangulation data were collected using a vehicle-mounted broadside array, consisting of two vertically polarized 3-element yagi antennas. The array pivoted from a television mast which also supported a Suunto compass from a projecting arm (Hallberg etal . 1974).
Each subject's location with respect to time was determined from field bearings, recorded to the nearest 0.5° of direction, being determined in the following manner:
1) two to five bearings were made in rapid succession and recorded from a predetermined station in the subject's vicinity;
2) the telemetry vehicle was quickly driven to an adjacent station where a second series of bearings was taken.
The entire procedure required two to five minutes to complete and was similar to the technique employed by Ables (1969) and Trapp (1978). During field observations, an attempt was made to locate two or three subjects every 30 minutes (mean = 34 minutes; range = 4 to 282 minutes; n = 1,094). It was not feasible to locate all subjects every 30 minutes because they were frequently too far apart.
Data Processing
All field bearings were later converted into fix coordinates; their associated error polygons (fig. 2)(Heezen and Tester 1967) were computed in relation to a single (x,y) coordinate system by computer.[4] The error polygons were used to test the significance of the distance between fixes. When successive fixes were shown to be significantly different (ca. p = 0.05), the subject was judged to have moved and therefore determined to be active. When significant movement was not demonstrated, the subject was considered inactive, even though undetectable activity may have occurred. For active subjects, mean travelrate index values were computed from elapsed time and distance measurements. Rates were considered to be only indices, since there was no reason to suspect foxes moved at a constant rate between
fixes or that they traveled in straight lines. All data were related to either sunrise or sunset to correct for variations in day length during the study.
Results and Discussion
Radio telemetry tracking allowed positive identification of subjects and their location (fix precision: 

No subject was observed to scratch, pull, or otherwise react to the telemetry collar once it was attached. Upon release subjects seemed to have little difficulty negotiating dense vegetation; after recapture several months later no skin chafing was evident. Based upon these observations it was assumed that the telemetry collar had little or no effect upon the subject wearing it.
Temporal Behavior
Statistical independence of subject circadian activity was tested by contingency analysis (Ostel 1963; Adler and Roessler 1972). No substantial evidence was found to suggest that subjects exhibited different circadian activity probabilities, and male:female activity probabilities did not significantly differ (p = 0.05).
The apparent similarity of subject activity probabilities was used to justify lumping all fox data. This in turn provided a larger sample for statistical inference. The pooled data were examined by testing a series of hypotheses. The first assumed the probability of activity to be random with respect to time; that is, the probability of activity equals the probability of inactivity for any given hour. Chi square analysis resulted in the rejection of this hypothesis (p = 0.05) for 19 hours of the day (fig. 3). The five hours where activity was random were the first, second, and sixth hours after sunrise, the first hour prior to sunset, and the seventh hour after sunset. Failure to reject the null hypothesis for the seventh hour after sunset was considered to be due to an inadequate sample (n = 2). Three of the four remaining one-hour intervals appeared random because these intermediate periods occurred while significant increases or decreases (p = 0.001) in activity states were in progress. The remaining period, six hours after sunrise, could not be explained on the basis of these data.
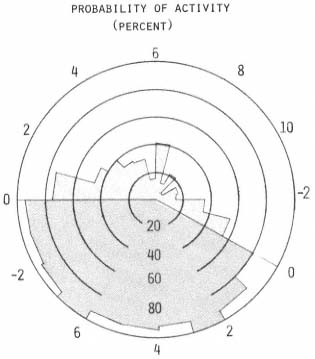
Figure 3.
The probability of activity [(active fixes/total fixes)
x 100] is shown for each hour. Hourly polar divisions
relate either to sunrise or sunset. The diurnal period
is shaded lightly with respect to the nocturnal period.
In general, it appeared that gray fox activity periods occurred in non-random fashion, foxes being significantly (p = 0.001) less active during diurnal periods than nocturnal. Statistically significant changes (p = 0.01) in activity appeared during the first two hours after sunrise and the first and third hours prior to sunset. Minimum activity observed was during mid-afternoon, which was significantly less (p = 0.001) than that observed in late morning.
Gray fox activity probabilities seem to be similar to those observed by Storm (1965) for five red foxes (Vulpes fulva ) in Illinois. Storm stated that the daily journeys began as early as two hours before the night and usually continued throughout most of the night; sometimes they continued as late as four hours after dawn. Rymills (1979) found that gray fox activity at Point Reyes National Seashore, California, generally began just before dark and continued until dawn.
Travel Rates
An animal's rate of movement probably depends upon many factors, such as its activity, travel conditions, the weather, and presence of other animals (Sanderson 1966). Since the mean rates, computed for each hour, were influenced greatly when extremes were encountered, no statistical inference was made. However, several interesting trends were apparent. Rates were relatively constant during diurnal periods and considerably lower than nocturnal values (fig. 4). This suggests that the type of activity occurring during diurnal periods was similar for each hour, regardless of activity probability. In contrast, nocturnal rates averaged about twice the diurnal values and exhibited two peak periods, while activity probabilities remained consistently above 80%.
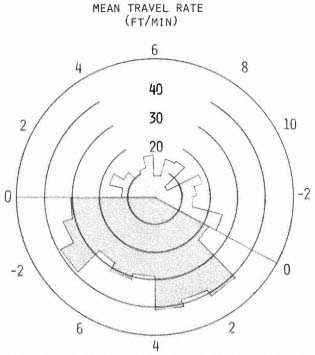
Figure 4.
The mean travel rate in feet per minute
was calculated for each hour. See figure
3 for description of polar graph.
Rate Indices
Neither activity probabilities nor mean travel rates seemed to reflect properly the intuitive impression of gray fox temporal movement developed while monitoring the subjects. However, by computing a rate index statistic (rate index is the product of activity probability and respective mean travel rate), that took into account both the probability of activity and mean travel rate, a more representative graph was constructed (fig. 5). The nocturnal period was clearly the most active time for each subject. Animals did not move long distances during diurnal periods, except perhaps just before dusk.
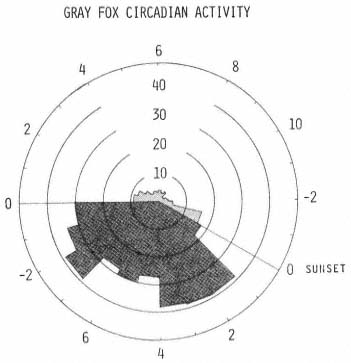
Figure 5.
An index representing the product of the hourly activity
probability from figure 3 and the respective mean travel
rate from figure 4 was calculated for each hour. See
figure 3 for description of polar graph.
Field observations suggest that three categories of activity may exist; short moves, meanders, and purposeful traverses. Extrapolation from these assumptions, based upon the available literature, suggests that a gray fox is likely to leave its diurnal resting site shortly before sunset and move only short distances while investigating the immediate area before beginning a purposeful traverse toward a foraging area some distance away. Perhaps this was the type of movement observed by Richards and Hine (1953) in Wisconsin when they reported that gray foxes frequently followed fence rows or well-defined trails. Upon arriving at the foraging area, more time was spent investigating thickets and crevices.
During meandering movements, many abrupt turns and reversals in direction occurred, as was also observed by Trapp (1978) in southwest Utah.
Two or three hours before sunrise a subject often made a second purposeful traverse toward the area in which it would spend the day, before extensive movement ceased at sunrise. Only short distances were traversed during diurnal periods as, perhaps, a fox moved from one resting site to another to take advantage of varying sun-shade conditions or pursued a potential meal.
Seasonal Activity
Spring and summer diurnal activity probabilities could not be demonstrated as similar by contingency analysis (p = 0.05). Spring diurnal activity was essentially non-existent from mid-morning through mid-afternoon. During the summer, substantially more activity occurred for the same period. No tangible evidence was found that explained this dichotomy. However, it seems reasonable that diurnal activity would be reduced for secretive carnivores during that portion of the year when only sparse vegetative cover was available.
The study area provided little cover during March and April, since the annual and perennial grasses were short and deciduous trees and shrubs
did not provide an extensive canopy. The only heavy groundcover available was an occasional brush pile or milk thistle stand. Similarly, certain spring and summer nocturnal activity probabilities could not be demonstrated as being the same, although the differences were not as dramatic as the diurnal differences. This may have been because the concealment afforded by darkness reduced the cover's influence. These assumptions are not supported in the literature since Wood (1954) and Richards and Hine (1953) stated that gray foxes are most active in the fall and winter, presumably when cover is minimal.
Further support for the "availability of cover" hypothesis was shown by the location of diurnal resting sites. In spring, it was not uncommon for a gray fox to return to the same resting area each day for several days in a row. Once the deciduous canopy began to develop, it was more common for subjects to rest in different areas each day. On 26 occasions, actual diurnal resting sites were visually located with the aid of a portable yagi antenna and receiver. In early spring, these sites were always in a dense stand of milk thistle. By late spring, after the vegetative canopy began to develop subjects were found in dense sandbar willow thickets or occasionally in a brush pile or under a tamarisk. None of the sites, except one in a milk thistle stand, appeared to be subterranean.
Reference to computer-drawn maps for each observation period suggested that subjects daily traversed more of their respective home ranges during June and July than in earlier months.
Home Range
Individual gray fox home ranges (fig. 6) were delineated by minimum polygons (Hayne 1949) drawn around the perimeter of fixes from each subject using Ables' (1969) "atypical habitat elimination method." The subjects were found to have a mean home range of 129 ha. (range = 106–172, n = 4). Fuller (1978), working approximately 6.4 km. (4 mi.) west on Putah Creek in more diverse habitat, calculated four home ranges (30, 132, 142, and 185 ha.) which gives a mean home range size of 122 ha. For eight gray foxes in Zion National Park, Utah, Trapp (1978) calculated a similar mean home range (107 ha.). However, Rymills (1979) computed a smaller mean home range (50 ha.) for three gray foxes at Point Reyes National Seashore, California.
Home ranges for all subjects closely coincided with the riparian zone and adjacent agricultural belts. The importance of the riparian zone as habitat seems evident, since 96.1% of the inactive observations were made within it. Probably less than three hours in any 24-hour period were spent in the bordering agricultural areas, and much of this time undoubtedly was spent travelling the dirt roads that separated riparian and agricultural areas (cf . Richards and Hine 1953; Wood 1954).
The 6-m. high flood-control levees apparently had minimal effect upon lateral movement outside the riparian zone, since the band of lateral activity remained relatively consistent even in the southeastern portion of the study area where no levee existed (fig. 1).
Figure 6.
Individual home ranges of four gray foxes on the Putah Creek study area, Davis, California.
Each home range was determined from computer analysis of radio-telemetry data. The
levee boundary can be compared with the study area photograph in figure 1.
The home ranges of all four subjects closely coincided (fig. 6). The activity centers (Hayne 1949) were also nearly coincident, suggesting that these animals were not territorial toward each other.
No subject limited its inactive periods to a specific region within the riparian zone, and only 5.9% of the fixes for different subjects appeared to overlap. This suggests that no apparent regional territoriality existed between subjects, although certain inter-individual distances were maintained.
Reducing the number of inactive areas by only counting those locations in which eight or more fixes were recorded reduced the number of inactive sites from 101 to 23 (fig. 7). These 23 sites reflected 60.9% of the inactive observations. Each subject still appeared to rest in various areas throughout the riparian zone, but never was observed at a resting site that had been frequented by another subject.
The apparent solitary diurnal behavior of the subjects did not change appreciably during nocturnal periods. None of the subjects were observed to travel together, although they may have met for brief periods. The frequency of such meetings could not be determined since the subjects often followed what appeared to be erratic paths with many reversals in direction. Presumably, erratic and solitary behavior would allow maximum exploitation of a rather limited range by several gray foxes.
Figure 7.
The spatial distribution of known diurnal gray fox resting
areas as determined from computer analysis of radio-telemetry
data taken on the Putah Creek study area, Davis, California.
Conclusions
In a habitat of riparian/agricultural land on Putah Creek, near Davis, California, four gray foxes (two males and two females) were found to exhibit similar temporal and spatial habits. Some temporal movement was observed during all 24 hours of the day. Activity increases began as early as two hours prior to dusk and peaked about three hours after sunset. The probability of activity exceeded 80% for the remainder of the nocturnal period. Although activity probabilities showed a significant reduction two hours following sunrise, minimum activity did not occur until afternoon.
Travel rates suggested that subjects made only local moves during diurnal periods and did not begin longer traverses until an hour after sunset. Although nocturnal travel was extensive, peak travel rates were observed one hour after sunset and again three hours before sunrise. These peak periods seemed to occur as subjects were leaving diurnal resting areas or when returning to them.
Individual gray foxes normally rested in different locations each day, once vegetative cover became abundant in late spring. After dark, activity paths appeared erratic, showing many twists and reversals in direction, particularly during the summer. No differences in circadian rhythms were observed during spring and summer, although the degree of spring activity was reduced. The lower activity probabilities and travel rates in the spring were attributed to sparse vegetative cover.
All subjects appeared to have nearly identical home ranges, since the geographical area and centers of activity were similar. The narrow riparian zone appeared to be the primary influence upon the home range's shape.
The apparent similarity of subject activity was not attributed directly to positive intraspecific co-actions since each subject appeared to exhibit solitary resting and travel habits.
Literature Cited
Ables, E. 1969. Home range studies of red foxes (Vulpesvulpes ). J. Mammal. 50(1):108–119.
Adler, H.L., and E.B. Roessler. 1972. Introduction to probability and statistics. 373 p. W.H. Freeman and Co., San Francisco, Calif.
Fuller, T.K. 1978. Variable home-range sizes of female gray foxes. J. Mammal. 59(2):446–449.
Gander, F.F. 1966. Friendly foxes. Pacific Discovery 19(1):28–31.
Grinnell, J., J. Dixon, and J.M. Linsdale. 1937. Fur-bearing mammals of California. 2 volumes, 777 p. University of California Press, Berkeley, Calif.
Hall, E.R., and K.R. Kelson. 1959. The mammals of North America. 2 volumes, 1,083 p. The Ronald Press, New York, N.Y.
Hallberg, D., F. Janza, and G. Trapp. 1974. A vehicle-mounted directional antenna system for biotelemetry monitoring. Calif. Fish and Game 60(4):172–177.
Hallberg, D.L. 1974. A contribution toward the better understanding of gray fox (Urocyon cinereoargenteus ) temporal and spatial natural history. M.S. Thesis, California State University, Sacramento. 285 p.
Hayne, D.W. 1949. Calculation of size of home range. J. Mammal. 30(1):1–18.
Heezen, K.L., and J.R. Tester. 1967. Evaluation of radio-tracking by triangulation with special reference to deer movements. J. Wildl. Mgmt. 31(1):124–141.
Lord, R.D. 1961. A population study of the gray fox. Amer. Midl. Nat. 66(1):87–109.
Ostle, B. 1963. Statistics in research. 585 p. Iowa State University Press, Iowa.
Richards, S.H., and R.L. Hine. 1953. Wisconsin fox populations. Wisconsin Conservation Department, Tech. Wildl. Bull. No. 6. 78 p.
Rymills, E.M. 1979. Movements and food habitats of gray fox, Urocyoncinereoargenteus , in Point Reyes National Seashore. M.A. Thesis, San Francisco State University, San Francisco, Calif. 131 p.
Sanderson, G.C. 1966. The study of mammal movements: a review. J. Wildl. Mgmt. 30(1): 215–235.
Seton, E.T. 1929. Lives of game animals. Vol. 1, Part 2. pp. 340–640. Doubleday, Doran and Co., Inc., Garden City, N.Y.
Storm, G.L. 1965. Movements and activities of foxes as determined by radio tracking. J. Wildl. Mgmt. 29(1):1–13.
Taylor, W.P. 1943. The grey fox in captivity. Texas Game and Fish 1(10):12–13, 90).
Trapp, G.R. 1978. Comparative behavioral ecology of the ringtail and gray fox in southwestern Utah. Carnivore 1(2):3–32.
Trapp, G.R., and D.L. Hallberg. 1974. Ecology of the gray fox (Urocyoncinereoargenteus : a review. p. 164–178. In : M.W. Fox, ed. The wild canids. 508 p. Van Nostrand Reinhold Co., N.Y.
Van Gelder, R.G. 1977. Mammalian hybrids and generic limits. Amer. Mus. Novitates 2635: 1–25.
Van Gelder, R.T., 1978. A review of canid classification. Amer. Mus. Novitates 2646:1–10.
Wood, J.E. 1954. Investigations of fox populations and sylvatic rabies in the Southeast. p. 131–139. In : Trans. 19th North American Wildl. Conf.