Chapter 2—
Membrane Structure and Transport
2.1—
Introduction
The control of metabolism and the development of cells frequently depends on the right substance being present in the right amount at a specific location in the cell at the right time. This may be achieved by regulation of the passage of materials from the external environment into the cell or from one compartment of the cell to another. All compartments of the cell, and its external surface, are bounded by membranes. It is clear, therefore, that any complete understanding of control mechanisms in metabolism or development must include a precise knowledge of the structure and composition of membranes and of the mechanisms whereby materials move through them. While it would not be true to suggest that all of this knowledge is available at present, the pace at which new information and insight has been gathered in the last decade is most impressive. In this short chapter it will not be possible to trace the history of the way in which ideas about membrane structure have developed, but it is worth mentioning that a (substantially correct) view of the basic structure of biological membranes was advanced in the 1930's, long before it was possible to visualize membranes in the electron microscope or to examine their detailed structure by X-ray deffraction techniques (Danielli & Davson, 1935). The simple trilaminar appearance of biological membranes in the transmission electron microscope (Fig. 2.1) is now familar to elementary students of biology and is known as the unit membrane; its occurrence is ubiquitous and this very fact has impressed on biochemists and others that this apparently uniform structure cannot explain the diverse properties of different membranes. This chapter covers the chemical composition of membranes and how these components are arranged. From this it will become apparent that the membrane is composed of a matrix, whose design is broadly similar in all cases, and a sub-structure on which many of the specific properties of the membrane probably depend. With this picture in mind it will then be possible to explore the basic types of transport which can occur across membranes and to relate them to the structures described.
2.2—
Chemical Composition of Membranes
Biological membranes are composed primarily of two main classes of compounds, lipids and proteins, which interact in several ways with water to bring
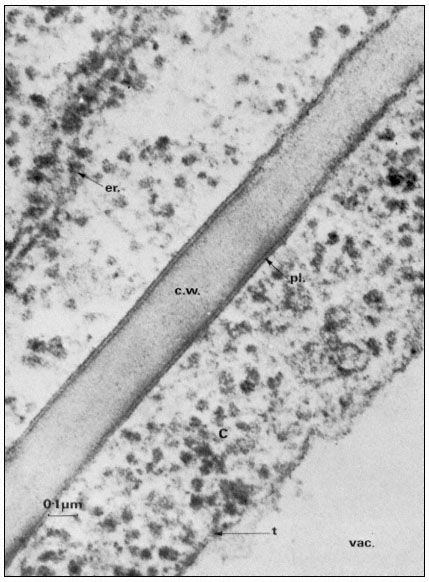
Figure 2.1
Electronmicrograph showing the plasmalemma of two endodermal cells
separated by a cell wall (c.w.) in the root of barley. The plasmalemma (pl.) is
prominently stained in the central region of the picture and is clearly trilaminar.
Notice that the tonoplast (t) bounding the vacuole (vac.) is much less distinct
but also appears trilaminar at the point indicated by the arrow. Other symbols
er = endoplasmic reticulum; c = cytoplasm. Total magnification about × 200,000.
(Micrograph by courtesy of Dr. A. W. Robards).
about a characteristic trilaminar structure. As a very broad generalization it might be said that lipids make up the supporting matrix of the membrane while the proteins thus supported determine its specific properties. This is, of course, merely a convenient simplification as it is becoming plain that some of the characteristic properties of a membrane, particularly those which determine its effectiveness as a barrier to the diffusion of water and electrolytes, depend on the nature of the membrane lipids. Conversely some proteins have a structural role. For the present purposes, however, the classes of compounds will be considered separately and a synthesis attempted later on.
2.2.1—
Lipids
Of the lipids present in plant cells the various phospholipids, glycolipids and sterols are of the greatest significance in membrane construction. The relative abundance of the components can be quite variable (Table 2.1) depending on the part of the plant analysed, the species and prevailing environmental conditions (see p. 29).
| |||||||||||||||||||||||||||||||||||||||||||||
2.2.1.1—
Phospholipids
The phospholipid molecule can be separated into a charged or polar 'head' region and an uncharged or non-polar 'tail'. Such a molecule is described as amphipathic, and as we shall see later on, this property is of crucial importance in determining membrane structure (p. 36). Phospholipids are generally thought to be restricted to membranes but the extremely rapid rate at which membranes can be taken apart and re-assembled, as in cell plasmolysis and de-plasmolysis, makes it probable that there are stores of phospholipid within the cell.
Phospholipids are readily extracted from macerated plant tissues by a mixture of chloroform and methanol (2:1) and can be separated by thin layer chromatography using a variety of solvent systems (see Hitchcock & Nichols, 1971, for a review of techniques).
The commonest phospholipids in plant membranes are derivatives of phosphatidic acid (Fig. 2.2); thus, lecithin is the choline ester of phosphatidic acid. Other common derivatives are also shown in Fig. 2.2. Phosphatidic acid (PA) itself is generally said to occur only in minute quantities in membranes or not at all, indeed, its presence in an extract is often taken as an indication of the activity of phospholipase D (Mazliak, 1973). There is a report, however, in which phosphatidic acid is said to be one of the major constituents of the plasmalemma of oat (Avena sativa ) root, (Keenan et al., 1974). Unfortunately,
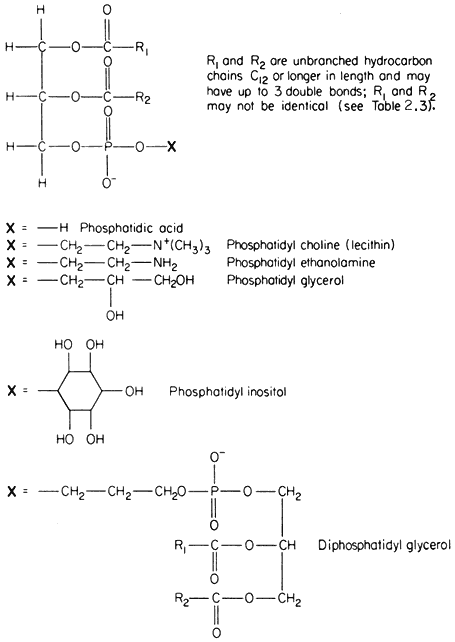
Figure 2.2
Structural formulae of phospholipids commonly found in plants.
detailed analyses of the plasmalemma from other plants are not available for comparison. In passing it might be noted that a great deal remains to be done, firstly in preparing pure sub-cellular fractions of the plasmalemma and of other membranes from plants and subsequently in determining their lipid composition. Table 2.2 presents some of the available information on the distribution of the different types of phospholipid. The information on the composition of the
| ||||||||||||||||||||||||||||||||||||||||||||||||||||||||||||||||||||||||||||||||||||||||||||||||||||||||||||||||||||||||||||||||||||||||||||||||||||||||||||||||||||||||||||||||||||
membranes of mitochondria and chloroplasts is the most detailed and reliable since these organelles can be separated with relative ease and high purity during cell fractionation. The predominant phospholipid in a given membrane may be characteristic, e.g. phosphatidylglycerol (PG) is a major component of chloroplast membranes while it is only a minor component of the inner mitochondrial membrane where diphosphatidylglycerol (DPG) is predominant. In general extracts of shoots and roots neither of these phospholipids is as abundant as lecithin (PC) or phosphatidyl ethanolamine (PE). A small quantity of phosphatidyl inositol (PI), usually less than 10% of the total phospholipid, is found in all membranes.
In Fig. 2.2 the exact chain length of the acyl groups R1 and R2 which make up the hydrophobic tail, is not defined precisely. In nature it can vary considerably even in one type of phospholipid from a given tissue. The chain may be made from 12 to 22 carbon atoms and may contain up to three or, rarely, six double bonds. The chain is straight in all eukaryotic organisms and has been found to be branched only in certain bacteria (Asselineau, 1966). Variation in both the length and unsaturation (i.e. the number of double bonds) of the hydrocarbon chain influences its melting point; shorter and unsaturated chains melt at much
lower temperatures than longer and saturated ones. As an example of this consider the effect of double bonds on the melting of free fatty acids containing 18 carbon atoms; the saturated stearic acid (C18:0 ) melts at 69ºC, the monounsaturated oleic acid (C18:1 ) at 5°C and the double unsaturated linoleic acid (C18:2 ) at –12ºC. Organisms which live in warm conditions and warm blooded animals are generally found to have phospholipids with an abundance of fatty acids which tend to be fully saturated (e.g. the thermophilic alga Cyanidium caldarium, see Kleinschmidt & McMahon, 1970). By contrast, organisms which are exposed to lower temperatures have either more unsaturated acids or ones with shorter average chain lengths or a combination of both of these (e.g. in Acholeplasma laidlawii, see Huang et al., 1974) to give phospholipids whose tails remain fluid. The significance of the maintenance of membrane fluidity will become apparent later (p. 41). The process of hardening plants against injury from frost or chilling is accompanied by changes in the degree of unsaturation of the membrane lipids (Wilson & Crawford, 1974).
Table 2.3 shows fatty acid analyses of individual phospholipids extracted from various sources. Bearing in mind that there is a great deal of room for manoeuvre in selecting the fatty acids to suit the prevailing environmental temperature the values for the relative abundance of fatty acids should be considered only as very general guides to the types of acid found in nature. Thus, the predominant fatty acids have even numbers of carbon atoms, the saturated acids found most frequently are palmitic (16:0) and stearic (18:0), and the principal unsaturated acids are linoleic (18:2) and the triply unsaturated linolenic (18:3). The fatty acid composition of lecithin can depend very strongly on its origin. For example, the lecithin in the outer mitochondrial membrane is much richer in palmitic acid (16:0), and perhaps is a less fluid component than in the inner mitochondrial membrane where triply unsaturated linolenic (18:3) is the most abundant fatty acid.
2.2.1.2—
Glycolipids
In several respects the glycolipids resemble phospholipids. The molecule is amphipathic, the polar group being a galactosyl derivative of a diglyceride, the non-polar part of the molecule being a pair of long, straight-chain fatty acids. Glycolipids are unusually rich in the triply unsaturated linolenic acid (C18:3 ) which may make up more than 90% of the fatty acid (Table 2.3).
The two most abundant glycolipids are mono- and di-galactosyl diglyceride, the structural formulae of which are illustrated in Fig. 2.3. They are characteristic of photosynthetic tissues since they are the major lipid component of chloroplast lamellae, largely replacing the phospholipids. Ongun et al., (1968) showed that more than 80% of all of the glycolipid in leaf cells was present in the chloroplasts. The probable orientation of these molecules in the chloroplast lamellae is much like that described for phospholipids (see 2.2.1.1.) with the fatty acid tails inserted into the central region of the membrane with the polar
| |||||||||||||||||||||||||||||||||||||||||||||||||||||||||||||||||||||||||||||||||||||||||||||||||||||||||||||||||||||||||||||||||||||||||||||||||||||||||||||||||||||||||||||||||||||||||||||||||||||||||||||||||||||||||||||||||||||||||||||||||||||||||||||
galactosyl groups at the membrane surface protruding into the stroma (Weier & Benson, 1967). Because the fatty acid is so highly unsaturated the membranes of lamellae probably remain fluid even at sub-zero temperatures—thus any photosynthetic reaction, or molecular reorientation, which depends on membrane fluidity may have a wide temperature range in which it can occur.
A sulphur-containing glycolipid is found as a minor component of most membranes. It is known as sulpholipid (Fig. 2.3) and its structure and occurrence in chloroplasts was reported by Benson (1963); the acyl groups are mainly palmitic with a preponderance of linolenic acid, thus resembling the other
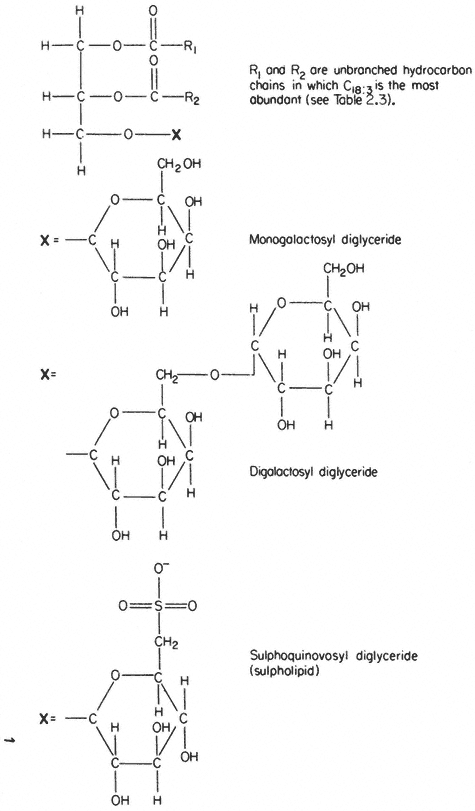
Figure 2.3
Structural formulae of glycolipids commonly found in plants.
galactosyl lipids. Sulpholipid represents only 1% of the total lipid in most tissues and organelles but in chloroplasts it may be as much as 10–15% of the lipid (Ongun & Mudd, 1968).
2.2.1.3—
Sterols
A number of sterols can be extracted from plant tissues and fungi as well as from isolated membrane fractions. The conventional example of a sterol of common biological origin is cholesterol (Fig. 2.4); in practice plant cells contain relatively little of this sterol in comparison with animal cells. Such meagre quantitative data as is available show that sterols having 29 carbon atoms, e.g. b -sitosterol (Fig. 2.4), are the most abundant in higher plants, while in fungi the C-28 sterol, ergosterol (Fig. 2.4) is often dominant. All of these molecules have an extended concertina-like configuration (known as the 'chair' or 'boat'),
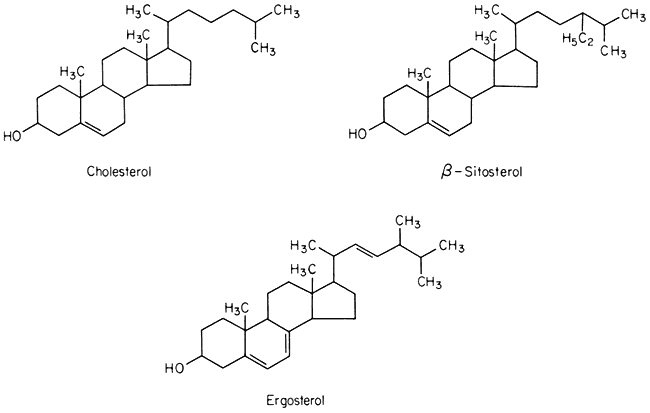
Figure 2.4
Structural formulae of sterols commonly found in biological membranes.
seem metabolically inert and are synthesized and turned over very slowly, especially in comparison with the other lipid components of membranes (Nes, 1974). Their function in membranes is not well understood but it is likely that they have an architectural role concerned with the maintenance of structure or order in the lipid domain. In this respect all of them probably function in the same was as cholesterol (see p. 38) because Butler et al., (1970) found that the structural order of bilayer membranes synthesized from lipids of ox brain tissue was stabilized equally well by cholesterol, b -sitosterol of plant origin and ergosterol. In the plasmalemma of the animal and plant cell there is a much higher proportion of sterols and sterol esters relative to phospholipid than in other
membranes (Table 2.4). It should be noted, however, that the membranes of intracellular organelles contain much more protein than do plasmamembranes (see p. 35). To some extent this protein, much of 2 which is bonded hydrophobically to the lipid, may function in a way similar to sterol in maintaining the structural order of the membrane interior.
| |||||||||||||||||||||
2.2.2—
Proteins
In many membranes, particularly in those of chloroplasts and mitochondria proteins make up most of the weight. The proteins found are many but as a first step in classifying them integral and peripheral proteins may be distinguished. This classification anticipates the subsequent discussion of membrane structure on page 38 but the terms clearly suggest that proteins in the two classes are associated with other components in the membrane in different ways. The recognition that certain proteins are embedded deeply in the lipid membrane represents a departure from the view, often advanced in earlier texts, that all of the membrane protein is located in the two peripheral bands which stain darkly with osmium and are visualized in the electron microscope (see Fig. 2.1). Whereas some of the protein is certainly located in this way and is probably bonded to the polar regions of the phospholipids electrostatically, it has become apparent that much protein is associated with the non-polar regions of the lipid by hydrophobic bonding. Peripherally located protein can be easily separated by washing with salt solutions or chelating agents but integral proteins are attached very strongly to the membrane and can be removed only after drastic treatment with organic solvents or detergents; even then, the isolated protein usually has some lipid attached to it.
Most of the membrane-bound enzymes, transport proteins (e.g. monovalent cation stimulated ATPase), drug and hormone receptors (in animal cells) and antigenic proteins are integral and are revealed when membranes are split open in freeze-fracturing (see p. 38). In many instances the enzymes arenonfunctional in vitro in the absence of lipid. It is thought that the non-polar parts of the polypeptide chains are associated with the hydrophobic tails of the fatty
acids and, this being so, several types of conformation are possible (see Singer, 1974 for a review). Proteins, like phospholipids, are amphipathic and their polar regions will arrange themselves so that their contacts with the hydrophobic regions of the membrane will be minimized; to ensure this, a protein could be arranged so that its polar, hydrophilic region lies among the phospholipid 'heads', or projects through them into the protein at the membrane periphery (Fig. 2.5).
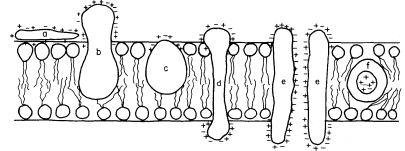
Figure 2.5
Possible orientations of proteins in a membrane. (a) peripherally bound protein
with polar groups all over its surface. (b) and (c) non-polar regions of the protein
bonded hydrophobically to lipid but with different numbers of polar groups. (d) polar
groups at either end of a long molecule with a non-polar central region. (e) a pair of
proteins as in (d) making up a polar pore or channel in the membrane. (f) a hydrophobic
globular protein wholly in the lipid domain—polar groups, if any, directed inwardly.
Long polypeptide chains with charged groups at either end may actually lie across the width of the membrane, or groups of them might lie with polar groups directed inwardly to form a hydrophilic pore across the membrane. An alternative conformation would be provided by the formation of a globular structure in which all of the polar groups would be directed towards the centre of the globule so that a hydrophobic surface would be presented to the lipid. This latter kind of conformation is probably least common.
The peripheral proteins can be attached to the polar groups of either phospholipids or integral proteins; examples which might be taken include cytochrome c which is located on the outer surface of the inner mitochondrial membranes (Schneider et al., 1972; see also Chapter 5), the chromoprotein, phytochrome, which is thought to be attached to the plasmalemma (Marmé et al., 1974; see also Chapter 12) and the sulphate and other ion-binding proteins on the outer surface of bacterial membranes (see Oxender, 1972, for a review).
From a quantitative point of view, certain generalizations about the relative abundance of peripheral and integral proteins can be made. The greater the metabolic activity which centres upon a given membrane system the greater amount of protein integrated into it. Thus, it might be anticipated that chloroplast lamellae and inner mitochondrial membranes would be relatively rich in these proteins, whereas membranes whose role is more concerned with providing
a diffusion barrier, e.g. the plasmalemma and the tonoplast, would be less so; evidence from electron microscopy shows that this is so (see Table 2.5).
2.2.3—
Water
Water is an important, if neglected, constituent of membranes for several reasons. In a general way it determines their basic design since, in its presence, amphipathic lipids assume a bilayered configuration (see p. 36). There are, however, other specific associations of water molecules and membrane components which are not fully understood.
It has been estimated that water of hydration accounts for about 30% of the weight of membranes. Much of this water will almost certainly not be in a liquid state but will exist in ordered layers around the hydrophilic parts of lipids and proteins. Immobilized by hydrogen bonding these water molecules are in a liquid-crystalline condition and cannot be frozen to form ice. Water layers bound at the surface of the membrane have been estimated to have viscosity of 39 times that of pure water and to have a thickness of at least 2.2 nm (Schultz & Asunmaa, 1970). They must contribute to the mechanical stability of membranes and add significantly to their barrier properties to diffusing solutes. Expressing an extreme view, Ling (1973) has proposed that it is not lipid but these polarized multilayers of water which provide the cell with its selective surface barrier.
Hydrophobic bonding between the non-polar regions of lipids and integral proteins (see p. 34) is favoured thermodynamically by the interactions of their polar regions with water (Tait & Franks, 1971).
Much experimental evidence points to the fact that water molecules are not restricted to membrane surfaces but cross the hydrophobic regions in numerous water-filled pores. These pores are thought to conduct water and small solutes (diameter <0.4 nm) to which membranes are highly permeable (see p. 60). Some water lining these pores is fully 'organized' and should, therefore, be regarded as a structural feature but there is indirect evidence to suggest that some of it must be free water in transit.
2.3—
Membrane Structure
It is convenient to discuss membrane structure under two headings; the organization of the membrane matrix which is largely a matter of the relationships of the lipid components, and the substructure of the protein in the membrane.
2.3.1—
The Membrane Matrix
2.3.1.1—
Phospholipids
The structure of phospholipid molecules considered earlier provides the key to understanding why it is that the membranes as seen in transverse sections have
a characteristic trilaminar appearance. The hydrophilic head regions make hydrogen bonds with water and may become cross-linked to other heads and to proteins through ionic bridges, e.g. by calcium ions; thus they are organized into a lattice-like structure. By contrast the long acyl chains of the two fatty acids attached to each phospholipid are strongly hydrophobic, loosely organized and, above their melting point, are relatively fluid. If phospholipid is dispersed in water the 'tails' will take on a conformation which will minimize their contacts with water. The 'heads' will, of course, react favourably with water. If the available water surface is large relative to the amount of lipid, the molecules will arrange themselves as a film-like monolayer with the heads at the water surface and the 'tails' protruding from it at right angles (Fig. 2.6a). If more phospholipid molecules are added to this system so that there are more than can be fitted into a tightly packed monolayer over the water surface, a second type of arrangement occurs quite spontaneously. The phospholipids form two ranks with the heads facing outwards in both and the tails directed inwards to form a non-polar hydrophobic layer sandwiched between them (Fig. 2.6b). This bilayer arrangement, which is common to all biological membranes, can also be formed from mixtures of phospholipids under laboratory conditions. The synthetic membranes thus produced have helped in arriving at an understanding of many of the structure/function relationships of natural membranes (see Goldup et al., 1970, for a readable review).
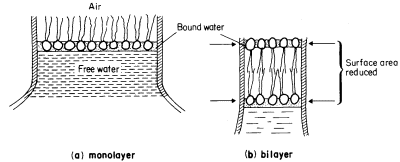
Figure 2.6
An illustration of how a monolayer of dispersed phospholipid (a) in water, forms
into a bilayer, (b) on contraction of the water surface area. The phospholipid
heads have water bound to them in polarized multilayers (see p. 35).
The selected analyses in Table 2.2 show that a given membrane may contain several types of phospholipid as well as appreciable quantities of sterol. It is probable that there is a great deal more organization of phospholipids in natural membranes than can be demonstrated positively at present. Lipids of one kind may be associated into clumps so that the membrane surface may be very heterogeneous with lipids of differing physical properties arranged in a mosaic.
A mosaic of charged and uncharged areas might occur because some phospholipids carry a net electrostatic charge at normal pH values, e.g. phosphatidyl glycerol, while others, like phosphatidyl choline (lecithin) are neutral. This is of significance because it has been shown that, in synthetic bilayers, the surface charge on the phospholipid heads can partly determine both the ion-selectivity and the cation permeability of the membrane (Papahadjopoulos, 1971), and it may also be relevant in determining regions of the surface of the plasmalemma where endo-cytosis may occur (see p. 61).
Local variations in the packing of sterols may render some parts of the membrane less fluid than others and thus determine areas where diffusion may be severely restricted (Papahadjopoulos et al., 1973).
More recently researchers have begun to investigate the possibility that the inner and outer halves of the bilayer may differ in their phospholipid composition. Should this prove to be the case, then it is possible that the barrier properties of the membrane to solute diffusion may be different when the membrane is approached from different sides.
In some special circumstances phospholipid molecules may become arranged into globular micelles in which the polar groups are directed towards the periphery of the sphere, the surface being hydrophilic. This state of affairs can be induced by dehydration in synthetic membrane systems, and in nature by viruses which create membrane instability, e.g. sendai virus, and by certain phospholipids (e.g. lysolecithin) with wedge-shaped head regions which tend to induce curvature of layers of closely packed phospholipids when they are introduced into a bilayer (Lucy, 1970). It has been suggested that rapid local transitions from the predominant bilayer to the micellar state are important in membrane fusion and in pinocytosis (see Lucy, 1970). If these transitions do occur then it is possible that they may cause transient gaps or pores to be created in the membrane; much physiological evidence points to the conclusion that membranes do have very fine pores in them (see p. 59).
2.3.1.2—
Sterols
The insertion of sterol molecules into the membrane increases the structural order of the hydrophobic region. These molecules lie with their long axes parallel to the hydrocarbon chains of the fatty acids with their more rigid ring structures directed towards the outside and their open chain ends towards the centre. The mobility of the hydrocarbon chains nearest to the outside of the membrane is, therefore, restricted by these stiffening structures but they remain pliant at their ends so that the central region is fluid (Caspar & Kirschner, 1971). The rigidity conferred on the membrane by the inclusion of sterols slows down the diffusion of materials through the outer part of the lipid domain in synthetic bilayers (Papahadjopculos et al., 1973).
2.3.1.3—
A Model of the Membrane Matrix
Figure 2.7 provides a basic interpretation of the ideas on the membrane matrix discussed so far. A fact, which it is important to understand but which is difficult to illustrate, is that the centre of the membrane is fluid while the periphery is semi-crystalline. Although it is a stable structure, it is known that phospholipid molecules can be inserted into, and withdrawn from the matrix rapidly and that the structure illustrated in Fig 2.7 represents a dynamic steady state when it is part of a biological membrane.
2.3.2—
Membrane Sub-Structure
When a cell or a piece of tissue is frozen and then fractured with a suitable blade, the fracture plane will follow lines of weakness in the structure. Since the central region of the membrane matrix contains no ice it is a potential line of weakness, along which the membrane tends to fracture (Fig. 2.8). Where the fracture line passes tangentially across a cell or organelle, sheets of membrane material become apparent; since membranes tend to be cleaved down the middle it is obvious that the surface exposed is not the true membrane surface but is the membrane interior. Figure 2.9 shows a relatively smooth sheet of plasmalemma from an onion root tip on which numerous round particles and depressions can be seen. Some of the particles are arranged in files while others are randomly distributed. These particles, which are usually 6–9 nm in diameter, are embedded in the membrane and are not resting on its true surface. This was demonstrated by Pinto da Silva & Branton (1970) who etched away the ice from the fracture plane by leaving the specimens under a high vacuum for some minutes after fracturing them. Using this method, the true surface of membranes which lay obliquely to the fracture plane was eventually revealed as the ice from the surrounding cytoplasm sublimed. The true surface had a much smoother appearance, the undulations of which gave the impression of a blanket lying over the embedded particles. The particles in the membrane can be removed by treatment with proteolytic enzymes and can be re-created in synthetic membranes which have been made in the presence of a hydrophobic protein. Vail et al., (1974) reported that a synthetic bilayer membrane into which a hydrophobic protein had been incorporated had intercalated particles of 8.5 to 9 nm diameter occupying 12% of the internal membrane surface whereas in bilayers lacking the protein there were none.
The frequency of particles varies according to membrane type (Table 2.5); chloroplast and mitochondrial membranes have the highest frequency as one might anticipate from the many metabolic events which are centred upon them. One of the two fracture faces is usually more densely populated than the other. Bearing in mind the amphipathic nature of membrane proteins (see p. 34) it is possible that the more densely populated face may reflect the principal orientation of the polar groups of the integral proteins, i.e. if most of the polar groups were directed towards the outside of the cell or compartment, the outer fracture
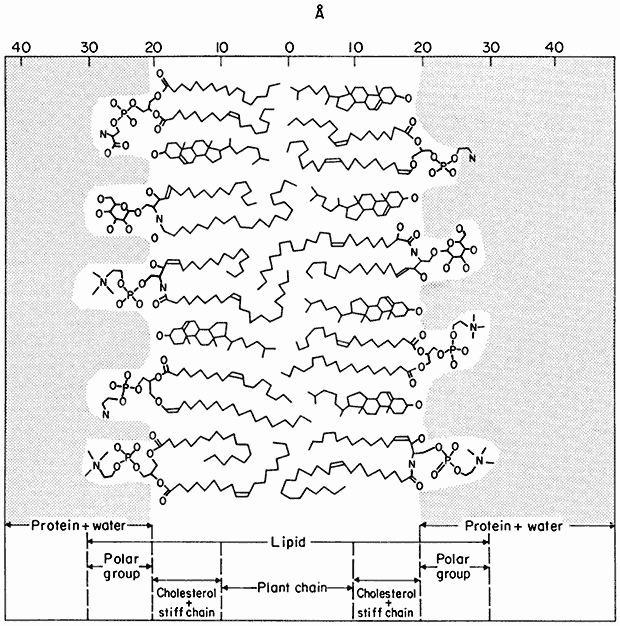
Figure 2.7
Orientation of polar lipids, cholesterol and peripheral protein in a model of the membrane matrix.
Based on X-ray diffraction analysis of nerve myelin. (From Caspar & Kirschner, 1971). In many
ways myelin has been an unfortunate choice for detailed structure of cell membranes since it is
not typical in having virtually no integral protein and has no intercalated membrane particles
(see Table 2.5). It is, however, very appropriate as a general model of the membrane matrix.
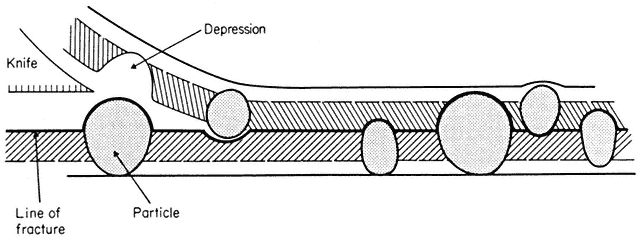
Figure 2.8
Line of fracture when a frozen membrane is split open in freeze-fracturing. Particles
embedded in the membrane become apparent in the cleavage plane either as
projections or as hollows if they are removed on the upper half of the bilayer.
face would be the most densely populated. It should be noted that in synthetic lecithin membrane and in nerve myelin, which both have a very low permeability to ions, there are no particles.
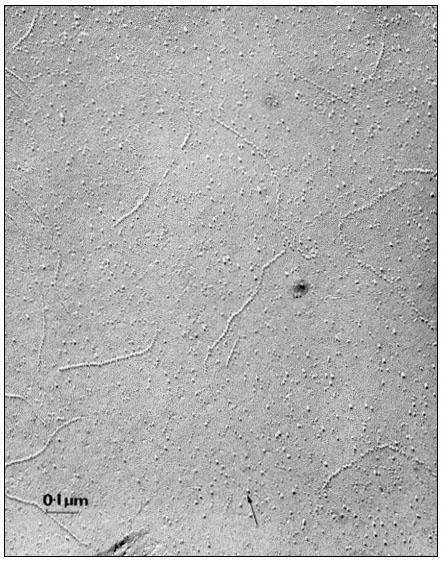
Figure 2.9
Particles seen on the inner fracture face of the plasmalemma from a root tip
cell in onion. The fracture face exposed as described in Fig. 2.8 and metal
shadowed to produce a replica; the arrow represents the direction of
shadowing. Note that there are distinct files of particles as well as randomly
distributed individuals. The membrane matrix appears to be relatively smooth.
(Micrograph by courtesy of Professor D. Branton).
| ||||||||||||||||||||||||||||||||||||||||||||||||||||||||||||||||||||||||||||||||
2.3.2.1—
A Model of Membrane Structure
The representation of membrane structure shown in Fig. 2.10 is one which commands wide acceptance at the present time. In it we see that large masses of integral protein are inserted to varying extents in the membrane matrix while some are restricted to the surface and others protrude right across the width having a dumbell configuration. The model, which has become known as the fluid mosaic (Singer & Nicholson, 1972), has a disorderly appearance in contrast to the neat pictures used to illustrate the unit membrane; the membrane sub-structure has been likened to numerous protein icebergs in a sea of lipid.
2.3.2.2—
Membrane Fluidity
An essential feature of the model in Fig. 2.10 is that the various components of the membrane can move relative to one another. Rather than being fixed points, many of the proteins are best thought of as drifting around in the lipid, the viscosity of which will determine the rate at which they move. Evidence that membrane particles can move in the plane of the membrane comes from freeze
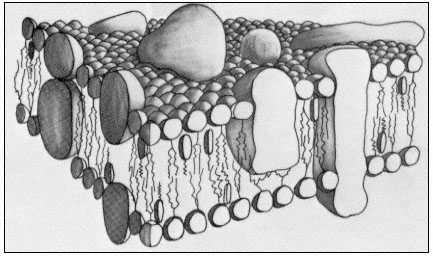
Figure 2.10
A representation of the fluid mosaic model of membrane structure
showing peripheral and integral proteins in a 'sea' of lipid molecules.
Not shown are the polarized water layers which are bound to the polar
regions of the lipids and proteins. The round-headed objects with twin
tails represent phospholipids, the obovoid structure with the single tail
represents sterol and the large irregularly shaped objects are proteins.
(Based on ideas in Singer & Nicholson, 1972 and Capaldi, 1974).
fracture studies of the plasmalemma of Mycoplasma mycoides, in which it was seen that particles became aggregated as the membrane was cooled down but dispersed again when it was warmed up (Rottem et al., 1973). A second line of the evidence comes from studies where two animal cells were induced to fuse with one another (Edidin & Farnbrough, 1973). One of the cells has a specific antigen in its plasma membrane which the other cell lacked. The distribution of the antigen could be visualized by the binding of a fluorescent antibody. The fusion of the cells to form a heterocaryon and the subsequent redistribution of the fluorescent antibody were observed using a fluorescence microscope. At first the fluorescent marker was restricted to one half of the heterocaryon, but quite quickly, and in an orderly progression the fluorescence spread right around the coat indicating that the antigenic protein, known to be integrated into the membrane matrix, had diffused in the plane of the membrane. For it to have done this it must have drifted through the lipid. If the heterocaryon was cooled below the transition temperature of its lipids, no mixing of the antigen occurred.
From what we have said above and from earlier comments (p. 29) it is clear that temperature will have a very important influence on the diffusion of materials through, and in the plane of, the membrane because of its effect on the viscosity of the lipid (Edidin, 1974). If the membrane is cooled to the extent that the lipids freeze then such diffusion will become very restricted; the biological
significance of this is reflected in the fact that the rates of most physiological processes examined over a range of temperatures are found to have a sharp transition at a temperature which is close to the transition of membrane lipids from a liquid crystalline condition to the gelled condition (Simon, 1974).
Most workers agree that there must be some proteins whose position in the membrane relative to others must be maintained, e.g. components of electrontransport chains. Such proteins may require anchoring points either in parts of the membrane which are less fluid than others, or by association with some extra-membrane protein. It is possible that aggregations of sterol molecules might serve to create more viscous patches, and there is evidence, again from synthetic lipid bilayers, that cholesterol can be concentrated in association with certain phospholipids (de Kruyff et al., 1974).
2.3.2.3—
Membrane Synthesis and Flow
The intermediary metabolism concerned with the synthesis of the components of the membrane is beyond the scope of this chapter but it is believed that the components themselves may be centrally assembled and then distributed to the various membranes of the cell. This flow of membrane material can be detected in experiments where cells are provided with a radioactive precursor to a common membrane protein for a short while, and then returned to non-radio-active medium. This type of analysis has not been performed on plant cells but in animal cells, harvested at intervals after pulse-labelling, the radioactive label appears first in the endoplasmic reticulum and then in the Golgi cisternae. Subsequently, the radioactivity of these compartments declines followed by an increase in label associated with the plasmamembrane some hours later (see Table 2.6). Since mitochondria and chloroplasts probably do not have all of the metabolic apparatus to assemble their own membranes it is thought that they too may obtain partly finished membranes from the endoplasmic reticulum (see also chapter 8).
| ||||||||||||||||||
There is evidence that the cytoplasm contains numerous membrane-bounded vesicles which frequently appear to be in conjunction with the major membranes
of the cell (e.g. Mahlberg et al., 1974). They are particularly prominent in cells synthesizing walls and, since it is known that precursors of wall synthesis are formed inside the cell and elaborated outside, it is reasonable to conclude that the vesicles contain precursors which are discharged after fusion with the plasmalemma (Heyn, 1971). It has also been found that particulate material from the external medium can be detected in vesicles within the cytoplasm (Mayo & Cocking, 1969; Robards & Robb, 1974). These results suggest that vesicles can both fuse with, and be formed from the plasmalemma and other membranes, thus allowing materials to pass out of or into the cell without their having to cross a membrane (see p. 61); such movements are known as exoand endo-cytosis, respectively. Membrane fusion also presents opportunities for the transfer of blocks of membrane from place to place as is implicit in the observations in Table 2.6.
Since adjacent membranes can frequently be found to be in contact over comparatively large areas and yet show no tendency to fuse with one another, it is believed that special proteins or phospholipids (e.g. lysolecithin) in the vesicle membrane may trigger fusion where they make contact with the larger membrane sheet (see Lucy, 1970).
2.4—
Transport of Substances Across Membranes
In a healthy cell there is a continuous interchange of water, ions, uncharged solutes, metabolites and dissolved gases across the plasmalemma. As one might expect, not all of these substances move through the membrane in the same manner. Firstly, some substances diffuse into a cell down a gradient of potentia energy; such movement is spontaneous and is the thermodynamic equivalent 01 heat passing from a warmer to a cooler body. There are, however, many substances which are accumulated by cells against a gradient of potential hence their movement into the cell is 'uphill' and is equivalent to the flow of heat from a cooler to a warmer body. 'Uphill' transport requires work to be performed and thus consumes energy. 'Downhill' transport is frequently described as passive while 'uphill' transport is described as active and directly involves the participation of cellular metabolism.
In Fig. 2.11 some further sub-divisions of transport processes have been made. Thus, passive movements may occur by at least three types of pathway, whereas active movements must be linked to some energy-consuming mechanism, referred to as a 'pump', in the membrane. The third type of movement occurs because of the undulation and vesicularization of the membrane in endocytosis (see p. 61). Clearly this is a process which depends at some point on metabolism but, as is discussed below, the substances which move into the cell do not necessarily cross the membrane at all. In such circumstances the observed transport is not strictly active in a thermodynamic sense.
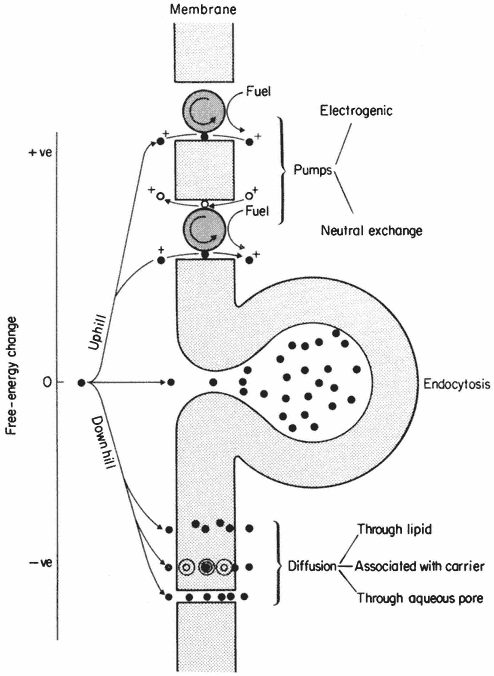
Figure 2.11
Types of active ('uphill') and passive ('downhill')
transport across a membrane. For discussion see text.
2.4.1—
Passive ('Downhill') Transport
Solute molecules in more concentrated solutions possess more free energy than those in lower concentrations; in other words they are at a higher potential. If two solutions of different concentration are mixed, solute molecules will diffuse from areas of high to areas of low potential. In any given situation the chemical potential of an uncharged solute is dependent on its activity as shown in equation 2.1.

|
|
For many practical purposes it is assumed that the activity of a solute moving freely in dilute solution is the same as its concentration so that the chemical potential is more frequently written

where Cs = the concentration in moles 1–1 .
If the solute is charged, its movement from place to place can also be influenced by differences in electrical potential. An ion, therefore, has an electrochemical potential which is related to its concentration (strictly, its activity) and the electric potential of the medium in which it is moving. Thus,

where


Because Cj and y can influence

2.4.2—
Criteria For Active ('Uphill') Transport
To decide whether or not an ion or solute is actively transported across a membrane we need to know its activity or concentration in the two solutions separated by the membrane and for ions, in addition, we must know the electrical potential difference across the membrane. It is frequently difficult to measure the concentrations, and more difficult to measure the activity, of substances within cells with any accuracy, especially in those of higher plants.
In the giant cells of several sorts of algae, which may be 5,000 to 10,000 times the volume of a parenchyma cell in a root, such measurements are made
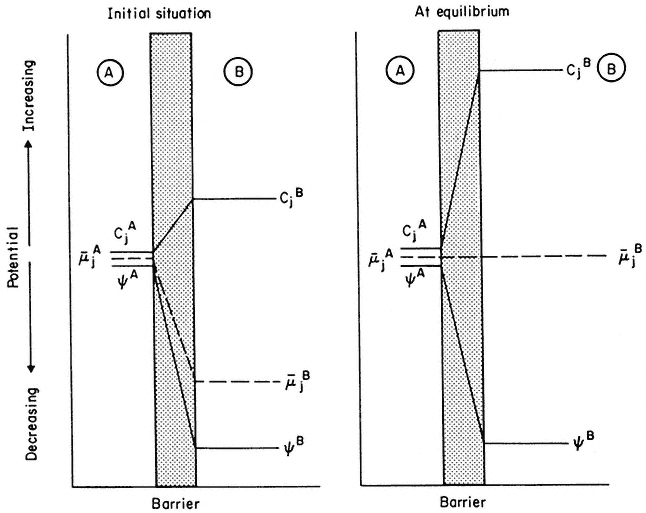
Figure 2.12
An explanation of the way in which a decrease in electrical potential, y , across a membrane
can result in the diffusion of an ion against a gradient of concentration. Note that, in the initial
situation, in spite of concentration of j being greater in B, the electrochemical. potential gradient is
still directed 'downhill' towards B. As B fills with ion j, µj flattens out and, at equilibrium becomes zero—
at this point the 'uphill' concentration gradient and the 'downhill' electrical gradient are equal and opposite.
routinely. The electrical potential difference across membranes can be measured if a small glass micro-electrode, with a tip diameter of 1 to 3m m, can be inserted into the membrane-bounded compartment (see Clarkson, 1974).
Having made the necessary measurements a simple test can be applied to see if a given ion or solute within the compartment is at a higher or lower potential than in the surrounding solution. The principal snag in this analysis is that the cell or compartment should be in a steady state and that no net movement of solute should be occurring. In nature this condition is infrequently met.
Let us suppose that the ion j is at electrochemical equilibrium between the two compartments i.e.:

re-writing equation 2.3 and cancelling out


gathering the electrical terms to the left-hand side we get

yin —y out is the electrical potential difference across the membrane where the ion j is at equilibrium and is given a special name, the Nernst Potential, and is usually symbolized EjN . We now compare this calculated equilibrium potential with the potential difference which is actually measured by the electrodes on either side of the membrane. If the calculated and observed values coincide we would conclude that, in spite of any differences in Cj across the membrane, the system was at equilibrium. If, however, the observed potential was lower than the equilibrium potential we would conclude that the electrical driving force was not sufficiently large to support the observed asymmetry of Cj and we would suspect that active transport was occurring. The example worked out in Table 2.8 may make this clearer. For each ion the appropriate Nernst Potential has
| |||||||||||||||||||||||||||||||||||||||||||||
been calculated from the observed concentrations on the outside and inside of the membrane using equation 2.5. The exact correspondence of the Nernst Potential for potassium,


concentration is only 1/20 th of the equilibrium concentration strongly suggests that metabolic energy must be coupled to a Na+ -efflux pump. Chloride ions in the cell are a very long way indeed from being in electrochemical equilibrium with their surroundings, being more than 1,000 times greater than the equilibrium concentration, thus their movement into the cell is steeply uphill.
In theory this type of analysis can be applied to any ion, although it is difficult to apply to minor ionic constituents, e.g. trace elements, because they may be complexed with organic ligands within the cell so that their ionic activity may be very much lower than their concentration as measured by chemical analysis.
If an analysis of the kind described in Table 2.8 shows that the transport of an ion in a given direction is 'uphill', one should not conclude necessarily that the membrane is equipped with a special pumping mechanism for that ion. In some cases it may be, but in others the 'uphill' transport of the ion may be coupled with the 'downhill' transport of another via a common carrier; this latter possibility is described under the heading Co-transport on p.56.
2.4.3—
The Nature and Origin of the Membrane Potential
It is clear that electrical potential differences across membranes are of great importance in generating driving forces on ions. It is important, therefore, to try to understand how these potentials arise and how they are maintained.
An electric potential difference arises because positive and negative charges become separated. Since the cytoplasm of most cells is electrically negative relative to the surroundings it is very slightly enriched in anions relative to cations. This can be attributed to the differential permeability of the cell membrane and to the activity of ion pumps. First let us examine how differential permeability can create an electrical potential difference.
2.4.3.1—
Diffusion Potential
Imagine a simple system of two compartments separated by a membrane which has a much higher permeability to K+ than to Cl– (Fig. 2.13). If the compartments are filled with potassium chloride solutions of different concentration, initially K+ will move through the membrane out of the more concentrated compartment, and for a very brief period, the more concentrated cell will lose K+ faster than Cl– leaving it enriched in negative charge. The negative diffusion potential thus created slows down the further escape of K+ by attracting it back into the more concentrated compartment. When the potential has developed, a large concentration difference can be maintained between the compartments. Since the membrane has a finite permeability to Cl– , albeit a low one, over a long period of time both the electrical potential difference (the diffusion potential) and the concentration difference would run down as Cl– leaked through the membrane. If the membrane were completely impermeable to Cl– , the
potential, once established, would be maintained indefinitely. In nature, membrane permeability to anions is a tenth to one hundredth of that for the monovalent cations; thus, the maintenance of a potential of the kind just considered depends on topping up the cell with anions at a rate comparable with their leakage into the surroundings. This is an 'uphill' transport and therefore requires the mediation of some ion pumping mechanism. Active transport is, therefore, necessary to maintain a diffusion potential.
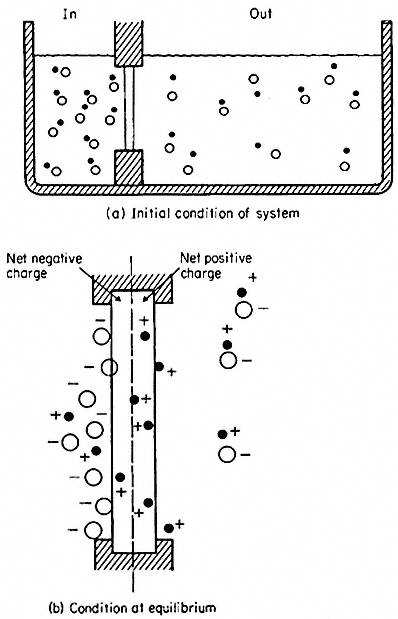
Figure 2.13
Development of charge separation and a diffusion potential
in a model system containing a membrane selectively
permeable to cations. For further explanation see text.
(From Clarkson. 1974.)
In nature it is frequently possible to find cells where the electrical potential difference across the plasmalemma is, indeed, a diffusion potential of the kind just described which depends very closely on the concentration of either K+ or H+ in the medium and in the cytoplasm. In such circumstances its value can be predicted from the Goldman equation (2.6) which relates the concentration ratios of ions across the membrane and their permeabilities (PK , PNa , PCl etc.).

This relationship will apply strictly only to situations where the cell and the surroundings are in a steady state and hence limits its application to mature and non-growing cells. The last pair of terms in equation 2.6 has been put in to emphasize that other diffusing ions can be added to the equation; clearly H+ has an important effect on the membrane potential in some instances (Kitasato, 1968). Since the concentration ratio is multiplied by the permeability coefficient, the value of E will be most strongly influenced by the ionic asymmetry of the most rapidly diffusing ion. In the system considered above the value of E would have been given by

and be governed almost entirely by K+ since PCl was very small compared with PK . Notice that the ratio of the chloride terms is inverted relative to the cationic terms. This is explained because the chloride concentration differential will tend to reduce any negative electrical potential set up by the asymmetric distribution of the cations.
2.4.4—
Membrane Pumps
Pumping mechanisms which allow cells to accumulate solutes up gradients of potential can contribute to the membrane potential in both an indirect and a direct way. The former type are referred to as neutral exchange pumps in which the cell dumps an unwanted ion of equal and like charge into the external environment in a one-to-one exchange for an ion which is more useful, e.g. there are well known exchanges of cellular Na+ or H+ for K+ from the surroundings. The second type transports an ion in one direction only without coupled exchange and is known as electrogenic since charge is separated. They can, therefore add to, or subtract from the diffusion potential, described above, depending on which ion is carried. These two types of mechanisms are outlined in Fig. 2.11.
2.4.4.1—
Neutral Ion Pumps
Neutral ion pumps are present in the plasmalemma of all cells and by their activity they create the ionic asymmetry necessary to set up the diffusion potential described above. As a much simplified illustration of this, consider a cell which, because of its synthetic and respiratory activity, is generating H+ and HCO3– internally. A pair of exchange pumps could swap H+ and HCO3– for K+ and Cl– from the surroundings quickly enriching the interior in these ions and thus setting up the conditions in which the differential rates of diffusion
of K+ and Cl– out of the cell give rise to a membrane potential. But how does such a pump actually work? There are fewer detailed examples than one would like but the best known is of the membrane-bound ATPase which exchanges intracellular Na+ for extracellular K+ in many animal and plant cells (see Hall, 1971; Hodges et al., 1972). In the red blood cell it is known that Na+ is one of the cofactors which is essential for the binding of ATP to the ATP-ase enzyme. In vivo the active centre of the enzyme is accessible only from the cytoplasm, so that the ATP and the Na+ must be inside the cell (Fig. 2.14). Once bound, the ATP
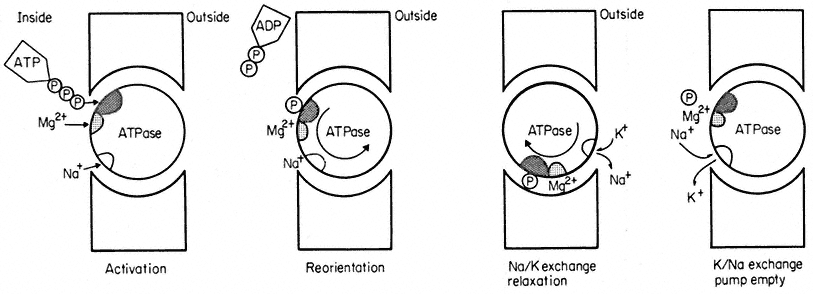
Figure 2.14
A highly simplified illustration of the working of a sodium-potassium exchange pump based on a
membrane-bound ATPase. The cross hatched area on the ATPase is its active centre. The large
re-orientation of the molecule is for illustrative purposes only—quite subtle molecular re-arrangement
may be all that is necessary to expose the Na+ - binding site to the outside and for the step called relaxation.
is hydrolysed, ADP is released into the cytoplasm leaving the cleaved terminal phosphorus atom attached to the active centre to form a phosphoenzyme. These reactions result in some molecular re-orientation of the phosphoenzyme and its attached Na+ which exposes the ion-binding site to the different chemical environment of the external medium. It is proposed that this change of environment alters the ion-specificity of the binding site so that K+ is favoured; K+ thus replaces Na+ . This done, there is a second re-orientation (referred to as 'relaxation' in Fig. 2.14) which carries the bound K+ to the inside. The phosphorus is released from the active centre and Na+ , which is preferentially bound on the cytoplasmic side exchanges for K+ and the pump is ready for a second cycle. The pump has used the free energy released on hydrolysis of ATP as fuel to exchange K+ and Na+ against their respective electrochemical potential gradients. The two ions in the appropriate orientations are essential cofactors in the enzyme reaction; in vitro, ATPase of this kind will not hydrolyse ATP unless Na+ and K+ are both present.
In theory many pumps based on ATPase are possible with only subtle modifications of the ATPase molecule to provide binding sites of varying field
strength which will select various ions, e.g. a Ca2+ transporting ATPase is found in mitochondria and in sarcoplasmic reticulum (Racker, 1972).
2.4.4.2—
Electrogenic Pumps
The unidirectional transport of an ion across a membrane separates charges and in so doing provides a driving force for the passive diffusion of a similarly charged ion in the opposite direction or an oppositely charged ion in the same direction. The molecular details of exactly how an electrogenic pump is put together remain uncertain although in one instance it is highly likely that an electrogenic H+ -efflux pump is based on an ATPase (Slayman et al., 1973). It is possible, nevertheless, to deduce certain general consequences of their operation. If, for instance, there was an outwardly directed pump at the plasmalemma which actively pumped hydrogen ions (protons) out of the cell thus making the interior electrically negative, this could contribute to the electrical driving force on the diffusion of K+ from the external medium. Indeed the rate at which charge is extruded and the rate at which it leaks back into the cell must be very nearly in balance unless a dangerously large potential is to accumulate. Examples of both proton extrusion pumps and anion influx pumps of the electrogenic kind are well documented from research on plant tissues (Higinbotham & Anderson, 1974; Spanswick, 1972). In the giant alga, Acetabularia, an electrogenic chloride influx pump contributes more than half of the potential of –170mV found across the plasmalemma when the cell is kept in the light. Almost immediately the cell is put in the dark the pump stops working (since it is closely linked with photosynthesis) and the membrane potential abruptly depolarizes to –80mV (Saddler, 1970). A similar light-dependent electrogenic pump is found in Nitella translucens (Spanswick, 1972, 1974). Electrogenic pumps are not, however, restricted to green tissues but have been reported in plant roots (Higinbotham et al., 1970) and fungal hyphae (Slayman, 1970). In every instance, however, inhibition of the pump caused an immediate depolarization of the membrane potential, indeed this is often used to detect the activity of such a pump. The inhibition of a neutral ion pump gives rise to gradual depolarization as the ionic asymmetry runs down (see equation 2.6).
2.4.5—
Membrane Carriers
Many ions and uncharged solutes cross membranes more rapidly than could be expected if they passed through the membrane lipids without some assistance. Since pores in membranes are too narrow to accommodate many substances which are transported, it is widely believed that membranes contain carrier molecules which, in combination with the solute, facilitate diffusion. The ion pumps considered above are carriers of a special kind since they are linked to
the metabolic activity of the cell; the carriers we shall now consider promote net movements of solutes only down the prevailing potential gradient and are not capable of 'uphill' transport even if in some instances (see p. 57) they appear to be doing so.
2.4.5.1—
Evidence from Kinetics
One widely used approach to gather information about carriers has been the application of kinetics first derived from enzyme reactions. The evidence for these carriers is obtained by placing a cell or tissue in a range of solute concentrations and measuring the initial rate of uptake. As illustrated in Fig. 2. 15 the uptake rate shows a tendency to saturate at higher concentrations and can thus be used to calculate the maximum velocity, Vmax , possible under the conditions used in the experiment. By making a double reciprocal plot of the data (Fig. 2.15) the concentration of solute at which half maximal velocity is achieved can
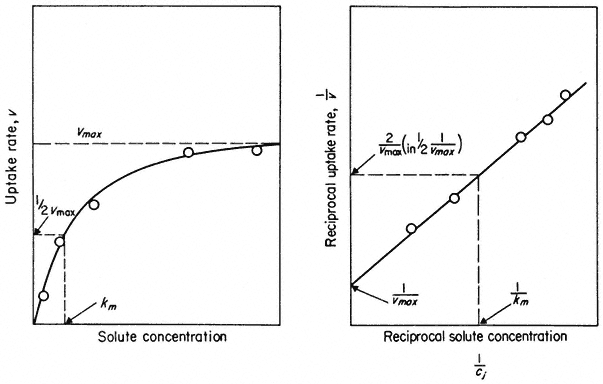
Figure 2.15
Saturation kinetics of solute uptake versus concentration. Such results are used
as evidence for the association of the solute and a carrier. The double reciprocal plot of
the data gives a more accurate estimate of Vmax and Km when the number of points is limited.
be estimated. This is known as the Michaelis Constant, Km . The Km measures the affinity of the carrier for the solute it carries; if the affinity is high then the concentration, Km will be low and vice versa. For most ions in plant tissue Km is quite low, concentrations ranging from 5–100 mM , but for sugars and other metabolites Km values are usually greater than 300 mM . Much work of this kind is summarized by Epstein (1972) who shows that at concentrations less than 0.1 mM , the uptake of a given ion is not subject to serious interference from other
common ions in solution. There is, however, competitive inhibition between related ions of similar molecular dimensions, e.g. K+ uptake is inhibited competitively by Rb+ but not by Na+ ; Ca2+ is inhibited by Sr2+ but not by Mg2+ . Thus the carriers which bind the major nutrient ions at low concentrations appear to be highly ion-selective. At higher concentrations (more than 1.0–10.0 mM ) this selectivity begins to decline. The interpretation of this observation is contentious and beyond the scope of this chapter but can be pursued in Epstein (1972), Laties (1969) and Clarkson (1974).
The limitation of the kinetic approach is that it can tell us nothing about the nature of the carrier. One can observe similar uptake kinetics for ions whose transport into the cell must be mediated by ion pumps e.g. H2 PO4 – and Cl– (see p. 48) as for ions which probably diffuse into the cell passively e.g. Na+ and Ca2+ and for those which are completely exotic and toxic, e.g. Tl4+ (Barber, 1974). Indeed, it has been pointed out that saturation kinetics of this kind would also be found if salt movement was observed across a synthetic membrane containing nothing but pores (Stein & Danielli, 1956), where the system would saturate when all of the pores were filled with solute at any moment in time; Vmax is, after all, merely a measurement of capacity to react or transport and Km is derived from it (Fig. 2.15).
2.4.5.2—
Ionophores as Lipophilic Carriers
A more illuminating approach to the nature of carriers has come from studies on the ionic conductance of synthetic membranes which have been modified in various ways. A bilayer of pure phospholipids has a very low conductance to ions, usually only 10–7 to 10–8 ohm–1 cm–2 . The addition of very small amounts of ionophores (i.e. ion-carrying antibiotics) like monactin or valinomycin to the solutions bathing the synthetic bilayer causes a huge increase in the conductance. Figure 2.16 shows that 10–6M monactin changes the membrane conductance to K+ nearly a million-fold and that even at 10–10 M its effect is quite strong. The conductance change for a given monactin concentration is greatest for K+ and for Rb+ and is much less for Na+ , Cs+ and Li+ . Monactin is, therefore, acting as a selective carrier of K+ and Rb+ and valinomycin, another bacterial product, behaves similarly. Since these two compounds differ chemically it is instructive to see what they have in common. Both of them are amphipathic ring-structured molecules which have their non-polar groups on the outside of the ring and their polar groups directed towards the space at the centre of the molecule. The outside of the ring interacts favourably with lipid while the hydrophilic core, 0.7 nm in diameter, provides room for several hydrated potassium ions to be bound. Evidence from a variety of sources shows that this complex diffuses across the membrane so that the ions never leave a polar environment (Eisenman et al., 1968).
Other substances are known which select for divalent cations, e.g. the unnamed compound A23187 which is a carboxylic acid antibiotic found in
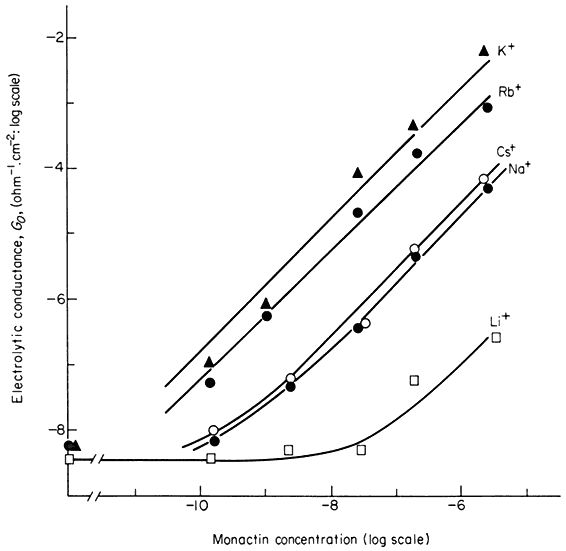
Figure 2.16
Influence of the ionophore, monactin, on the electrolytic conductance of a
phospholipid bilayer in the presence of single salt solutions of alkali cations.
(Redrawn from Eiseman et al., 1968.)
cultures of Streptomyces chartreusensis (Reed & Lardy, 1972). This compound carries Ca2+ and Mg2+ across bilayers and natural membranes but has no effect on monovalent cations.
Apart from a few synthetic analogues all of the ion-carrying antibiotics are natural products of bacteria and fungi. There are many who believe that compounds of a similar kind may act as ion carriers in all membranes but the technical difficulty of isolating what are probably minute quantities of such compounds from tissues appears to be formidable and so the belief may rest on faith for some time yet.
2.4.5.3—
Co-transport
As suggested earlier, carrier-assisted diffusion can sometimes appear to go in an 'uphill' direction, thus giving the impression of active transport. In many animal tissues and micro-organisms, sugars, amino acids, organic acids and vitamins move into the cell up a concentration gradient. This transport is, however, almost completely dependent on having Na+ or H+ in the external medium; other ions such as K+ , Rb+ or Li+ cannot be substituted. It has been
found that the metabolite is carried into the cell along with an ion-carrier complex which is diffusing 'downhill' (Fig. 2.17). In both Chlorella and Neurospora, glucose is transported in this way along with protons, H+ (Komor & Tanner, 1974; Slayman & Slayman, 1974).
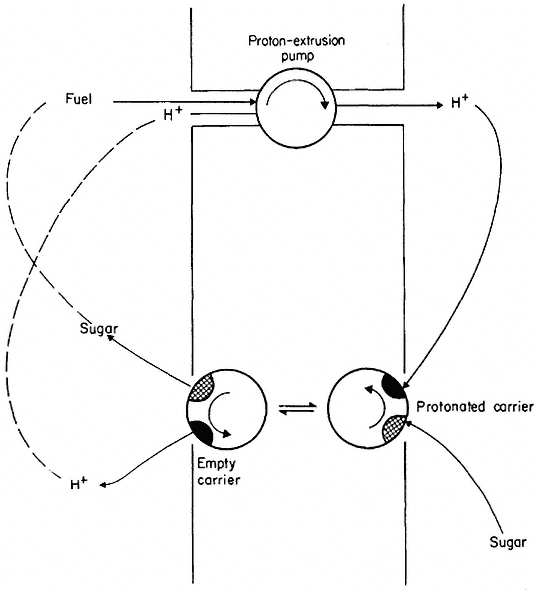
Figure 2.17
Scheme to illustrate co-transport of protons and sugar. The proton extrusion pump is electrogenic
and thus makes the inside electrically negative. Protons diffuse back into the cell passively via the
carrier which also binds a sugar molecule. The protonated carrier plus sugar diffuses towards the
inner face of the membrane where it dissociates and releases the sugar molecule.
Co-transport depends on active transport in an indirect way (as indeed does all diffusion, see p. 50) because energy-dependent extrusion pumps ensure that the cytoplasm is kept well below its equilibrium concentration in H+ and Na+ . These ions tend to diffuse back into the cell and, in doing so, decrease their free energy. The energy they give up is coupled, via the carrier, to the co-transport of the solute whose free energy is increased as it moves into the cell.
Co-transport may also assist the 'uphill' movement of inorganic ions into the cell; it may be a more common process than is generally realized. Recent
evidence by Lowendorf et al., (1974) suggests that the active transport of phosphate into the hyphae of Neurospora depends on (a) the activity of a proton extrusion pump at the plasmalemma which is sensitive to the pH of the external medium, and (b) the formation of a ternary complex between a proton and a phosphate ion from the external medium with a membrane carrier. The protonated phosphate carrier diffuses to the cytoplasmic side of the membrane down the electrochemical gradient of the proton, releasing the proton and phosphate ion into the cytoplasm. This, and other examples of inorganic ion co-transport (see Raven & Smith, 1974) suggest a reason why so little progress has been made in elucidating the molecular details of certain 'pumps' particularly of those which transport anions. Put most simply, it may be that these influx pumps do not exist and that the uphill transport is driven by a combination of active extrusion and re-entry by diffusion of protons or perhaps sodium ions.
Co-transport illustrates the ingenious way in which nature can turn necessity to its own advantage. The active excretion of H+ and Na+ is essential to maintain pH control and osmo-regulation in the cell, but the energy expended is partly recovered in the transport of essential metabolites and ions into the cell.
2.5—
Correlation of Structure and Function
Having a picture in mind of the way membranes are assembled and of the driving forces which operate across them it is now possible to consider how their design, particularly that of the plasmalemma, manages to reconcile two conflicting sets of priorities. This conflict may be summarized as follows: the cell usually contains solutes at a far higher concentration than in the external medium; without any barrier these solutes would disperse by diffusion. Many solutes are accumulated by mechanisms which consume metabolic energy and it is sensible for nature to minimize their subsequent leakage and thereby economize in the use of 'fuel'. Insulation of this type might be most effective if the cell were surrounded by a barrier impenetrable to virtually everything except water and dissolved gases. Such a barrier would, however, isolate the cell from the outside world and render it insensitive to stimulae and incapable of growth, it might eliminate its interactions with other cells in adjacent or remote tissues and prevent the excretion of harmful excesses of substances generated during metabolism. The cell membrane must provide a balance, therefore, between minimizing losses and permitting a selective interchange of substances between the cell interior and the surroundings. The balance is achieved, in many cases, by providing channels or other more elaborate carrier mechanisms whereby materials crossing the membrane may essentially by-pass the hydrophobic region.
2.5.1—
Membrane Pores and Channels
Lipid or oil is a very effective electrical insulator (it is used in high voltage underground electric cables for this purpose) and it is not surprising to find that the electrical resistance of synthetic bilayers made from pure phospholipid is very high, being 107 to 109 ohms cm2 . In nature, the current conducted across membranes is carried by ions and we can see that an unmodified lipid bilayer with such a high resistance is a poor material across which to conduct this essential current of electrolyte. It is not surprising to find, therefore that the electrical resistance of natural membranes is very much less than that of bilayers, usually lying in a wide range of 102 to 105 ohms cm2 .
As described on p. 55, lipophilic carriers can greatly reduce the resistance (and hence increase the c onductance) of synthetic membranes and may resemble the carrier molecules in membranes, but it is also widely believed that membranes contain water-filled pores which must contribute to their relatively high conductance by allowing water and selected solutes to by-pass the lipid domain of the membrane. Certain antibiotic molecules, such as nystatin, appear to condense cholesterol molecules in both synthetic (Holz & Finkelstein, 1970) and natural membranes (de Kruijff & Demel, 1974) to form pores with a radius of ca. 0.4 nm. The presence of such pores greatly increases the electrical conductance and hydraulic conductivity of the membrane. In passing we might note that many antibiotics have their effect by enormously increasing the passive permeability of cell membranes causing non-resistant cells to lose their contents or to lyse. Interest in these substances stems from the experimental evidence that cell membranes also possess pores of similar size and that the antibiotic merely induces an extreme expresssion of the normal condition.
Although the word 'pore' is often used to describe channels through which solutes and water can move, we should resist the temptation to conclude that all 'pores' are definable structural entities like the ones induced by nystatin (see above). In many instances a 'pore' may be more like a transient imperfection in membrane structure. This latter type may have a certain statistical probability but have no fixed position.
Proteins which traverse the lipid layer may give rise to hydrophilic channels or pores (see Fig. 2.5e). Indirect evidence supporting this idea comes from a study in which red blood cell membranes were exposed by deeply etching frozen cells under vacuum (Pinto da Silva, 1973). Shrinkage of the membrane surface was observed in areas overlying groups of membrane particles possibly due to sublimation of ice from within the embedded particles; for this to have occurred this water would be a free liquid in the thawed condition (cf. bound water p. 35).
The first circumstantial evidence for the existence of pores come from studies by Collander and Barlund (1933) on the permeation of the giant internodal cells of the alga, Chara ceratophylla, by a number of uncharged solutes and water. They found that in almost every case the rate of movement of a substance into a cell depended on its molecular weight and dimensions and on its solubility
in oil relative to water; substances with high oil solubility permeated most rapidly. This strongly suggested that movement across cell membranes involved the movement of the solute out of the water, its solution in lipid and subsequent diffusion through it, and its re-entry into the aqueous phase at the inside face of the membrane. The authors found, however, that several small molecules permeated the membrane far more rapidly (more than 100 times faster in the case of water) than their relative solubility in oil suggested. The upper size limit for molecules which behaved anomalously was a radius of 0.4 nm and it was suggested that the membrane was constructed as a very fine sieve containing pores of 0.4 nm radius through which water (0.25 nm radius) and certain solutes could move. Since this early work a great deal has been done and the equivalent pore radius in many plasma membranes has been confirmed as 0.4 nm (see Solomon & Gary-Bobo, 1972). It must be said, however, that some authorities are reluctant to accept that pores can provide channels for the bulk movement of water and solutes; the arguments for and against pores have been clearly discussed in Oschman et al., (1974).
There has been much discussion about whether pores admit ions, and if so, which ones. Membranes are known to control very precisely the relative rates at which various ions will diffuse across them; potassium ions will diffuse ten to one-hundred times faster than sodium. Ions in solution are hydrated by binding one or more water molecules; it requires a great deal of energy to dehydrate an ion and for this reason we should think of ions in all natural circumstances as being hydrated. Sodium binds 5 water molecules, whereas potassium binds 3, the former is, therefore, the more bulky ion whose diffusion into the narrow water filled pores would be slower than for the smaller hydrated potassium ion. On the other hand the anion chloride, which has only one water molecule in its hydration shell, diffuses much more slowly than either K+ or Na+ . This is probably due to the fact that 'pores' carry a predominantly negative charge so that cations would be attracted to them, while anions would be repelled—a small number of positively charged pores would handle the flow of anions. Polyvalent cations and anions have much more water in their hydration shells, e.g. Ca2+ has 10 and SO4 2– has 8 and it seems likely that these would be totally excluded from the pores.
2.5.2—
Ion Pumps and Membrane Substructure
It is most unlikely that the intercalated membrane particles described earlier (p. 38) are simple ion-carriers—they are much too large—but they may be ion pumps, or groups of pumps. The best evidence for this assertion comes from work on the ATPase which pumps Ca2+ across the membranes of sarcoplasmic reticulum. Racker (1972) was able to isolate this enzyme and put it back into a synthetic bilayer membrane made from soybean phospholipids, and thus reconstitute a membrane which could actively transport Ca2+ when ATP and Mg2+ were present in the medium. Working with a slightly different system
Packer et al., (1974) showed that freeze etched fractures of both the original tissue membrane and reconstituted membrane containing the purified ATPase were densely studded by numerous particles 8.5 nm in diameter. There can be little doubt that the particles were the calcium-pumping ATPase. Similar, less complete, evidence is also available for the Na+ /K+ -dependent ATPase of the red blood cell (see Branton & Deamer, 1972). There is no insuperable difficulty in repeating such observations with plant tissues but, at the time of writing there is no report that this has been done.
One should not conclude that all of the membrane substructure is concerned with solute transport, especially in mitochondria and chloroplasts where other biochemical activities are centred on membranes.
2.5.3—
Endocytosis and Vesicular Transport
The presence of abundant vesicles in the vicinity of the plasmalemma of plant cells has been pointed out earlier (p. 44); however, it is not yet clear what contribution endocytosis makes to the total solute transport across this, or any other membrane. There is kinetic evidence from several sources which is consistent with the notion that a measurable fraction of various ions in the cytoplasm of plant cells is sequestered into a compartment separate from the bulk of the cytoplasm. MacRobbie (1969) found that labelled Cl– transported into the vacuole of Nitella translucens could be easily resolved into a fast and a slow component. The fast component was envisaged as being delivered to the vacuole formed in vesicles which had been found at the plasmalemma. The chloride ions in these vesicles would not have mixed with the unlabelled chloride in the bulk cytoplasm, whereas labelled Cl– delivered directly to the cytoplasm via a pumping mechanism would have to mix with a much larger pool of unlabelled chloride ions. At the beginning of the experiment, therefore, the labelled Cl– in the vacuole increased more rapidly than expected. There are other examples of this kind discussed in MacRobbie (1971) and Baker and Hall (1973).
If the vesicles contained nothing more than a small volume of the outside solution, their net contribution to the solute content of the cell would be very small and they could not exercise the ion-selectivity which characterizes cell membranes. Baker and Hall (1973) suggest that endocytosis becomes a much more plausible transport process if it is assumed that ions become selectively bound to the membrane surface and thus become concentrated from the dilute external medium. This assumption is entirely reasonable because both proteins and phospholipid heads can provide ion-selective binding sites. These authors also relate membrane-bound ATPase activity with the subsequent invagination of the plasmalemma to form a vesicle but this implies that vesicle formation is energy-dependent. This is against the substantial evidence from animal cells which shows that micro-vesicle formation results from Brownian movement of the membrane and does not need to be energized by ATP (Casely-Smith, 1969); ATP is required for the very large vesicles formed by re-orientation of micro-
fibrils in phagocytosis, but the type of vesicle under discussion here is much smaller, probably 70–100 nm in diameter and is not dependent on microfibrils. There is visual evidence that these micro-vesicles can discharge their contents directly into lysosomal vacuoles (Casely-Smith & Chin, 1971).
The important advance of thinking required to deal with endocytosis will provide a severe strain on biophysical theorists accustomed to thinking of cells as homogeneous phases separated by diffusion barriers, partly because materials can reach the interior of the cell without crossing a membrane at all. Although endocytosis is probably a common phenomenon it is likely to remain an 'unknown quantity' until new experimental techniques are devised.
2.5.4—
Concluding Remarks
In the light of recent discoveries we must discard the notion that membranes are neat semi-crystalline rigid lattices in favour of a more dynamic view. The diffusion of large protein molecules in the plane of the membrane emphasizes its fluid character and we see that there may be great heterogeneity both in the lipid matrix and in the proteins embedded in it. In the past it is possible that we have over-emphasized the importance of electrostatic interactions between phospholipid heads and underestimated the role of the surrounding polarized water layers in maintaining the familiar bilayered arrangement of membranes.
This more 'fluid' view of membranes has influenced the way in which we think about transport processes and diffusion, particularly those workers with interests in endo- or pino-cytosis. It seems probable that some of the processes which have hitherto been accepted as active transport may be, in reality, examples of co-transport which ultimately depend on the active transport of some other ion. This would allow a simplification of the model of the cell membrane which at present is uncomfortably cluttered by numerous hypothetical ion-pumps. Perhaps in time we shall be able to reduce this picture to one or two pumps and many smaller carrier molecules in a membrane which constantly cuts off vesicles from its undulating surface.
Further Reading
MEMBRANE STRUCTURE AND COMPOSITION
Branton D. & Deamer C.W. (1972) Membrane Structure. Springer-Verlag, New York/Wien.
Capaldi R.A. (1974) A dynamic model of cell membranes. Scientific Amer.230, 26–34.
Lucy J.A. (1974) Lipids and membranes. FEBS Lett. 40, S105–S111.
SYNTHETIC LIPID BILAYERS AND ALLIED STUDIES
Eisenberg M. & McLaughlin S. (1976) Lipid bilayers as models of biological membranes. Bioscience26, 436–43.
Goldup A., Okhi S. & Danielli J.F. (1970) Black lipid films. Recent Prog. Surface Sci.3, 193–260.
MEMBRANES AND TRANSPORT PROCESSES
Anderson W.P. (ed.) (1973) Ion Transport in Plants. Academic Press, London and N.Y.
Baker D.A. & Hall J.L. (1973) Pinocytosis, ATPase and ion uptake by plant cells. New Phytol.72, 1281–89.
Higinbotham N. (1973) The mineral absorption process in plants. Bot. Rev.39, 15–69.
Raven J.A. & Smith F.A. (1974) Significance of hydrogen in transport in plant cells. Can. J. Bot.52, 1035–48.
Sleigh M.A. & Jennings D.H. (eds.) (1974) Transport at the Cellular Level. Symposium 28, Society for Experimental Biology. Cambridge University Press.