Chapter 7—
The Electronics Industry
Out of the historical roots described in chapter 4, there emerged in Southern California after about the mid-1950s one of the largest and most dynamic electronics manufacturing complexes in the United States, with a multifaceted focus on computers, military and space communications equipment and avionics, and a diversity of components from printed circuit boards to advanced semiconductor devices. The development of the industry has been much encouraged by federal defense spending, both in the form of direct procurements as well as indirectly via the industry's provision of crucial inputs to the aircraft, missile, and space sectors. There is now also a rapidly expanding segment of the electronics industry in the region that is focused on purely commercial markets.
Growth and Spatial Structure
The Statistical Record
For the period from the late 1950s to 1987, the electronics industry is definable in terms of three three-digit SIC categories, namely, SIC 357 (office and computing machines), SIC 366 (communications equipment), and SIC 367 (electronic components and accessories). After 1987, a large proportion of SIC 366 was reassigned to SIC 381 (search and navigation equipment), and thus for more recent years, SIC 381 is
| ||||||||||||||||||||||||||||||||||||||||
added to the other three sectors to make up a composite electronics sector.
These definitions of the electronics industry admittedly leave much to be desired. However, the designated sectors are overwhelmingly focused on the high-technology segments of the industry; and for the period covering the 1960s, 1970s, and 1980s, more detailed four-digit categories provide at best only a discontinuous data series for the counties of Southern California. On the basis of a rough estimate, SICs 357, 366, and 367 accounted for some 90 percent to 95 percent of all electronics employment in the region in 1986. With 13.4 percent of the nation's total employment in these three sectors, Southern California ranks as one of the major centers of electronics production anywhere in the world.
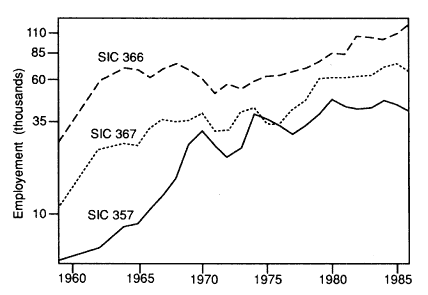
Throughout the postwar period from the 1950s to the 1980s, the electronics industry of Southern California has grown continually in terms of employment and number of establishments, except for periodic downturns corresponding to economic recessions or cutbacks in federal defense spending. Table 7.1 shows the number of establishments and employment totals in the industry as a whole in Southern California from 1959 to 1986. Over this period of time, the definitions of the three SIC categories that make up the electronics industry for the purposes of this study remain internally consistent. The number

Figure 7.1
Employment in SIC 357 (office and computing machines), SIC 366 (communications
equipment), and SIC 367 (electronic components and accessories) in Southern
California, 1959–1986. (Data from U.S. Department of Commerce, Bureau of the
Census, County Business Patterns . The data shown represent aggregates for
the seven counties of Southern California. Occasionally, County Business
Patterns suppresses data for particular sectors in particular counties; where
this is the case, employment has been estimated from the interval data provided
by the source.)
of establishments grew from 316 to 1,796 over the designated time period, and total employment grew from 43,517 to 233,230. Rates of growth have tended to decrease somewhat in recent years by comparison with rates that prevailed in the 1950s and 1960s, though even over much of the 1980s expansion remained remarkably vigorous.
In figure 7.1 this pattern of growth is broken down by sector. The industry's early growth in the 1950s is based primarily on the production of communications equipment (SIC 366), with electronic components and accessories (SIC 367) growing strongly in the 1960s, and with office and computing machines (SIC 357) moving briskly ahead after the late 1960s. Since the early 1970s, all three sectors have expanded rapidly more or less in parallel with one another. In combination with the aerospace industry, they form a complex of productive activities comprising a core of large systems houses locked into a network of innumerable smaller specialized producers and subcontractors. Systems-house manufacturing is especially strongly developed in
the communications equipment sector, where outputs often consist of large-scale R&D-intensive one-of-a-kind or small-batch products for particular military or space programs.
The Changing Spatial Pattern
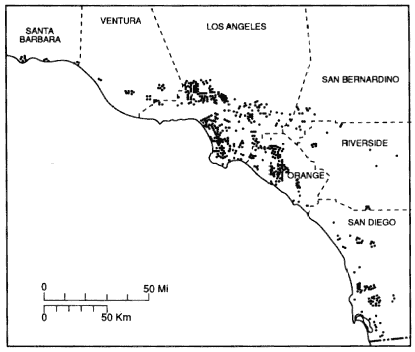
The industry's overall record of growth is superimposed upon a constantly shifting locational structure, involving above all the steady decentralization of the industry from Los Angeles, and its locational recomposition within a series of high-technology industrial districts in the outer cities of the region. Even so, as shown by table 7.2, Los Angeles County remains the regional hub of the electronics industry. Orange and San Diego counties come second and third in order. They are followed in turn by Ventura and Santa Barbara counties, which are beginning to evince strong signs of new high-technology industrial district formation. Riverside and San Bernardino counties have remained over the entire postwar period somewhat unreceptive to high-technology industrial development, possibly because of their older and more traditional industrial base anchored in steel, metalworking, and machinery manufacture. However, this base has declined rapidly in recent years, and definite signs of new high-technology industrial growth are now increasingly evident in these latter two counties. All of these shifting locational structures may be more clearly apprehended by reference to maps of individual establishments within the study region (figs. 4.3, 7.2 and 7.3).
In 1955, as revealed by figure 4.3, the electronics industry was largely confined to three major districts, one of which corresponds to the original locational base of the small prewar electrical industry close to the central business district of Los Angeles, with the other two more or less coinciding with the early geographical concentrations of the aircraft industry. The first of these lies to the west of the Los Angeles basin, stretching from Santa Monica in the north to El Segundo in the south; the second is situated in the Burbank-Glendale-North Hollywood area in the eastern San Fernando Valley.
Figure 7.2 shows that by 1972 the electronics industry in the central area of Los Angeles was beginning to thin out, though the two districts in Santa Monica-El Segundo and Burbank-Glendale-North Hollywood are still at this time important centers of the industry. Also, three major high-technology industrial districts in the outer cities of the region emerged over the 1960s and early 1970s, and
| |||||||||||||||||||||||||||||||||||||||||||||||||||||||||||||||||||||||||||||||||||||||||||||||||||

Figure 7.2
The electronics industry (SIC 357, 366, and 367) in Southern California, 1972.
One dot equals one manufacturing establishment.
these attracted a large complement of electronics manufacturing establishments. These districts are located in Orange County (and above all in the area in and around Irvine), the westward extension of the San Fernando Valley cluster into Chatsworth-Canoga Park, and the northern suburbs of San Diego where a small but very active electronics complex focused on components and computers was beginning to take shape in the early 1970s.
Figure 7.3 shows the situation in 1988, which represents a continuation of the trends already noted in figure 7.2. The thinning out of electronics establishments in the central area of Los Angeles continues, and is even evident in a small way in the two inner districts of Santa Monica-El Segundo and Burbank-Glendale-North Hollywood. By contrast, the high-technology industrial areas in Orange County, Chatsworth-Canoga Park and San Diego have grown conspicuously in comparison with the pattern for 1972. There is also evidence of new industrial district formation in Santa Barbara and Ventura counties as

Figure 7.3
The electronics industry (SIC 357, 366, and 367) in Southern California, 1988.
One dot equals one manufacturing establishment.
well as in the Irvine Spectrum development to the southeast of the main Irvine Business Complex.
With these preliminaries in mind, we now look in some detail at the employment and linkage structures of a sample of electronics manufacturers in Southern California. The data for this phase of the analysis were collected by means of a questionnaire survey, and before we proceed further a few comments are in order about the design of the survey.
Specifications of a Questionnaire Survey
The questionnaire survey of electronics manufacturers in Southern California was carried out in late 1988 and early 1989. The questionnaire form itself comprised four pages of detailed queries on such matters as production processes, outputs, sales volume, upstream and downstream linkages, subcontracting activities, and employment.
An attempt was made to send a questionnaire to all electronics producers in Southern California, including both single-establishment firms and the individual establishments of multiestablishment firms. The questionnaire was mailed to a total of 2,993 establishments gleaned from a variety of directories, but principally from the yellow pages telephone directories for the many different communities of Southern California. Out of the total set of questionnaires dispatched, a total of 110 were returned by respondents, of which however only seventy-three (66.4 percent) turned out to be bona fide electronics manufacturers. In addition, 290 questionnaires were returned by the post office as undeliverable. If we assume that 2,703 questionnaires were actually delivered and that 66.4 percent of these represent genuine electronics manufacturing establishments, then the total response rate is 4.1 percent. This is an unusually low response, even for this kind of survey, where response rates are more often in the general area of 10 percent to 15 percent.
Part of the reason for the low rate no doubt lies in the circumstance that the questionnaire was not only long and complex, but also asked for much detailed proprietary information; part perhaps is due to the large numbers of very small establishments in the electronics industry, often run under sweatshop conditions and owned by immigrant entrepreneurs. In fact, as suggested by table 7.3, the size distribution of sampled electronics manufacturers is significantly biased against small establishments in comparison to the corresponding distribution of all electronics manufacturers in the region. A Kolmogorov-Smirnov one-sample test of the two distributions displayed in table 7.3 indicates that they differ from one another at the 0.05 level of significance. Because of these manifest problems of the sample, the analysis that now follows should be treated with some circumspection. Nonetheless, the general results of the analysis seem reasonable enough, and they are consistent with the general weight of evidence that is offered elsewhere in this book.
Employment Structures
At the present time the electronics industry of Southern California employs about a quarter-of-a-million workers, almost all of them in nonunionized establishments. According to the sample survey, 24.7 percent of the workers in the industry are engaged in managerial and R&D occupations, and 55.4 percent are engaged in manual produc-
| ||||||||||||||||||||||||||||||||||||||||||||||||||||||||||||||||||||||
tion work. Of the latter workers, more than half are members of minority ethnic or racial groups (table 7.4). At the same time, 43.7 percent of all production workers are female. These simple data suggest at once that local labor markets in the Southern Californian electronics industry tend to be split into rather distinctive upper and lower tiers with the lower tier formed dominantly by immigrants and women.
Over the last few decades large numbers of immigrants (often undocumented) have moved steadily into the Southern Californian electronics industry, and they now perform the majority of all assembly and fabrication work (cf. Fernandez-Kelly 1987). As shown by table 7.4, Hispanics represent the largest ethnic group in the industry, and they account for 29.3 percent of production worker jobs among sample establishments on a simple average basis. Asians (particularly Vietnamese) form the next major group, with 18.4 percent of production worker jobs, and this group is now expanding at a particularly rapid
| ||||||||||||||||||||
rate. African-Americans constitute only a small minority (3.6 percent) of production workers. Observe that on a weighted average basis the percentage of Hispanics among production workers falls to 22.8 percent and the percentage of African-Americans rises to 10.4 percent, signifying that Hispanics are proportionally overrepresented in small establishments and African-Americans in large. This finding may possibly be an outcome of a certain preference by small employers for illegal immigrants (among whom Hispanics predominate) thus displacing many African-Americans except in the large establishment segment of the industry where greater concern for legality and affirmative action programs is more likely to prevail.
Two additional significant items of information were revealed by the questionnaire. One is that levels of part-time and temporary employment in the electronics industry are very small, for on average only 2.9 percent of all production workers at sample establishments are involved in part-time work, and only 3 percent are involved in temporary work. The other is that labor turnover among production workers is on the whole, and as expected, extremely high. Layoff and recall rates in excess of 25 percent a year are recorded respectively for 39.7 percent and 49.2 percent of sample establishments; and rates in excess of 50 percent are recorded respectively for 17.5 percent and 31.7 percent of establishments. These data reveal that there is a rapid rotation of production workers through the local job system. As Angel (1989) has suggested in a study of the semiconductor industry in Silicon Valley, high levels of turnover may also be expected to occur for many classes of scientific and technical workers in high-technology industrial districts. The phenomenon of high turnover accentuates
| ||||||||||||||||||||||||||||
locational agglomeration by placing a premium on information and accessibility to alternative employment opportunities. The agglomeration economies of the region are yet further enhanced by the presence of large pools of habituated and socially differentiated workers in both upper and lower labor-market segments.
The Logic of Interestablishment Linkages
General Patterns of Purchases and Sales
One of the objectives of the questionnaire survey was to discover to what degree electronics establishments in Southern California are linked to the local economy, and to what degree they are linked to a geographically wider circle of input providers and customers. Respondents were therefore asked to indicate (a) what percentages of their total purchases come from within fifteen miles of their establishment, and what from within Southern California as a whole, and (b) what percentages of their total customers are located within the same two spatial ranges. Summaries of the results of this query are displayed in tables 7.5 and 7.6. Both tables have been constructed by first of all grouping respondents into one of two size categories and then averaging the results over each category, where the dividing line between categories is defined as the median value (i.e., $2 million) of the annual sales volume of all establishments in the sample. Also shown in both tables are the numbers of establishments providing information used in calculating the average percentages.
| ||||||||||||||||||||||||||||
These two tables indicate that both small and large establishments are strongly linked in their upstream and downstream transactions to the local economy, though there are three important nuances to this judgment that need to be expressed. First, electronics establishments in Southern California do approximately one-third to two-thirds on average of their business with other firms in the same region; and they do significant amounts of business even with firms located within a narrowly defined circle of fifteen miles radius of their own locations. Second, as was observed in chapter 5, small establishments have more localized linkages than large, and in the case of sales linkages this discrepancy between the two groups is statistically significant at the 0.05 level by a test of the difference of means. Third, the pattern of purchases seems in general to be more spatially limited than the pattern of sales, though the differing measurements of these two variables make it necessary to append reservations to this remark. Oakey (1984) has noted parallel contrasts between the purchasing and sales patterns of high-technology firms in other regional contexts. Notwithstanding these differences between the upstream and downstream linkage structures of sample establishments, the correlation coefficients laid out in table 7.7 indicate that when an establishment has strong backward linkages to the local economy, it is likely also to have strong forward linkages. In addition, we find a simple correlation of 0.33 between (a) the percentage of any establishment's purchases that come from its top three suppliers and (b) the percentage of the same establishment's sales that go to its top three customers. For thirty-nine sample observations
| ||||||||||||||||||
this correlation is moderately significant at the 0.05 level. This observed relationship suggests that when an establishment's purchases are spread out over a large number of suppliers, its sales are likely to be similarly spread out; and when its purchases are concentrated on only a few suppliers, so too will its sales pattern be concentrated. Thus, when establishments are locked through their linkages into the local agglomeration, they are typically bound in both upstream and downstream directions.
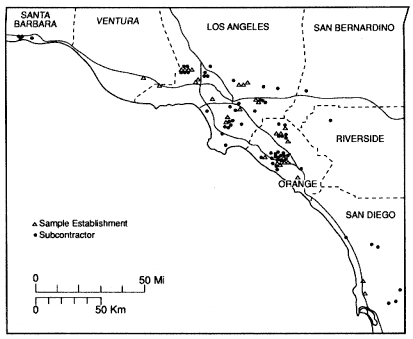
One common and very important form of interestablishment linkage in the electronics industry of Southern California involves subcontracting activity in the form of the putting out and taking on of work. On average, sample establishments put out work to the value of 15.4 percent of total sales, and they take on work to the value of 20.2 percent of sales. In the questionnaire, respondents were asked to specify the individual locations of the top three subcontractors to whom they put out work. Figure 7.4 and table 7.8 summarize the responses that were received to this question. Figure 7.4 portrays the close locational symbiosis that exists between many electronics producers and their main subcontracting partners. Table 7.8 confirms this tendency by indicating that both small and large establishments in the sample overwhelmingly choose their major subcontracting partners from the local area. Large establishments have a somewhat lower propensity to use local subcontractors than small ones do, but there is no statistically significant difference between the two groups of establishments in this regard.

Figure 7.4
Location of sample electronics establishments and the major subcontract firms
that received work.
Modes of Transacting
In the questionnaire, an attempt was made to complement the data gathered on linkage structures with additional information on modes of transacting business. Specifically, respondents were requested to indicate the percentage of time allocated to different modes of transacting in the negotiations leading up to the sale of both a standard catalog item and a piece of subcontract work. The modes specified were telephone, face-to-face contact, mail, telex/fax, and other. Table 7.9 provides simple and weighted averages of responses to this question, where the weighted averages are computed in relation to the total sales volume of each establishment.
The data set out in table 7.9 reveal that telephone and face-to-face contact are by far the most common modes of transacting for both catalog item sales and subcontract sales. The telephone dominates for catalog item sales, but face-to-face contact becomes just as important, if not more so, when subcontract work is involved. As subcontracting
| ||||||||||||||||||||||||||
| ||||||||||||||||||||||||||||||||||||||||
usually entails considerable discussion between both parties about design specifications, materials, and ways of proceeding, it is not surprising that a particularly transactions-intensive mode of communication is generally resorted to in this instance. It is worthy of note that the weighted average allocation of time to face-to-face contact for the sale of subcontract work is distinctly larger than the corresponding simple average, which suggests that large electronics producers tend to have
more transactions-intensive subcontract relations than small. Mail, telex/fax, and other modes of communication are evidently of much less significance in terms of time allocation than the telephone and face-to-face contact.
Linkages and Location
The preceding discussion has demonstrated that both the upstream and downstream linkages of electronics producers in Southern California are highly localized, especially for smaller establishments, and that these linkages involve significant levels of transactions-intensive interaction between different producers. These characteristics of the local electronics complex are almost certainly interrelated with one another, in the sense that high spatially dependent transactions costs encourage locational agglomeration and discourage locational dispersal. Moreover, with deepening fragmentation of the local manufacturing system into increasingly specialized subsectors of production—thus leading to yet further transactional activity—the observed tendency of the entire system to agglomeration within a series of specialized industrial districts is reinforced. Within these districts, the clustering of small establishments is especially intense.
Despite the revealed biases in the sample data, these qualitative conclusions seem robust enough, especially if we take into account their consistency with the other bodies of evidence set forth throughout this book. Obviously, however, the sample data do not allow us to make stronger or more extended generalizations than these about the broad structure of electronics production activities in the region.
Conclusion
The electronics industry of Southern California has grown vigorously since World War II, and together with the aerospace industry, with which it is functionally and spatially allied, it constitutes one of the primary engines of the impressive expansion of the Southern Californian economy over the last few decades.
The peculiar pattern of development and growth of the industry in Southern California can in large part be understood in terms of the extremely high levels of federal defense spending that have been directed over a long period of time to the region, together with a series of employment and organizational attributes that have encouraged much
specialization and agglomeration of the industry. These attributes involve on the one side, the emergence of large, multifaceted, and rapidly rotating local labor markets to which firms gain maximal access through mutual locational convergence, and on the other side, a proliferation of localized interfirm transactional relations binding the entire complex into a functionally integrated system. These transactional relations are very probably reinforced by the increasing tendency of many kinds of electronics firms, even small ones, to enter into joint ventures and strategic alliances with one another (cf. Gordon 1991).
Today, the electronics industry in Southern California is spatially organized in a series of dense agglomerations rooted in the west-central and northwestern sections of Los Angeles County as well as in the outer cities of the region. We must not lose sight of the fact that the electronics industries of Southern California are currently much buffeted by intensifying foreign competition, especially from Japan and the newly industrializing countries of East and Southeast Asia. They are also inserted into national and international systems of economic interaction, involving both the active relocation offshore of large standardized units of production (such as assembly plants), and the worldwide search for specialized inputs and markets. With increasing liberalization of U.S.–Mexican trade under the North American Free Trade Agreement, these problems are likely to be exacerbated by shifts of some kinds of low-wage electronics producers (in such subsectors as assembly subcontracting or printed circuit board production) to the Mexican side of the border. As in the cases of the aircraft industry and the missile and space industry, serious policy questions are raised by all such issues as these, and we shall return to them toward the end of this book.