5—
Birth Order, Intellectual Ability, and Educational Attainment
If family size bears a negative relation to both cognitive ability and educational attainment, is this effect mitigated, on average, by birth order? Are there systematic birth-order effects (over and above sibsize effects) that would lead us to modify our results so far? In this chapter, we will consider intellectual ability and educational attainment separately in relation to birth order. This separate treatment is necessary because our theoretical expectations differ somewhat as between the two dependent variables, the confounders are not identical, and our measures of intelligence are for children whereas our educational data are for adults. In each case—intellectual ability and educational attainment—we will first discuss what we expect theoretically, and then present an outline of frequent and important confounding factors as they have related to prior research. We will then turn to our own analysis.
Theoretical Expectations about the Relation of Birth Order and IQ
There have been numerous reviews of the research on birth order and intelligence, as well as other dependent variables (Jones 1931; Sampson 1965; Kammeyer 1967; Adams 1972; Schooler 1972). All of these reviews emphasize that the literature on birth order is not distinguished by systematic theoretical expectations. Rather, much of it has involved the unexpected "discovery" of some birth-order difference and, then, an ad hoc effort to explain it (Kammeyer 1967). Thinking in terms of intellectual ability or achievement (as
distinct from personality characteristics, or psychological variables), have we any reason to expect birth-order differences? This attempt to outline possible reasons takes as a given that the data are not for actual siblings. Rather, the data sets must be thought of as pertaining to individuals from different families.
Reasons for Expecting Birth-Order Differences in Intelligence
I. Purposive differences in parental treatment
This reason presupposes that parents would intentionally treat children of different birth orders differently so that the results would be systematic over samples of populations. In modern circumstances, it is difficult to imagine that this would occur and, hence, it seems improbable to expect that the oldest child, for example, would be systematically favored, or a younger one ignored, to a degree that would affect IQ.
II. Patterned circumstantial differences, over the family cycle, in parents' biological capacity for reproduction, in dilution by other children of parents' resources, or in siblings treatment of each other.
i. Biological capability of parents. Later-born children occur to older parents who may have some DNA impairment, or other impairment associated with prior childbearing or age. In addition, being older, parents may have less energy for interaction and stimulation of later-born children.
ii. Dilution by other children of parents' resources. Children of particular birth orders may be uniquely favored or disfavored regarding, in particular, parental attention and interaction and, hence, motivation to learn.
|
|
iii. Contribution of siblings to the child's environment. Clearly, siblings cannot be thought of only as detractors from parental resources. Having brothers and sisters may constitute a positive contribution to a child's environment and learning, and this contribution may vary systematically according to the child's position in the birth-order hierarchy.
|
|
Even this brief outline of superficially reasonable expectations about birth-order effects on intelligence points up how conflicting and mutually offsetting many of these possible effects may be. If we were to add expectations concerning possible sex differences to our outline, it does not take much imagination to recognize that we have no very good reasons for expecting highly patterned ability differences by birth order. Insofar as investigators derive such expectations from a priori hypotheses, such a derivation comes from systematically ignoring or overlooking countervailing expectations that could be considered equally plausible. It is hardly surprising, therefore, that most thinking about birth order and ability has emanated from adventitious "discoveries" of birth-order differences in empirical data.
Possible Confounders in the Analysis of Birth-Order Differences in Intelligence
The analysis of birth-order differences in intelligence is not only beset by weak theory regarding the determinants of this presumed association, but it is also subject to weak theory concerning a large number of potential (and powerful) confounders when an apparent association is discovered. Although these confounders are not uniquely mysterious and arcane, they have frequently been overlooked because of the relatively casual and ad hoc approach to birth-order effects already noted in our discussion of predictors of birth-order differences. Investigators become interested in birth order when an "effect" turns up and happens to be startling. It is then relatively simple to weave an "explanation" out of some assortment of the advantages and disadvantages we have just discussed. It is seldom appreciated by researchers that expanding the sibsize distribution to a sibsize–birth-order matrix involves a level of specificity regarding, for example, the ages of parents and the periods of their lives during which particular children are born and reared that may be averaged out when one looks at sibsize alone.
It is hardly surprising, therefore, that research on birth order
and intelligence has produced perplexing disagreements concerning whether a birth-order effect exists and, if there is such an effect, what is its nature (for example, see, Jones 1931; Anastasi 1956; Sampson 1965; Adams 1972; Schooler 1972; Berbaum, Markus, and Zajonc 1982; Galbraith 1982a , 1982b , 1982c ; Ernst and Angst 1983). As we shall see, it is easy to be victimized by confounding factors, and exceptionally difficult, given the data available, to avoid all of them. As a start, we shall attempt to systematize some of the major confounding elements in the study of birth-order effects. A share of these confounders have been recognized in a scattered fashion in the literature, but some, I believe, have not been noted before.
Outline of Confounding Factors in the Analysis of Birth Order
1. The prevalence fallacy
2. Absence of controls for sibsize
3. Period effects
4. Parental background differences by birth order
5. Parental background differences by sibsize
6. Differences in child-spacing
7. Selection biases:
a. Age truncation biases
b. School-grade attrition biases (for example, seniors in high school do not include high school drop-outs who may differ from seniors in sibsize and birth order)
c. Other selection biases.
We may now consider each of these confounders in detail.
The Prevalence Fallacy
Probably the most obvious problem with some of the more striking findings on birth order is the bias introduced by looking at the proportionate prevalence of a particular birth order, or birth orders, in a selected group—for example, people of eminence or great talent, students taking a particular test, or those entering college at a particular time (for a discussion, see, Price and Hare 1969; Schooler 1972). All such research concludes that "x percent of persons who have a particular characteristic (eminent men, or
college entrants, or students having IQs of 140 or over) are of a given birth order (firstborn, last born, and so forth) and that, therefore, this birth order is highly desirable." Such prevalence studies with results sufficiently startling to report are subject to the bias of an excess of the birth order in question in the underlying population. Thus, to take college entrants in 1965, for example, a marked excess of firstborns is due to at least two major biases: On average, these students will be 18 years old and hence have a high probability of having been born in 1947—a year of the highest proportion of first-order births in our recorded past. Moreover, college students come from small families (disproportionately) and, hence, from families in which first-order births make up a high proportion of all births. So, not only will college entrants in 1965 share a disproportionate "firstborn-ness" with all 18-year-olds, but the small sibsize bias among middle- and upper-class young people will further potentiate the birth-order bias. As Schooler (and likewise Price and Hare) emphasize, the problems of bias in such prevalence studies remove all such "findings" from serious consideration.
From here on out, therefore, our discussion will relate to studies that involve the computation of values of a dependent variable by birth order and that compare the results for different birth orders. However, even when we thus avoid the prevalence fallacy, we are far from out of the woods regarding confounders.
Absence of Controls for Sibsize
As with many areas of scientific inquiry, knowledge is far from linear in birth-order research. Although it has long been recognized that, without a control for sibsize, birth-order effects will be confounded with sibsize effects (Jones 1931), this error continues to be made from time to time. For some recent examples, the reader may refer to Record, McKeown, and Edwards (1969) and King and Lillard (1983), in which sibsize effects are interpreted as birth-order effects.
Period Effects
The fact that children of different birth orders appear and are reared at different times in the parents' lives may mean that such children are subjected to markedly different economic and social
conditions as they mature. This may be particularly true for children from large families, but it can occur in small families as well during periods of rapid social and economic change. It seems reasonable to assume that such marked differences in environment might affect children through effects on their parents and on the latter's ability to provide a good learning environment. For example, if in 1968 one decides to study a sample of 18-year-olds, those from families of, say, six children will have experienced quite different periods in the U.S. economy depending on whether they are the oldest or the youngest. The oldest in one family, born in 1950, will come from a family that started its childbearing and childrearing during boom times economically—from 1950 onwards. But the youngest from another family—also born in 1950—will come from a family that started its childbearing and rearing around 1930—during the Depression. The following diagram may help to clarify this point.
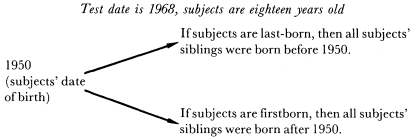
On the one hand, the confounding effects of a specific period are, of course, exaggerated in studies where individuals of only one age (or a very narrow age range) have been included—age truncation bias—since everyone has been subjected to the same historial event (being of the same age and the same cohort). On the other hand, the period effects are easier to isolate (once the investigator is aware of them) when the age range of the subjects is narrower. Nonetheless, the exact pinpointing of period effects may be difficult unless one has fairly precise information on child-spacing and the interval between the parents' marriage and the birth of the first child.
A good example of what appear to be systematic period effects interpreted as birth-order effects may be found in the data from Breland's study of National Merit Scholarship Qualifying Test takers and Belmont and Marolla's data on young Dutch males
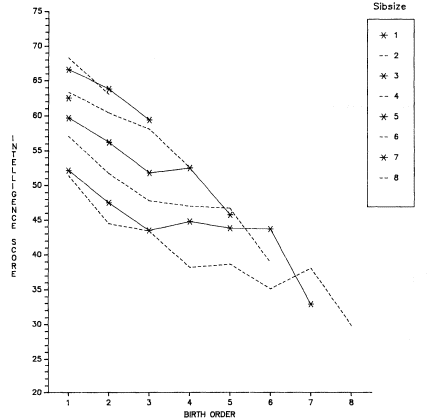
Figure 5.1.
T-Scores on Raven Progressive Matrices Test by Sibsize and Birth Order
among 386,114 19-Year-Old Dutch Males Who Were Survivors of Children
Born during 1944–1947. Data from Belmont and Marolla (1973). Scores
have been restandardized with a mean of 50 and standard deviation of 10.
(both of which have been referred to previously). Both studies show a marked decline in intellectual performance by birth order within sibsize (figs. 5.1 and 5.2).[1] A share of this decline is doubtless due to differences in parental education by birth order (to be discussed shortly). In addition, the last-born children in the Dutch study suffered unique problems (also to be discussed). But, a share is also quite probably due to period effects to which both studies are particularly vulnerable since both concentrate on a highly restricted
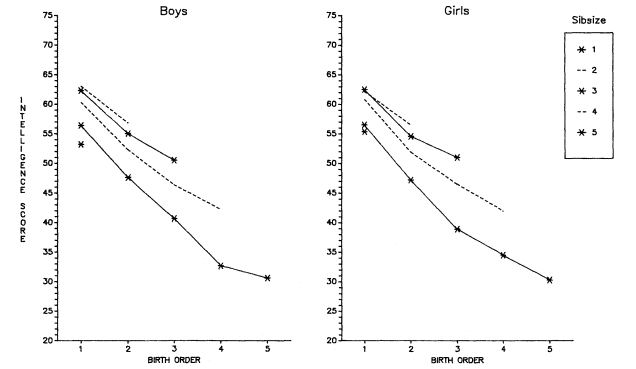
Figure 5.2.
T-Scores on National Merit Scholarship Qualifying Test by Sibsize and Birth Order among
794,589 Eleventh-Grade Boys and Girls, United States, 1965. Data from Breland (1974).
Scores have been restandardized with a mean of 50 and standard deviation of 10.
age grouping (17-year-olds in Breland's case and 19-year-olds in the Belmont and Marolla case). In fact, since the Breland youngsters were, on average, born in 1948, and the young Dutch men were born in 1944–1947, the economic period effects were similar. The oldest (firstborn) children were born to families that were beginning after the Depression, and as World War II was ending or over. On average, the families thus enjoyed improving circumstances as the youngsters were growing up. The later-born children (particularly those in large families) were born to parents whose reproduction started many years earlier—at the beginning of (or during) the Depression. Thus, most of the childbearing and rearing of the families of these later-born children occurred in unfavorable circumstances. It is unlikely that such circumstances left these families in a highly advantaged position to do well by their youngest children. Thus, as we see in figures 5.1 and 5.2, higher-order births do less well than lower-order ones—for period reasons among others.
Parental Background Differences by Birth Order within Sibsize and over All Sibsizes
The introduction of birth order as a variable necessitates controlling for differences in parental age (and, hence, most probably parental educational attainment) by birth order within sibsize. For example, in a group of 18-year-olds, all of whom are being studied in 1968, those who are the oldest of a family of six siblings were born to parents who started childbearing when the subject individual was born—1950. The youngest child in a family of six among these 18-year-olds was born to parents who completed childbearing in 1950, and who may have started it 20 years earlier, in 1930. Since, in most Western countries including the United States, educational levels of the population were rising over that time period, these young people's parents represent very different educational cohorts. If one does not control for the parents' educational levels among birth orders one may be simply measuring the effects, not of birth order, but of parents' educational differences within the same sibsize. Again, since parents' socioeconomic status was not controlled in either the Breland or the Belmont and Marolla data, the marked decline by birth order within sibsize of the intellectual scores would
appear to be in part a result of differential parental education—especially among children from large sibsizes. This differential may be added to the period effects already noted.
As has been noted previously, there are important parental background differences by sibsize. In looking at birth order, it is not sufficient to control for parental background differences by birth order within each sibsize; one has to control over all sibsizes as well. In other words, one must control for parental background differences among second-born children across all sibsizes containing such children, and the same is true of third-born, fourth-born, and so forth, rather than solely controlling for background differences between birth orders within each sibsize. If this is not done, the relative values by sibsize will be affected and, in particular, the position of the only child may be downgraded relative to children from other small families. The lack of controls for parental socioeconomic status over sibsizes in both the Breland and the Belmont and Marolla data may account for the unusual position of the only child in both studies, as we have already noted.
Differences in Child-Spacing
Theoretically, child-spacing differences may be confounded with birth-order differences, if systematically biased variations in child-spacing by birth order occur. For example, this confounding would take place if last-born children characteristically appeared after a longer interval than children of other birth orders. In practice, it seems unlikely that such systematic spacing differences by birth order would occur over large samples. This is particularly true for younger subjects in the United States since child-spacing itself has become much less variable than in the past. Infant mortality and breastfeeding (which created "spaces" in the past) have declined, and family planning has led to a purposive concentration of childbearing with a sharply defined ending point (Whelpton, Campbell, and Patterson 1966; U.S. Bureau of the Census 1976; Bumpass, Rindfuss, and Janosik 1978). Women have begun childbearing in their late teens and early twenties, and most have curtailed it before age 30. However, insofar as differential child-spacing does exist, certain kinds of samples may lead to systematic child-spacing effects that can show up as birth-order effects. This problem is evident in age-truncation biases to be discussed in the next section.
Selection Effects
We have already seen, with regard to the only child (considered as a sibsize), that selection effects can be important in affecting the relative position of children from a particular sibsize. We have also seen that selection effects, such as when seniors in high school are studied, can influence relative sibsize standings on IQ tests or National Merit Scholarship Qualifying Test findings. This is because less able young people in large families are more likely to have dropped out of high school than less able young people in small ones, and this differential drop-out rate has biased the IQ—sibsize relationship. Now we must consider how selection can affect birth-order findings.
The reader should consider this discussion to be illustrative only, since there are probably as many selection effects as there are research designs.
Age-truncation Biases
The problem of age truncation (sampling a single age or a very restricted age group) occurs quite frequently in birth-order research on intelligence because young people are being sampled. For example, if one has sampled 11-year-olds, those who are the oldest and from large families must come from closely spaced families because all of the children in the sibsize must have been born during an 11-year period. The youngest 11-year-olds from large families have not necessarily come from such closely spaced sibsizes. Thus, it is not at all uncommon to find that, among youthful samples, there may be an upturn for later-born children in the dependent variable (say, in IQ), an upturn that cannot be interpreted out of hand as a birth-order effect. The upturn at later birth orders in IQ testing is a not-infrequent result among age-restricted samples of young people, as figures 5.3 through 5.5 illustrate.[2]
We should emphasize here that in general very wide spacing in large families (six or seven or more siblings) is not possible. For example, women beginning childbearing at age 20 and having a child every five years would be limited to five children even assuming that their last child was born when the woman was 40. It is thus not practical to think of wide spacing in families of six or seven or more as a generally compensatory mechanism allowing parents to provide more attention to each child—although obviously an individual child, or even two children, can be widely spaced in an
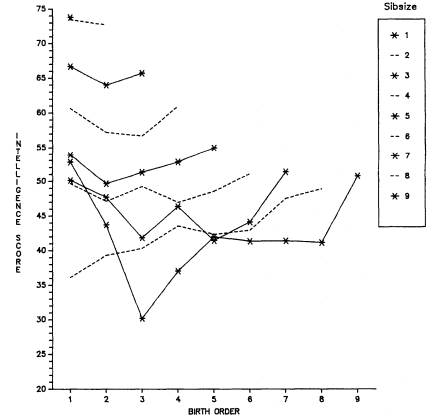
Figure 5.3.
T-Scores on Group Test of Intelligence by Sibsize and Birth Order
among Scottish School Children Age 11 in 1947. Data from the
Scottish Council for Research in Education (1949). Scores have been
restandardized with a mean of 50 and standard deviation of 10.
otherwise closely spaced family. Although extremes in spacing are uncommon, it would be desirable to know more about spacing in data sets such as we have been using because such information would provide an important test of the dilution hypothesis. Other things equal, we would expect widely spaced youngsters to have characteristics associated with smaller family size.
School-grade Attrition Biases
Just as youngsters from large sibsizes may be selected out of school at an early age, it is also not improbable that youngsters of particular birth orders may stay in school
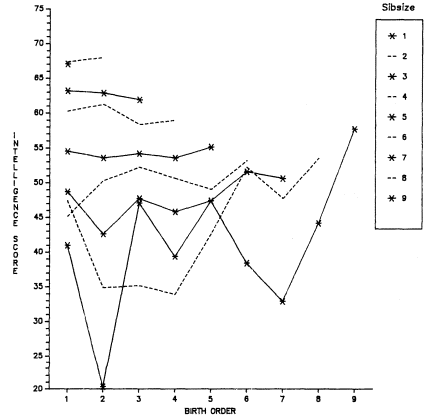
Figure 5.4.
T-Scores on Benedetto Test of Intelligence by Sibsize and Birth Order among
100,000 French School Children Age 6–14 in 1965. Data from Institut National
d'Etudes Demographiques (1973). Scores have been restandardized with
a mean of 50 and standard deviation of 10.
or drop out early, particularly in large families. For example, we shall see in a later section that, in large families, youngest and next-to-youngest children seem to stay in school the longest, whereas "early" middle-born children in such families (for example, third-born in families of six, seven, and eight or more) seem to be most deprived. It would appear, therefore, that sampling seniors in high school (and college students) for ability tests may well be selecting students from large families by birth order as well as by sibsize. Since last-born and later-born children appear to enjoy some economic advantages in large families (to be discussed), such
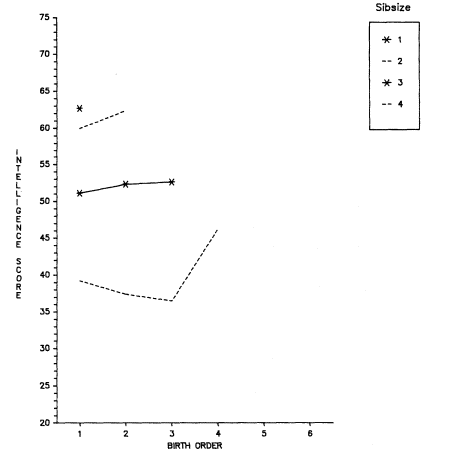
Figure 5.5.
T-Scores on Moray House Picture Test by Sibsize and Birth Order among
9523 Aberdeen School Children Age 7 in 1962. Data from Illsley (1967).
Scores have been restandardized with a mean of 50 and standard deviation of 10.
children may be less selected intellectually, other things equal, than earlier-born children in large families and, hence, on this count test less well as high school seniors (or college students) than youngsters from large families of other birth orders.
Other Selection Biases
The difficulty of distinguishing selection effects from birth-order effects is again illustrated from the Belmont and Marolla data on 19-year-old Dutchmen. As may be seen in
figure 5.1, not only do the results by birth order decline within each sibsize, but the last-born child in each sibsize takes a particularly sharp drop. The acute drop for each last-born child is quite different from the curves by birth order in any other data (figs. 5.2 through 5.5). It seems highly probable that this systematic drop in scores for all last-born children is related to the effects of the catastrophic famine in Holland during 1944 and 1945 (Smith 1947a and 1947b ; Stein and others 1972 and 1975; Blake 1981a ). In brief, since the famine drastically affected fertility, fetal mortality, and infant deaths, being an only child or other last-born child was a status that would occur selectively in those families worst hit by the famine (those families in which the woman could not become pregnant or stay pregnant to term or in which a next-born child would die). Moreover, since the adult death rate rose as well, many only and last-born children who were born during the 1944–1947 period, were partially or completely orphaned by the famine and, hence, remained "last-born." Again, on average this adult mortality would occur in those families worst affected by the famine. Since severe starvation in childhood is known to affect intellectual functioning adversely, it is hardly surprising that only and other last-born children in the Dutch data evidence an unexpectedly sharp drop in performance on the Raven Progressive Matrices test. The sharp drop among youngest children in the Dutch data led Zajonc (1976) to speculate that it was occasioned by a "teaching deficit." According to Zajonc, youngest children lagged intellectually because they (along with only children) had no siblings to whom they could act as mentors. In fact, I think it can be shown that this acute effect in the Dutch data is due to selection bias and that it is inadvisable to construct ad hoc substantive explanations for it.
To summarize our discussion so far, we have seen that theoretical expectations for birth-order differences in ability are weak and conflicting. We have no systematic, clear-cut reasons for expecting such effects. Moreover, when birth-order effects are found in empirical data, we have suggested that such effects are probably a consequence of one or more confounders—that the interpretation of effects as due to birth order may well be spurious. Different confounders will produce different "effects," and it is, therefore, hardly surprising that birth-order curves are so varied and difficult to interpret.
Before turning to our own empirical analysis of whether there
are birth-order differences in cognitive ability, we will consider in some detail the use, by Zajonc, of birth-order data to interpret the trend in SAT scores in the United States.
Birth Order and SAT Scores, or Sibsize and SAT Scores?
Since the publication in 1976 of an article by Robert Zajonc, "Family Configuration and Intelligence," the topic of birth order and cognitive ability has achieved renewed prominence. In that article, Zajonc used data on birth order as a proxy for information on spacing or birth interval, because, according to his confluence model (already discussed in chapter 4), he believes that short birth intervals decrease the intellectual environment in the family. This decrease in intellectual environment with short birth intervals occurs, according to Zajonc, because as infants are born (with an intellectual level of zero), they reduce the overall intellectual equation in the family. Close spacing implies a high proportion of infant and childlike abilities in the family in relation to the abilities of adults and older children. Zajonc (1976) emphatically denies that birth order per se is an important variable, it is only influential insofar as it is accompanied by close spacing.
In itself birth order is not an important variable. The model predicts that its effects are mediated entirely by the age spacing between siblings. . . . Hence, with large enough age gaps between siblings (allowing sufficient time for the earlier born to mature), the negative effects of birth order can be nullified and even reversed. (p. 227)
Using average birth order by year for the United States, Zajonc reasoned (on the basis of the confluence model) that one could predict the SAT scores in the United States and account for their decline, as well as project a future rise. The average annual birth order is simply an average of the distribution of annual births according to whether they are first births, second births, third births, and so on. In the 1976 article, Zajonc predicted, on the basis of what he felt was a past association of SAT scores and average birth order, that the scores would rise after about 1980, since average birth orders were declining. The figure from Zajonc's 1976
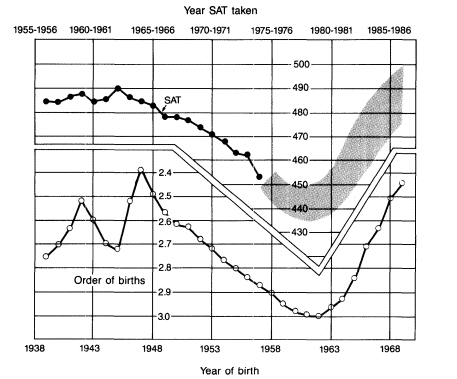
Figure 5.6.
Average Order of Live Births in the United States, 1939 to 1969, and
Average SAT Scores for the First Eighteen Cohorts. Future SAT averages
are predicted to lie within the shaded area. Data from Zajonc (1976).
article is reproduced here as figure 5.6. In figure 5.7 we have extended the data on average birth order and SAT scores backward in time to the year of the first published scores, and forward in time to the scores for 1985. We also show the verbal and math scores separately.
When this entire range of SAT scores and average birth orders is presented, it is evident that average annual birth order is not as felicitous a predictor of SAT scores as it appeared to be in the incomplete figure presented by Zajonc. For example, although the SATs are at a high point in the early 1950s, the average birth order was as high among these test takers (those born 17 to 18 years
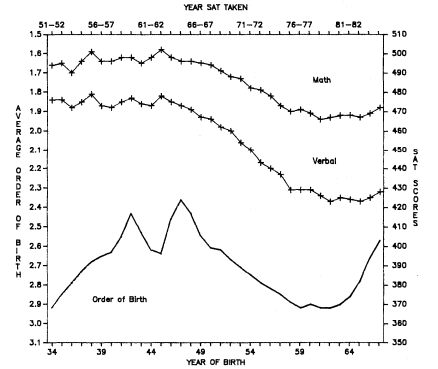
Figure 5.7.
Average Order of Live Births in the United States 1934–1967, and Verbal and
Mathematics SAT Scores 1951–1952 through 1984–1985. SAT scores are from
Eckland (1982) and personal communication with the College Entrance Examination
Board. Order of birth data are derived from National Center for Health Statistics
(1950) and each respective year 1948–1968 (Vital Statistics Natality Volumes).
previously in 1934) as it was for test takers born in the early 1960s. This means that the average birth order was identical for the birth years of the SAT takers who were at both the high and the low points of the SAT scores.
Why does average annual birth order work so poorly as a predictor of SAT scores? At least two factors are operating. One concerns problems with average annual birth order as an indicator, and the other is differential selection bias among the SAT takers.
To understand why average annual birth order is a poor indicator, one must first be clear about why Zajonc (1976) believes it is a good proxy for birth-spacing.
High values of average order of births for a given year indicate that children born that year have on the average more older siblings and come from larger families . . . [average order of births] combines two important factors of intellectual development, family size and birth rank. (p. 232)
Implicit in his reasoning is that, on average, large families involve closer spacing. But, is average order of annual births a good indicator of either family size or spacing? The answer regarding family size is, of course, negative because although being of a higher birth order must mean that one comes from a large family (as Zajonc recognized), the converse is not true—being from a lower birth order in any given year tells us nothing about the individual's sibsize. Any number of children can be born after the first or the second, and so forth. Nor, assuming one knows family size, could one predict spacing from that knowledge because, as we have discussed already, although larger families inevitably constrain shorter spacing, on average, than smaller families, small families may be spaced closely out of parental choice, as has been true in the recent fertility experience of the United States.
However, if one believes (as we do) that family size is important for ability because of the dilution of parents' resources (as well, perhaps, because of a heavy representation of very young "intelligences" in large families, as Zajonc assumes), then one can obtain an accurate direct measure of the average family size of women who gave birth in each of the years in question (these are the birth years for 17-year-olds taking the SAT between 1952 and 1985). This is possible because, in each of the years, we know that the women giving birth had to be in the reproductive ages and, hence, we can date their birth cohorts and use the cohort fertility tables for the United States to read off the completed family size of women who were having children in those years. In actual practice, since most births (approximately three-quarters) in each year occurred to women age 20–34, we can use the completed family size data for those age groups in each year. The data, plotted in figure 5.8, thus represent the completed family size of women age 20–24, 25–29, and 30–34 in each year of birth of the SAT takers (1934, 1935, 1936, etc.) averaged into one curve (for women 20 to 34). An additional curve has been computed for more recent years in which information for 20- to 25-year-old mothers was not available. These
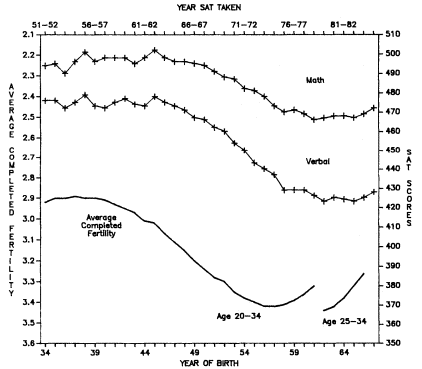
Figure 5.8.
Average Completed Fertility (at Age 40–44) of American Mothers Who Were Age
20–34 or 25–34 in the Year of Birth of the Test Takers, and Verbal and Mathematics
SAT Scores 1951–1952 through 1984–1985. SAT scores are from Eckland (1982) and
personal communication with the College Entrance Examination Board. Fertility data
are derived from Heuser (1976) and National Center for Health Statistics (1980).
curves involve weighting the completed fertility for each age group of women according to the group's importance as a contributor to the reproduction of that year.
It is evident from figure 5.8 that there is a close correspondence between the completed family size of the women who gave birth in each of the years 1934 through 1966 and the SAT scores of the youngsters born in those years. In particular, the family-size curve conforms rather well to the verbal SAT scores. However, for the most recent dates, family size goes down more sharply and sooner than the SAT scores rise. This difference may result from differen-
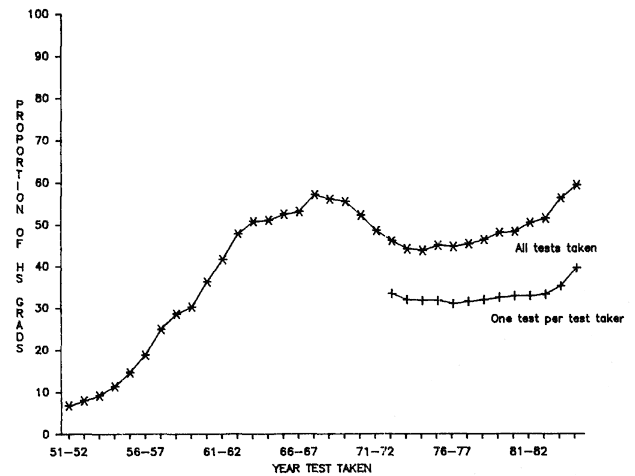
Figure 5.9.
Percentage of High School Graduates Who Took SATs in Each of
the Years 1951–1952 through 1984–1985. (The complete series is based on
all SATs taken in a given year regardless of grade level of the test taker,
or whether test takers repeated the test in that year. These data are from
a personal communication with the Educational Testing Service. The
series from 1971–1972 onward is based on only one test per student.
These data are from Educational Testing Service [1984] and personal
communication with the CEEB. Data on high school graduates are
from Plisko and Stern [1985].)
tial selection bias among the SAT test takers, to be discussed in a moment. At this point, we may simply emphasize that an understanding of the inverse relation of the SAT scores and the family size of the test takers does not require a resort to data on birth order.
Although the family size and SAT curves are tantalizingly congruent over much of the period in question, one should be skeptical about overinterpreting this apparent association. SAT takers have been a highly variable percentage of high school graduates over the years as may be seen from figure 5.9. Prior to 1971, we have no direct information on the socioeconomic biases involved and none concerning family-size selection over time. Indirect analysis, using
1960 Project Talent data and 1972 National Longitudinal Survey data, has suggested that the socioeconomic backgrounds of the test takers declined during the 1960s so that SES compositional effects on the SAT declines during that period appear clear (Eckland 1982). Some SES compositional effects appear to have continued during the 1970s, but these are not sufficient to explain the poor results after 1973. It is possible, therefore, that family size (itself correlated with SES) may be implicated. When we bear in mind, however, that high school graduates are themselves selected by sibsize, the further selection among high school graduates of SAT takers makes it remarkable (perhaps too remarkable!) that the family size/SAT curves conform as well as they do. Rather than overstating the importance of this congruence, we would caution that widespread interest in the causes of variability in SAT scores should lead to the acquisition of actual information on the socioeconomic background and family sizes of the SAT takers.
Empirical Analysis of Birth-Order Differences in Intelligence
We may now ask whether apparent birth-order effects on ability disappear if we control for at least some of the confounding discussed in the previous section. Of the studies used in this book, we have data on birth order and IQ testing from Cycles II and III of the Health Examination Surveys and from the sophomore boys in the Youth in Transition study. Consequently, we can control for sibsize, for parental background differences by sibsize, and for such differences by birth order within sibsize. We can also control for period effects in Cycles II and III to some extent because such effects average out when data involve subjects from a broader age range, and this age range also obviates much age-truncation bias. However, Youth in Transition data are more vulnerable to both period effects and age truncation bias since the youngsters are all sophomores in high school. Moreover, the children in Cycle II are still so young that age-truncation biases may also still be operating.
For the statistical analysis of birth order within sibsize, we needed to control, over all sibsizes and birth orders, for the parental background variables used in our analysis so far (parents' education, family intactness, etc.). In effect, we did not wish simply to do
a regression on each sibsize separately using the background predictors and adding birth order, because this would only have controlled, within each sibsize, for background differences among the different birth orders of that sibsize. We would still not have equated, with respect to background variables, subjects who were born third in three- and six-child families, for example, or only children with children of other sibsizes and birth orders (for example, Steelman and Mercy, 1980 and 1983).
Consequently, we used a two-stage analytical technique.[3] First, we removed the effects of major background variables (mother's and father's education, family income, mother's usual activity, family intactness, community size, and region) on the dependent variable through multiple regression (multiple classification analysis). Employing the resulting residuals, we were then able to do an analysis of birth order and ability within each sibsize. For this purpose, we used one-way analysis of variance. In sum, we controlled over the whole sample for background factors, and then were free to examine birth order within sibsize.
These calculations, for all three samples and using both verbal and nonverbal test scores, resulted in statistically significant birth-order differences between only three comparisons (of two birth orders each) out of 56 possible comparisons. However, although the birth-order differences are inconsequential, the disparities between unadjusted and adjusted scores are of interest because of what adjustment does to the relative position of the only child and because of the shape of the curves. The unadjusted and adjusted Vocabulary results for Cycle II are shown in figure 5.10. Quite clearly, adjustment for the background characteristics markedly improves the position of the only child to one of preeminence, and it is also clear that the shape of the curves is more like those in the Scottish and French data than in the Dutch or National Merit Scholarship data (figs. 5.1 through 5.5). The upward tilt of the curves may be due to age-truncation bias (since many of the children are very young), but this same pattern is manifested in the Youth in Transition results for 16-year-old sophomores in high school (fig. 5.11). It is also noteworthy that, except occasionally for the oldest child, the curves for birth order by family size do not often overlap, indicating that the negative effect of family size is not offset by birth order.
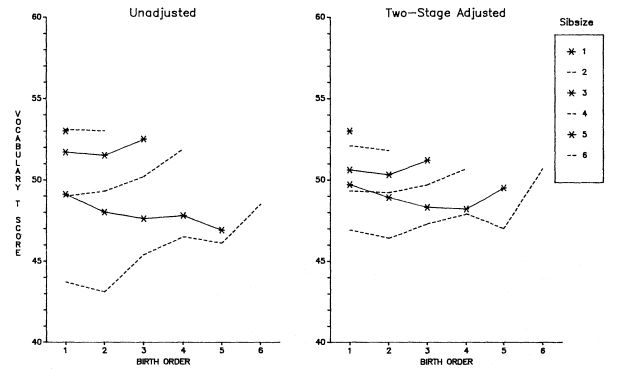
Figure 5.10.
Unadjusted and Two-Stage Adjusted Age–Sex Standardized T–Scores by Sibsize
and Birth Order on WISC Vocabulary, White Boys and Girls, HES, Cycle II.
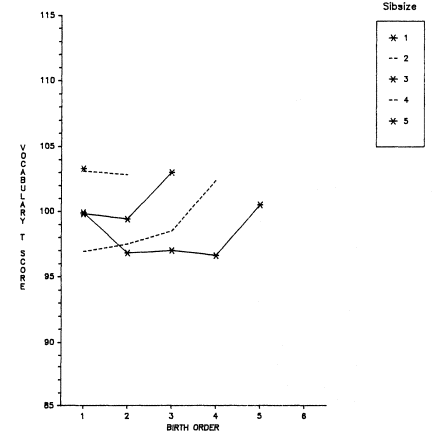
Figure 5.11.
Two-Stage Adjusted T–Scores on Vocabulary (Quick Test) by Sibsize
and Birth Order, White Boys, YIT, High School Sophomores.
Theoretical Expectations about the Relation of Birth Order and Educational Attainment
When we turn to the educational attainment of adults, even assuming no major differences in intellectual endowment by birth order, we may have somewhat better reasons for expecting systematic birth-order effects than was the case with IQ. Educational attainment involves family financial resources over a protracted period of time. It is thus possible that birth order could interact with the family life cycle (and the trajectory of family economic commit-
ments) in such a way as to have some systematic effect on the educational attainment of adults by birth order. We may again, as with intelligence, outline possible reasons for expecting birth-order differences in educational attainment.[4]
Reasons for Expecting Birth-Order Differences in Educational Attainment
I. Purposive differences in parental treatment
As with intelligence, it seems unlikely that parents would purposely favor or discriminate against children of a particular birth order. Given an absence of rules of inheritance and succession (and the importance of jobs versus the inheritance of fixed assets, such as land, in the modern world), it seems unlikely that we would find a systematic favoring of an oldest son relative to other sons, for example, when it comes to educational attainment. It is possible, however, given sex-role definitions, that parents might favor boys over girls in providing educational opportunities and that these sex differences in parental treatment might interact with birth order in a systematic fashion.
II. Patterned circumstantial differences in parental treatment (or life chances) that result from the fact that children appear at, and live through, different points in the family cycle
i. Dilution by other children of parents' resources. Children of particular birth orders may be uniquely favored or disfavored regarding financial resources and encouragement to continue through high school or on to college.
|
|
ii. Contributions of siblings to life chances
|
In sum, although the expectations are far from clear-cut, we have some reason to think that, on average, the oldest and youngest children may have a better chance at educational attainment than middle children in large families. In two- and three-child families, it seems unlikely that systematic birth-order differences in educational attainment would be found, since children in small families are brought up in similar periods of the parents' life cycle and, as well, tend to be relatively close in age. It is possible, however, that boys will be favored over girls at any birth order when it comes to educational chances.
Possible Confounders in the Analysis of Birth Order by Educational Attainment
In general, we would expect to see most of the same confounders in the analysis of educational attainment as in the analysis of intelligence. We would, however, expect some changes. First, is a greater importance of period effects on educational attainment, since a person's educational chances may depend heavily on when some external event (such as a depression) impinges on the family and its ability to help with education. As we have indicated, such period effects are difficult to analyze in relation to educational attainment, but we will hope to average them out by using the wide age ranges available in our adult samples. Second, it is probably particularly important to control for parental background variables by birth order and sibsize, since the parents are a major component of the individual's life chances. Third, there will not be truncation effects by age since adults are the ones who are interviewed. And finally, there may be marked effects according to the sex compositions of the other siblings and their birth order. For example, an only boy in a family of four may have quite different educational chances, regardless of birth order, than one of four boys.
In performing this analysis, we will first present data for all cohorts combined (thereby hoping to average out period effects). We will control for parental background factors (father's education, father's SEI, farm background, and family intactness) and respondent's age, but we will not deal initially with the sex composition of the respondent's siblings in relation to birth order. Then, we will examine the data by selected age cohorts and, in addition, do some
| ||||||||||||||||||||||||||||||||||||
analysis of the surveys by sex composition of the birth orders within selected sibsizes. These analyses will give some sense of how much difference period and sex composition effects may make to birth-order analysis.
Empirical Analysis of Birth-Order Differences in Educational Attainment
We have data on birth order and educational attainment for three major data sets—Occupational Changes in a Generation, 1962 and 1973, and the National Fertility Study, 1970. In the interest of space, we will not present our analysis of the National Fertility Study because it completely parallels the findings from the other two analyses. As mentioned above, we have controlled for parental background factors in the same way as for the analysis of birth order and intelligence. First we created residuals that are free of the effect of background factors, and then we ran analyses of variance (ANOVAs) of birth order (within sibsize) against the dependent variable.
Turning first to Occupational Changes in a Generation, 1973 (the largest data set having information on birth order), figure 5.12 plots the adjusted means by birth order within sibsize for total years of education, as well as percentages having at least a high school education. The figure suggests a number of important points. First, on the one hand, at small sibsizes the birth-order effects
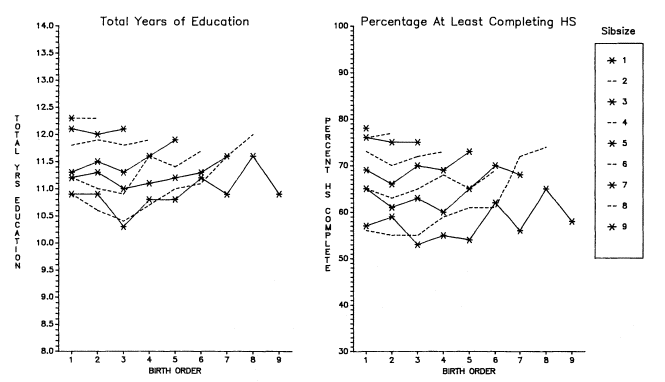
Figure 5.12.
Two-Stage Adjusted Total Years of Education and Adjusted Percentages Who Have
at Least a High School Education by Sibsize and Birth Order, White Men, OCG 1973.
appear negligible. Indeed, the ANOVAs indicate that, even given the very large numbers, the differences between any two birth orders in families of one to four children are not statistically significant. Second, and on the other hand, the shape of the birth-order distributions (even in small families) conforms to theoretical expectations—last-borns do better than middle-borns. Third, among large families, the parabola is very clear.[5] In fact, it is not unusual for last borns and next-to-last borns to do considerably better than firstborns. Consequently, if we fit a quadratic equation to the birth-order data within sibsize (among families of four or more siblings), we find a high correlation of birth order and educational attainment, see table 5.1.
The high correlation of birth order with total years of education and the position of later birth orders in large families suggests that, in such families, birth order can somewhat mitigate the effects of sibsize. For example, as may be seen from figure 5.12, last-born and next-to-last-born children in large families may do better educationally than children in somewhat smaller families. However, those from small families (one, two, and even three children) are obviously in a class apart. The particularly positive effect on youngest and next-to-youngest children in large families suggests that it is help from older siblings that makes a major difference, and not merely that older siblings may no longer be a drain. To achieve this last-child and next-to-last-child effect, the family size must be sufficiently large to give time for older siblings to be mature enough to help. It is probably also true that the parents in these very large families were traditional and familistic and, hence, enforced strong norms of family assistance by older children to younger ones.
This analysis also highlights the fact that we must specify the idea of the "middle" child more carefully than, for example, was the case in the Blau and Duncan (1967) analysis of the OCG 1962 data. In large families, it is not merely being "in the middle" that is detrimental, it is being in the middle at an early stage of parental family building. Actually, among large sibsizes in the OCG 1973 data, the third child is in the trough. Conditions begin to improve from fourth children onward, so that many later-born "middle" children do as well or better than firstborns.
One way of dramatizing the effect of differential birth order in
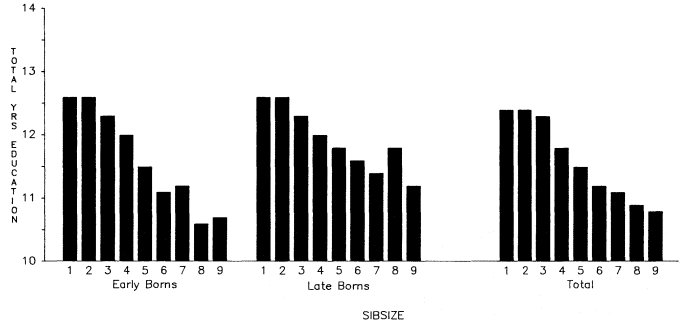
Figure 5.13.
Total Years of Education Achieved by Sibsize Contrasting Early and Late-Born Children, White Men Age 25
and Over, OCG 1973. (Early borns were computed by using the only child, two children and three children
and the first three children in each remaining sibsize. Late-borns were computed by using only children,
two children and three children, and the last two children born in each remaining sibsize.)
large families is to look at the sibsize relation to total years of education but, for sibsizes larger than three, to include only the first three birth orders. This tabulation may be contrasted with the sibsize tabulation including all birth orders, and with a tabulation of education by sibsize that includes only the two last-born children in each sibsize (fig. 5.13 presents all three tabulations). As may be seen from figure 5.13, the sibsize differential is widened if one considers only the first three children in each sibsize. If, however, one looks at only the last two children in each sibsize, the sibsize differential is mitigated. It is clear that the negative effects of large sibsize on educational attainment can be partially overcome if one is among the two last-born children.
Before proceeding to Occupational Changes in a Generation, 1962, we may ask whether the adjusting process changed the shape and position of the birth-order curves for OCG 1973. Looking at figures 5.14 and 5.15 for OCG 1973 (which contasts the unadjusted and adjusted findings) we see that it did. At the smaller family levels (four and under), the adjustment corrected for depressants to the status of the only child and reversed a downward tendency of values by birth order within sibsize. At the larger sizes of family, the adjustment sharpened the parabolic tendency, getting rid of some of the depressants to the upward movement of the curve.
Turning to OCG 1962, figures 5.16 and 5.17 summarize the same analysis on this data set that we did for OCG 1973. It is evident that the results of the 1973 analysis are replicated very closely. Moreover, in table 5.1, we again find that when a quadratic is fitted to the data for birth orders within larger families, a high correlation is achieved between birth order and total years of education within each sibsize.
Although our findings concerning birth order and educational attainment in OCG 1962 and 1973 accord with the more aggregated analysis for OCG 1962 by Blau and Duncan (1967), it is worth noting that Hauser and Sewell (1985) have found no birth-order effects on education in their analysis of the followup data for respondents who were Wisconsin high school seniors in 1957 (and in a derived sample of their siblings). When study designs differ radically, it is never easy to pinpoint the causes of differing results.[6] However, we may mention a few relevant points.
First, the Hauser and Sewell data originate from a sample of
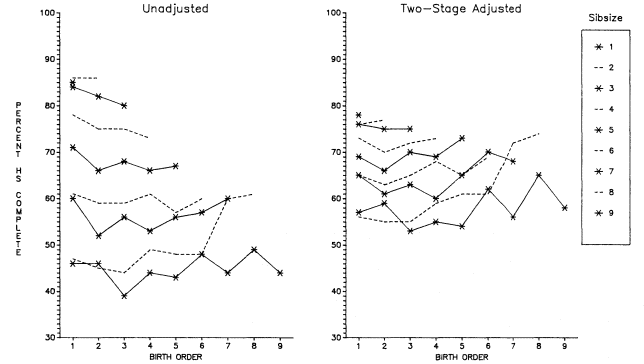
Figure 5.14.
Comparison of No Adjustment and Two-Stage Adjustment, Percentages Who Have at Least a
High School Education by Sibsize and Birth Order, White Men Age 20 and Over, OCG 1973.
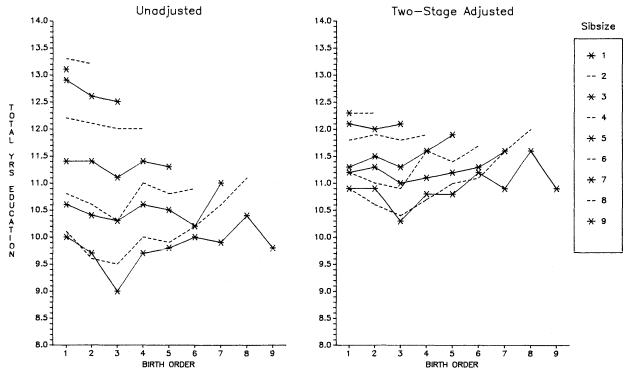
Figure 5.15.
Comparison of No Adjustment and Two-Stage Adjustment, Total Years of
Education by Sibsize and Birth Order, White Men Age 25 and Over, OCG 1973.
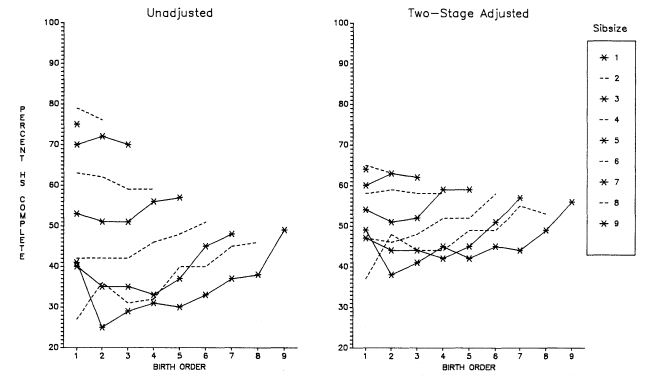
Figure 5.16.
Comparison of No Adjustment and Two-Stage Adjustment, Percentages Who Have at Least a
High School Education by Sibsize and Birth Order, White Men Age 20 and Over, OCG 1962.
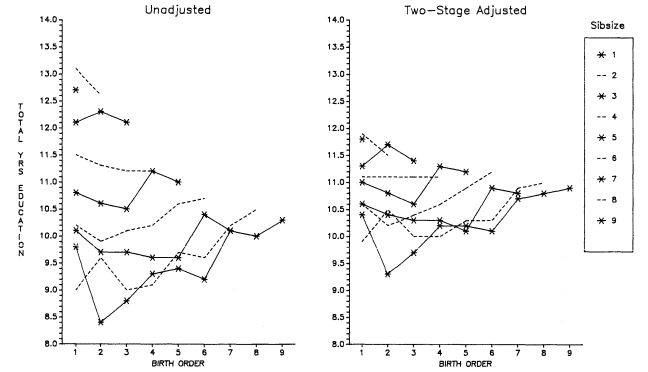
Figure 5.17.
Comparison of No Adjustment and Two-Stage Adjustment, Total Years of
Education by Sibsize and Birth Order, White Men Age 25 and Over, OCG 1962.
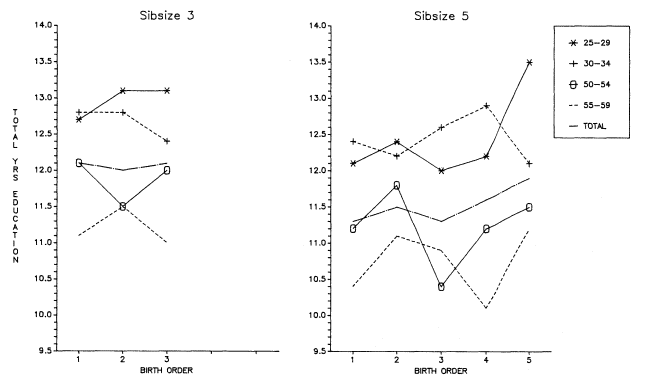
Figure 5.18.
Two-Stage Adjustment for Selected Cohorts, Total Years of Education, Sibsizes
Three and Five, by Birth Order, White Men Age 25 and Over, OCG 1973.
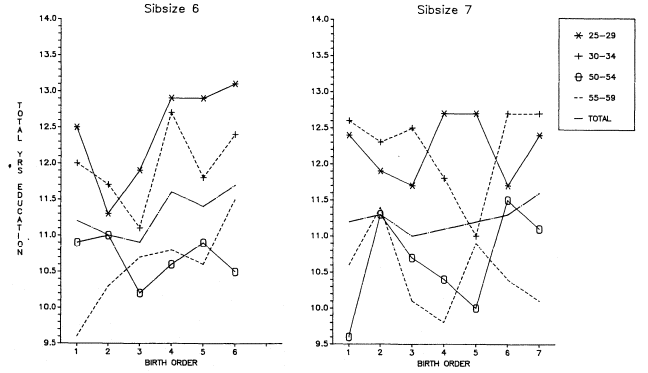
Figure 5.19.
Two-Stage Adjustment for Selected Cohorts, Total Years of Education, Sibsizes
Six and Seven by Birth Order, White Men Age 25 and Over, OCG 1973.
graduating seniors in 1957 whose sibsize is skewed toward small families because the respondents had already achieved high school graduation. As Hauser and Sewell (1985) state:
The combination of the facts that respondents tend to appear in low birth orders and are all high school graduates further confounds the interpretation of birth order effects on mean levels of schooling.
Second, in addition to the overall selectivity of the sample, the authors find a strong selectivity in large families of respondents' educational attainment in relation to that of their (nonrespondent) siblings. In effect, the high school graduates (the respondents) who came from large families were more different from their siblings than the high school graduates who came from small families. Further, as Hauser and Sewell point out, most of the siblings of the respondents were younger than the primary respondents (the high school graduates), many substantially so. In sum, the primary respondent who had achieved high school graduation was an older child in most cases, thus greatly limiting variability in educational attainment for earlier born children. By definition, most of them graduated from high school. Moreover, later-born children invariably had an older sibling who had achieved this status. Given these biases and anomalies in the basic data, it may be that they are not well suited to the study of birth-order effects on education.
Returning to our own analysis, as mentioned earlier, we expect period effects to be very important as confounders in the analysis of birth order and educational attainment, but our findings for the entire OCG samples have probably averaged out the period effects. However, supposing we had not been fortunate enough to have such a broad range of ages for analysis, would our results have been different? In effect, if we look at the same kinds of curves for separate age cohorts, what will we see? The answers are highly instructive concerning the importance of period effects for birth-order analysis.
Figure 5.18 (showing birth order by sibsize for sibsizes three and five disaggregated further by four age groups) illustrates the difficulties, due to period effects, of interpreting educational data on birth order by sibsize. Although the period effects appear to average out when a wide age range of subjects is considered, period effects
create marked differences in the curves when the latter are examined by cohort —in this case, those ages 25–29, 30–34, 50–54, and 55–59. It is tempting to interpret these cohort curves in relation to depressions, wars, economic booms, and the like. But such a level of specificity strains the data beyond their limits. At minimum for such an interpretation, one would want to use data by single years of age, but given the size of the sibsize–birth-order matrix, this requirement would transcend the resources of even a sample as large as OCG 1973. The complexity of the period effects is again illustrated in figure 5.19, which plots education by birth order for sibsizes six and seven among the four age groups. It is clear as well, that assumptions about spacing could introduce considerable bias into one's thinking, but some such assumptions would have to be made if one were to match up birth orders with periods in order to attempt to understand how the periods impinged on various points in the individual's educational cycle.
Do period effects undo the curvilinear relationship we have seen for large families? Figure 5.19 shows that the well-defined parabola for larger sibsizes that was evident when all age groups were averaged together is less clear-cut in age groups taken separately. However, the tendency for younger children to benefit at the expense of older children is obviously present in some (but not all) of the age-specific curves.
This consideration of separate age cohorts is thus a sobering check on interpretations of data that may be highly period-specific instead of spanning a broad range of periods as do both the OCG samples.
In sum, this analysis, which involves unusually adequate controls for family background and period effects, suggests that among large sibsizes the relation of birth order to the achievement of adults is curvilinear. A curve fitted to this parabola gives a high correlation of birth order with educational attainment after major background factors have been controlled. This correlation is evident in three major data sets, two of which are shown here. The correlation accords with a reasonable set of expectations regarding how educational attainment should be related to sibsize and birth order, and, hence, offers a fairly strong challenge to disproof.
The curvilinear relationship among birth orders in the largest families suggests that the youngest and next-to-youngest children
can benefit educationally by having many siblings and, as a consequence, frequently bring their performance up to levels comparable with those in four-child families (figs. 5.12, 5.16, and 5.17). However, this accomplishment is at the expense, as it were, of siblings at earlier birth orders who are left far behind in the educational race. Additionally, not even the youngest in large families can equal the educational performance of those in family sizes one through three.
Among birth orders in small families, statistically significant effects are not evident. However, controls for background factors serve to raise the values for only children relative to other birth orders and sibsizes.
Birth Order and Sex Composition of the Family
Did it make a systematic difference to men's education in the OCG samples what the sex composition of their sibsize was and where the men stood in the birth order/sex composition matrix? Again, our expectations in this regard are far from consistent. One could argue that being the only boy (and, perhaps, the youngest) in a family of girls might put a boy in a better position than being the oldest, or in the middle, in a family containing a similar number of boys. Presumably, parents of one boy who appears after a long succession of girls might make particular efforts to ensure his education, in contrast to a situation where the family was made up of all boys (whose education might have equal claim), or where the family contained more than one boy (but not necessarily all boys).
A counter to this "only boy" expectation could be that, regardless of parental motivation, a family that is predominantly girls may be less able financially than one that is predominantly boys. Typically, parents are more protective of girls and, hence, girls may not be able to earn as much from early on as boys. Moreover, boys may be able to contribute longer than girls, because (at least in the past) if girls married and did not participate in the labor force, and had little control over resources, they would not be able to contribute much to their families of orientation. Thus, their greatest "contribution" might be to marry and cease being a financial burden to their parents. Hence, a family of all boys, or predominantly boys, might be able to help younger boys more effectively.
The reader should bear in mind that our analysis is silent (due to lack of data) regarding the position of the girls versus the boys in mixed-sex families. Relative to girls, boys might receive favored treatment in such families, although, other things equal, they might still not have the advantages of boys in an all-boy family. Clearly, if one were convinced that birth order/sex composition was a systematic predictor of educational attainment, the data requirements for a full-scale and meaningful analysis of this issue are formidable.
Figure 5.20 plots total years of education by birth order/sex configuration for OCG 1962 and 1973 side by side for sibsizes two, three, and four. In each case, the configuration is plotted against the average birth-order values for that sibsize so that the reader can see what difference the particular configuration makes in contrast to the average by birth order for the sibsize group.
Since the patterns are so heterogeneous between the two surveys, the results do not lead us to believe in highly structured, systematic differences in educational attainment as a consequence of the birth order/sex configuration of the family. Being an only boy of any particular birth order in these families suggests no clear-cut advantage or disadvantage compared to boys of other configurations in the same sibsize. From the data, one could argue for an advantage inhering in the "all-boy" configuration, but sibsize three in OCG 1962 is an exception. Thus, although men from different birth order/sex configurations assuredly differ in many cases from the average birth-order curves, the pattern of these differences, if one exists, is far from obvious.
One pertinent question regarding a birth order/sex configuration influence is whether it has a bearing on the advantaged position of last-born and next-to-last-born boys in very large families—an advantage that we have already seen to exist? In other words, when the sibsize is at a known average disadvantage, but a particular birth order within it is advantaged, does this advantage depend on a unique birth order/sex composition?
In an attempt to answer this question, we confine ourselves to OCG 1973, which has the largest number of cases. Even so, if we focus on sibsizes seven and eight, there are not enough cases to isolate families with only one boy, or with all boys, for analysis. As a compromise, we have grouped "one-boy" configurations with families that are predominantly girls, and "all-boy" configurations
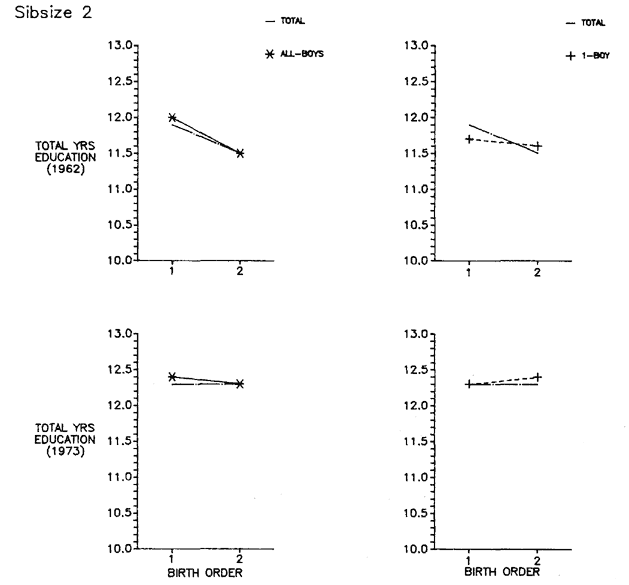
Figure 5.20.
Total Years of Education by Birth Order for All Respondents Versus
Individual Sex Configurations of the Sibsize, Sibsizes Two through
Four, White Men age 25 and Over, OCG 1962 and 1973.
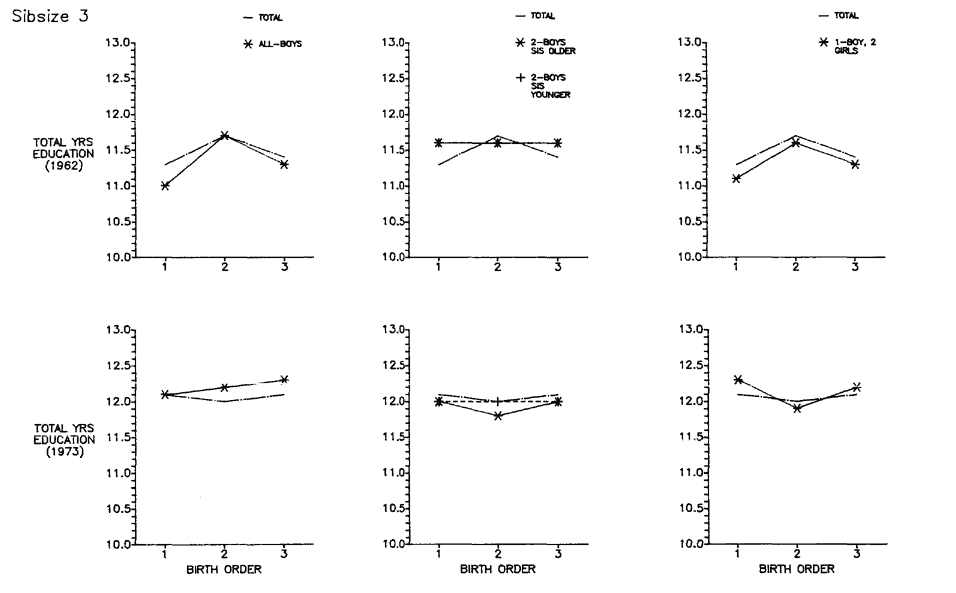
Figure 5.20.
Continued.
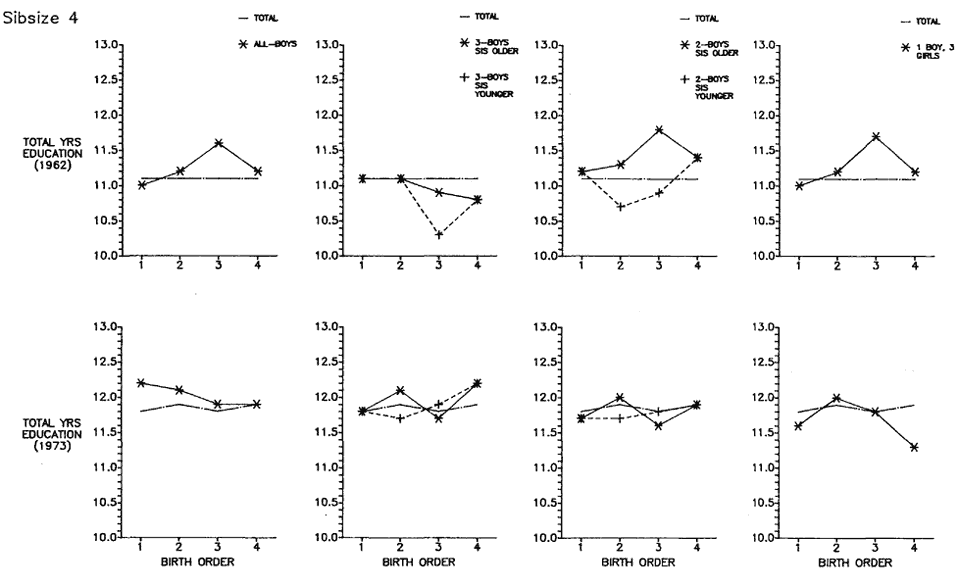
Figure 5.20.
Continued.
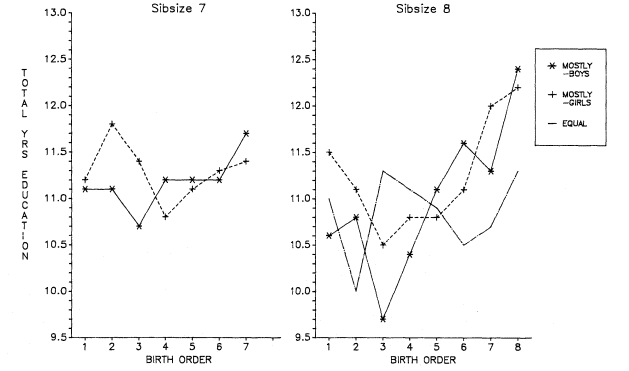
Figure 5.21.
Total Years of Education by Birth Order and Sex Configuration of the Sibsize,
Sibsizes Seven and Eight, White Men Age 25 and Over, OCG 1973.
with families that are predominantly boys, thereby allowing us to contrast the curves for men who came from large families that were mostly (or all) boys, and families that were mostly girls. The results for sibsizes seven and eight (with the influence of background factors removed as for the other curves) are shown in figure 5.21. Both curves for "mostly boys" and "mostly girls" are parabolic in form with troughs in the middle, and the last two children do better than either firstborn or middle children. However, the last-born boy seems to take a particularly sharp upward turn among the "mostly boys" families, suggesting that, indeed, there may be a unique educational advantage in large families to being a youngest child (or among the youngest children) in a long line of older brothers.
The results concerning education by birth order in large families thus tend to reinforce the "dilution" hypothesis. In large, primarily male families, the last-born children may, on average, have a number of pseudo-fathers and, hence, may be able to achieve disproportionately from an educational point of view.
Summary and Conclusion
In this chapter, we have seen that there are no clear-cut theoretical expectations regarding birth order and cognitive ability. Hence, the research literature on this topic has been, as the saying goes, "data driven." Research "findings" have been subject to a wide variety of biases that, in turn, have produced many, varied and conflicting, birth-order "effects." The latter are reported in the research literature when they are noteworthy and startling and, apparently, ignored when they are not. Among these biases are the interpretation of sibsize, period, parental background, child-spacing, and numerous types of selection effects as birth-order differences.
Our empirical analysis has not pretended to control for all of these confounders, but we have controlled for some and recognized and illustrated the effects of others. Our conclusion is that systematic and patterned birth-order differences in cognitive ability are quite probably nonexistent. Where such differences appear, they are consequences of confounding and selection biases.
We have given particular attention to Robert Zajonc's claim that national data on average annual birth order in the United States
can be used to predict the course of SAT scores. We have shown that the full series of birth-order and SAT data (as distinct from the truncated series used by Zajonc) do not correlate well, but that the SAT scores do appear to be associated over time with completed cohort fertility per woman (a measure that is very different from annual average birth order). However, we have cautioned against overinterpreting any such series of aggregated data.
Turning to birth-order effects on educational attainment, we have (following Blau and Duncan) outlined a variety of reasons for expecting oldest and (particularly) youngest children in large families to achieve the most education, and for middle-born children to receive the least, but we have little reason to expect systematic birth-order differences in education among individuals in small families. Our expectations for large families are based on the notion that, relative to middle-born children, oldest children have the advantage of growing up while the family is smaller, whereas middle-born children (especially early middle-borns) experience the full force of large sibsize, and last-born (or next-to-last-born) children have the advantage of being reared in a family where there may be a number of older wage-earners among the siblings and, at worst, where many older siblings have left home for marriage or work elsewhere. Moreover, the youngest child or children are being reared during a period of the parents' lives when the latter are probably at a peak income level and have established themselves in terms of housing and consumer durables.
Our actual analysis of OCG 1962 and 1973 data (and of data from the 1970 National Fertility Study, not shown) indicates no statistically significant birth-order differences in education among small families but a definite parabola among large families. Moreover, the last borns and next-to-last borns in large families frequently do better than firstborns. As well, the data suggest that it is not simply being in the "middle" that is most detrimental, but rather that being a middle-born child early in the sequence of offspring presents the greatest disadvantage. Later-born middle children may do as well as or better than firstborns.
In order to illustrate how varied and marked are period effects on the birth order/education relationship, we have redone the analysis of the OCG data using separate age groups of respondents. It is evident from this disaggregation that, had the birth-order
analysis of the OCG data been for one restricted age group (instead of the wide range of ages that is actually the case), our interpretations would have been profoundly affected by period influences. A reanalysis of the data according to the sex configuration of the respondents' families in OCG 1973 illustrates, as well, that selection biases according to sex configurations could have profound effects. We also have been able to document that had we not used the special two-stage analysis of sibsize and birth order (an analysis that removed family background influences prior to the birth-order calculations) our findings would have differed. In this regard, the position of the only child, relative to other birth orders, would have been a notable sufferer. Our analysis has thus made it possible to account for the puzzling disadvantages apparently suffered by only children relative to those of other birth orders in larger families.