Preferred Citation: Kuhn, Gerald G., and Francis P. Shepard Sea Cliffs, Beaches, and Coastal Valleys of San Diego County: Some Amazing Histories and Some Horrifying Implications. Berkeley: University of California Press, c1984 1984. http://ark.cdlib.org/ark:/13030/ft0h4nb01z/
 | Sea Cliffs, Beaches, and Coastal Valleys of San Diego CountySome Amazing Histories and Some Horrifying ImplicationsGerald G. Kuhn |
Preferred Citation: Kuhn, Gerald G., and Francis P. Shepard Sea Cliffs, Beaches, and Coastal Valleys of San Diego County: Some Amazing Histories and Some Horrifying Implications. Berkeley: University of California Press, c1984 1984. http://ark.cdlib.org/ark:/13030/ft0h4nb01z/
ACKNOWLEDGMENTS
We are particularly grateful to Lynn Williams-Malahy for her fast and accurate copying and recopying of the manuscript, and for her many helpful suggestions, and also to Elizabeth Shepard for her tireless reading of the manuscript so that Francis Shepard, in spite of his poor eyesight, could edit and revise it, and for her helpful suggestions. We thank Jeffery D. Frautschy who was one of the first persons to recognize the value of our work, and who was of help to us particularly through his connection with the California Coastal Commission.
This work was supported in part by NOAA, National Sea Grant Program, the Department of Commerce under grant numbers NA80AA-D-00120, project number R/NP-1-10E, 04-8-M01-189, project number R/NP-1-96, and the California State Resources Agency (R/CZ-43), and by the California Coastal Commission under contract number C6-81-36.
We are not quite sure who or what to thank for the timely eruption of El Chichon Volcano which provided us with so much explosive material for our study.
INTRODUCTION
Probably the most completely investigated area of the world for coastal erosion and beach development is San Diego County. It is only recently, however, that information obtained through these extensive studies has been given much attention, so that construction along this coast could be properly planned to avoid serious danger from erosion. In this book we will attempt to place the information clearly before the public so that future planning can avoid the mistakes that have been common in the past. The general impression until quite recently has been that coastal erosion along most of the San Diego County coast has been slow, except where the cliffs were of unconsolidated alluvium. This impression developed partly as the result of early writings and photographs showing what appeared to be essentially the same rock configurations now constituting the coast as were there a half-century ago (Shepard and Wanless 1971). Also, some attempts to study initials carved into rock cliffs a score of years ago showed little change (Emery 1941). Nails were driven into the rocks and not much change in their exposure was observed (Lee, Pinckney, and Bemis 1976). It was pointed out, however, that these methods were not very satisfactory, as more careful studies showed that the areas with no change were somewhat exceptional. Most changes in rock cliffs appear to be episodic; there might be no alteration for a long time, and then a large change could occur instantaneously due to a rock fall or cliff failure. Furthermore, we now know that recent years have been years of minimal erosion up until 1978, as we will show, and erosion rates have been particularly slight during the past few decades.
PART I—
GENERAL CHARACTER AND CLIMATIC HISTORY OF AREA
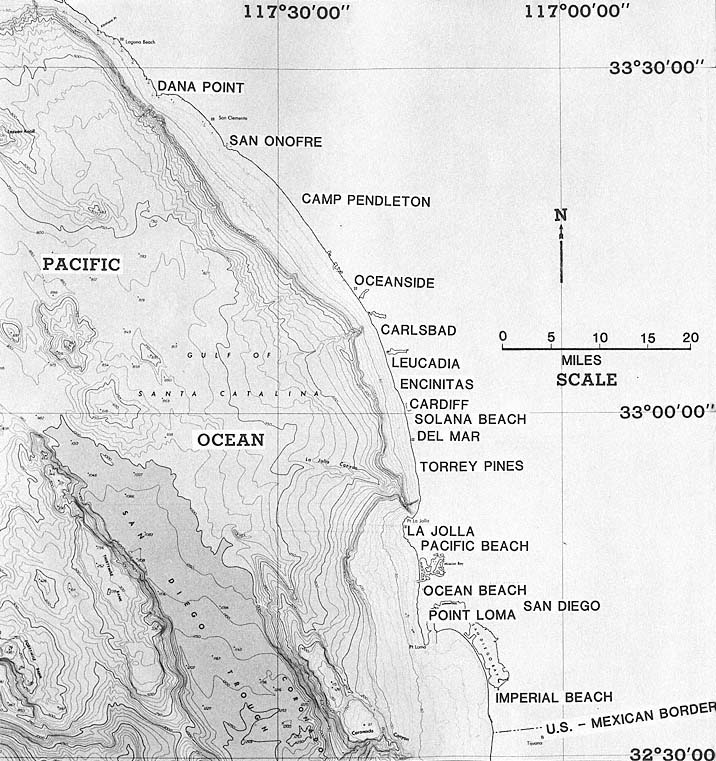
Figure 1
Location map of the study area.
1—
General Description of Coastal Area
The coast of San Diego County is a combination of both sea cliffs and lowlands, the latter occurring where valleys enter the sea and estuaries are cut off by barriers (fig. 1). Thus we have few embayed coasts, which are so common on the east coast and Gulf Coast as well as in the northwestern United States. The cliffed coasts are, for the most part, relatively straight, although considerable irregularities exist off Point La Jolla. This irregularity is not as pronounced now as it was a half-century ago, before waves had cut back some of the projecting spurs. The cliffed coasts are cut mostly in consolidated rock of somewhat uniform material, which usually results in straight coastlines. The cliffs vary in height; the highest portion is between La Jolla north to Sorrento Valley, where some vertical cliffs reach 350 feet. Except where the cliffs are on projecting points, they are bordered by sand beaches which are denuded from time to time, exposing underlying gravel and cobbles.
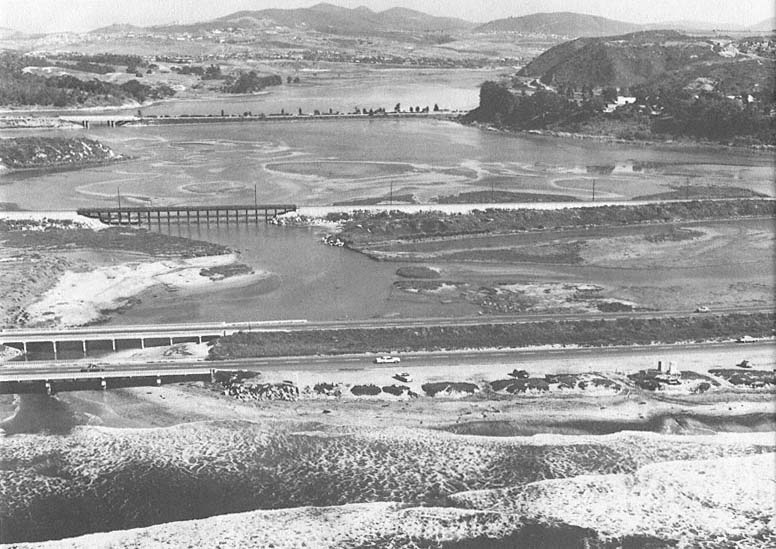
Figure 2
Batiquitos Lagoon showing sediment flowing out to sea after artificial opening, 1980.
Photo : G. Kuhn.
Another type of cliffed beach consists of unconsolidated alluvium. These cliffs are usually quite low, rarely exceeding twenty feet. Like the rock cliffs, the alluvial ones are quite straight and are bordered by sand beaches, except when the sand is temporarily stripped away to expose gravel or underlying rocks. The most extensive stretch of high alluvial cliffs is south of San Onofre, extending south through Camp Pendleton almost to Oceanside. Another example, of low alluvial cliffs extending a third of a mile, is at Scripps Institution of Oceanography in La Jolla.
The low coasts occur at the mouths of major river valleys. These lowlands were estuaries in the past, after the sea level rose owing to melting continental glaciers, which raised the level of the ocean by some 400 feet and flooded all these valleys, except where the rise in the land exceeded the rise in sea level. Considerable erosion from the highlands filled these estuaries sufficiently in recent years so that longshore currents were able to build barriers across their mouths; in the case of San Diego Bay, the entrance has been kept open by the strong tidal currents and probably to some extent by earth movements. Other estuaries are opened artificially to let floodwater out from time to time (fig. 2). The barrier beaches include one south of San Diego Bay, which extends all the way from the U. S.–Mexican border north to what were formerly the Coronado Islands (not to be confused with Los Coronados located off Baja California). The U. S. Coronado Islands have been tied to the mainland by predominantly north-flowing, sediment-laden currents (fig. 3).
A large U. S. Navy base and airfield on Coronado has considerably changed the contour of the former islands by ground-filling; the breakwater at the entrance to the bay has also played an important part, as has the building of high-rise condominium apartments at the north end of the spit. The importance of artificial earth movements, however, is not known.
One special type of coast is represented in the San Diego area along the north side of Point La Jolla. A row of sandstone bluffs with deeply penetrating caves at their base probably represents a fault scarp. There is no wave-cut
Figure 3
Longshore current observations along the Coronado and Imperial
Beach (Silver Strand) during the late 1940s. From Shepard 1950.
terrace directly at the base of the cliffs, as would be produced by marine erosion. The cliffs descend to a moderate depth before encountering the rock shelf off the coast to the south. This certainly suggests down-faulting, which is entirely likely in view of the location in line of continuation with a fault at the north base of Mount Soledad.
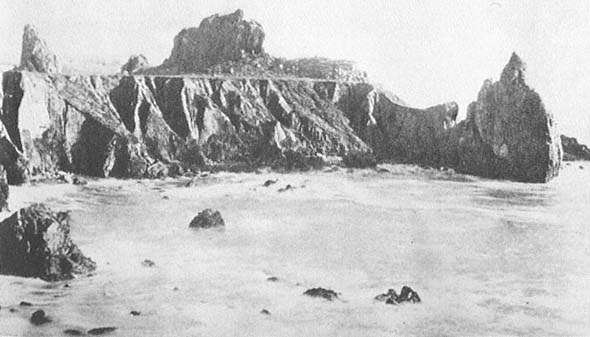
Figure 4a
Sea cliff north of Port San Luis prior to 1898.
Photo : George W. Stose.
2—
Methods of Study
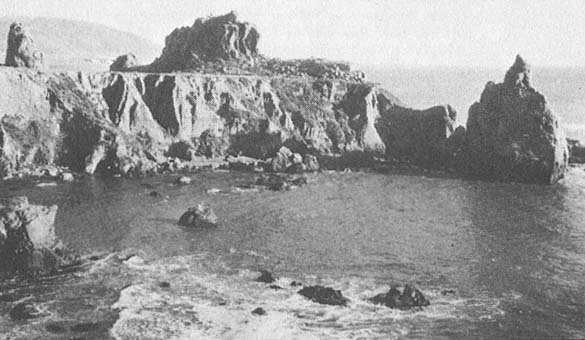
Figure 4b
View from the same spot, 1945. Note the almost complete absence of erosion in the interim. Numerous rocks
can be matched in the two photographs.
Photo : U. S. Grant IV.
A useful method for determining the nature and extent of coastal retreat is to examine old photographs of the coast and compare them with recent photographs taken of the same places. Identification of coastal shapes and sedimentary structures, buildings, or other landmarks is used. This method was employed extensively in Our Changing Coastlines (Shepard and Wanless 1971). It was especially appropriate where arch rocks had been photographed several score years before and could still be identified at the present (figs. 4a, 4b). Many old photographs, however, show nothing that can be recognized today, and often the position from which the old photo was taken seems to have disappeared so that a direct comparison is not possible. Emery and Kuhn (1980) obtained better results by examining photographs of low rock terraces in the La Jolla area taken by Emery around 1940, which show details of tidepools and concretions which could still be recognized. Some of these photos help present a clearer idea of small-scale erosional changes.
Kuhn has numerous photographs of cliff tops and adjacent buildings in the area extending from Del Mar north to Oceanside. Photographs of this area have been taken frequently enough to comprise a series that shows an amazing amount of change in an area previously thought by land developers to be stable. For example, a series of photographs shows dramatically that caves along the base of the cliffs in Solana Beach were subject to many changes, a fact that was previously unrecognized. The entrances to the caves are considerably enlarged after periods of storms. New caves can be created in days rather than centuries. This simply had not been documented before Kuhn's intensive studies were made.
Examination of old land surveys, county tax assessor records and coroner reports, as well as myriads of old charts (particularly those of the U. S. Coast and Geodetic Survey) and old railroad maps revealed a wealth of information scarcely touched upon previously. Also of prime importance are data collected by the U. S. Army Signal Corps (Monthly Weather Review ) between 1872 and
1892. These data include documentation of rainfall, floods, earthquakes, volcanic activity, windstorms, and descriptions of sea storms from vessels' logs. Also important is extensive study of the historical and scientific literature of the area.
Figure 5
Rainfall measurements and other climatic indicators for southern California: A .
Rainfall at Julian, 1880–1980. B . Combined-core varve thickness index for Santa
Barbara Basin expressed in standard unit form. Generally negative unit values
from 1824 to 1859 reflect bioturbation. From Soutar and Crill 1977. C . Standardized
tree-ring indices for Pseudotsuga macrocarpa big cone spruce trees along steep
slopes of Santa Ana Mountains (elevation 4000 ft.). From Douglas 1973, 1976. D .
Winter sea "surface" temperature 5 m below the surface at La Jolla, partly
reconstructed from tree-ring data.
From Douglas 1976. Complete figure taken from Emery and Kuhn, 1982.
3—
Climatic Changes in the Past Few Centuries
In making estimates of changes likely to occur in the coastal area of San Diego County, it is important to have information about the occurrence and types of changes in the past—for example, whether the changes occurred gradually or suddenly. If the latter is true, a recurrence of the same climatic conditions could certainly increase the rate of erosion compared with what it has been in recent decades.
We have some means of discovering what has happened in the past, particularly for the period since records of rainfall have been kept for San Diego and the adjacent mountain stations, beginning in about 1850 (fig. 5). Another source of information is tree-ring data, traceable back to about 1400; these provide good records of relative rainfall and temperature and allow comparisons with present conditions. Tree rings appear to be a fairly good index of rainfall, with years of abundant rainfall producing thick rings. The tree rings examined, however, were necessarily obtained from the mountain area east of San Diego because the only tree that grew consistently along the coast of San Diego County was the Torrey pine, which receives much of its moisture content
from the coastal fog and lives only a century or two. We must therefore assume that rainfall in the mountains was relatively comparable with that along the coast, which is only partly true, as can be seen in figure 5.
We also have records kept by early ranchers and by the Catholic fathers from the coastal missions; these provide general information about wet and dry periods. Ship captains kept logs which also give us an idea of the general weather conditions before rain gauge data became available. These information sources indicate the general character of the climate during centuries past.
Explosive Volcanic Eruptions and the Immense Alteration of Weather Associated with Them
Coastal erosion is greatly dependent on the weather, a fact that is easy to appreciate during storm conditions with strong onshore winds, when erosion occurs much faster than under ordinary conditions. It is important, therefore, to know if there are various background influences that affect the weather. It has long been felt that great explosive volcanic eruptions could have considerable effect on the climate of the earth (Abbot 1913; Abbot and Fowle 1913; Humphreys 1913, 1914, 1918; Huntington 1914, Wexler 1952; Rampino and Self 1982). It has only recently been recognized that it is not the quantity of ash and gas thrown into the atmosphere, but rather the quality of the gases (especially sulfur dioxide which produces aerosols when it condenses into small globules) that influences the arrival of heat from the sun to the earth and the reflective heat from the earth in such a way that the climate is affected. Several books have been written claiming the great eruptions of the past have caused a lowering of the earth's temperature, although by a very small amount: a percent of one degree centigrade to as much as one or two degrees centigrade (Griggs 1922; Humphreys 1929; Lamb 1972, 1977). Even this has been seriously challenged by the scientists of the U. S. Weather Bureau, who are inclined to believe
that volcanism is not an important factor in producing the great weather changes which one observes from time to time. However, while studying the history of weather during the last 200 years along the California coast to help predict what might be expected in the future, we discovered evidence that storm conditions and great floods had occurred in periods following several of the great eruptions. Scientists from Woods Hole Oceanographic Institution (Stommel and Stommel 1979, 1983), investigating weather conditions after the eruption of Tambora (generally considered to be the greatest explosive eruption of the past two centuries), discovered that about a year after this event, the northeastern United States had virtually no summer. Freezing conditions and snowstorms occurred during the normal summer months, and most agricultural products were ruined, causing great hardship. Northwest Europe seems to have experienced similarly anomalous conditions during that summer, although quite a different effect was reported in Siberia where the weather was much warmer than usual (Post 1976). This seems to indicate that the small globules that form in the upper atmosphere after the volcanic material is introduced do have a decided effect on the weather. Further, some months after the great Krakatoa eruption in 1883 on an island between Sumatra and Java—which produced, among other effects, huge tsunamis—there was a very curious change in the weather on the southern California coast, even more than that described in New England after the Tambora eruption. The most devastating flood to hit the San Diego coastal area in historical times occurred, and huge amounts of concentrated rain fell (Kuhn and Shepard 1981). Weather reports from around 1884 showed great windstorms including a huge number of tornadoes and hurricanes around the country (U. S. Army Signal Service 1884a ). This leads one to believe that general stormy conditions prevailed nationwide, which is quite unusual, according to weather records for years preceding and directly following the eruption.
We examined papers describing the stormy conditions that followed many major phreatic volcanic eruptions and began to wonder if perhaps these great
eruptions were not generally followed by a deterioration of the normal weather patterns. Although our initial findings were not taken seriously by most meteorologists or U. S. Weather Bureau scientists, we persisted in our investigation and found that weather scientists in general had overlooked what we considered to be the largest and best source of information on historical weather and possible effects of the explosive eruptions, namely, the weather reports kept in great detail beginning in about 1872. They were first collected by the U. S. Army Signal Service, then by the U. S. Department of Agriculture, and finally by the U. S. Weather Bureau. In all, we have about 110 years of detailed information regarding weather in the United States and neighboring areas during this period. At least five major explosive volcanic eruptions occurred during that time.
After studying these records, we realized that what we most needed next was another large explosive eruption which would allow us to evaluate these effects firsthand. Lo and behold, within two years, in March and early April 1982, there was a great eruption. El Chichon Volcano in the Yucatan Peninsula in Mexico, which had been dormant for over 1,000 years, erupted violently, throwing huge masses of material into the upper atmosphere which in turn formed a cloud that began to move around the earth, presenting us with a fine opportunity to observe weather effects.
At first, this Mexican eruption was thought to be minor in comparison with the great eruptions of Krakatoa and Tambora. However, through the use of weather balloons, high-flying planes and satellites, as well as by observations from the Mauna Loa Observatory, it was found that the aerosols produced by this eruption were of tremendous proportions and, in terms of producing weather changes, were at least as great as those of Krakatoa a hundred years earlier (Rose 1983). This was perhaps because the volcanic material, in rising to the surface of the earth, passed through a layer containing an abundance of sulfur. Furthermore, the aerosols were producing a decided decrease in sunlight recorded at the Mauna Loa station and elsewhere—as much as 25 to 33
percent (Rose 1983). Many observations supported the fact that this was a very important eruption as far as producing changes in the weather patterns. We were therefore encouraged to continue our investigation and kept day-to-day records of what happened to the weather after the eruption. We also reexamined in great detail the tremendous amount of material describing the weather following the great eruptions.
At about that time we also became interested in determining if changes in the weather precede an eruption. Reports by other scientists such as Mass and Schneider (1977) averaged temperatures over annual periods directly before the great eruptions. These studies revealed a lowering of temperatures by less than 1 degree centigrade worldwide, not enough to be very impressive, but enough to send us back to the best source we had: the weather records. We studied the weather conditions that preceded and followed the eruptions, since our earlier findings showed weather changes to be more pronounced a few months after the eruption as opposed to immediately following it. We continued the study as long as the weather following each eruption seemed abnormal. We then prepared a series of graphs showing the various weather conditions for a period of six months before and a variable number of months after each eruption (up to as much as three years). We next studied the weather during several low-volcanic periods to compare with that of postvolcanic periods, and graphed the information.
The best way to show our results is to compare the weather before and after each of the great eruptions that occurred during the last hundred years, about which we have excellent information for the United States and Canada and a small amount of information from the rest of the world. We begin with a description of the weather starting about six months before the eruption of El Chichon in Mexico and continuing for fourteen months following the eruption, which is as far as we can go as this is written. The results were almost immediately and startlingly close to our expectations.
The first indication that something unusual had happened after the erup-
tion was seen one month later, in May 1982. News came from China that the levees built by the Chinese Republic to give complete assurance against floods had broken because of the extremely heavy rains there (journalistic report). This resulted in massive flooding and great loss of life and property. A month later Japan reported the greatest flood in the history of their records on the island of Honshu, again due to heavy rains during the month of June (Le Comte 1983). It was a disaster in many areas of Japan.
Meantime in southern California, we noticed that our usual spring fogginess was absent. As the season advanced, the weather, rather than growing warmer in the summer months, was actually growing colder. Heating bills were higher during June than they had been in the middle of the preceding winter.
As the summer months continued, floods developed in many areas. The Plains states in the upper Mississippi Valley were flooded, putting much of the grain-growing area under water, and causing crop losses. During this period we found newspaper reports of new floods almost every day. Tennessee and Kentucky were especially hard hit. As the fall months arrived we had personal reports of windstorms and heavy rain along the west coast of the United States. Fortunately for southern California, a high pressure area in the atmosphere prevented many of these storms from reaching land as they moved down from the Aleutians, or east from the Hawaiian Islands, or north from Baja California. They were violent in the northern part of the state of California and caused considerable downpours as they moved through the Rocky Mountain system and farther east.
In November a great hurricane hit the island of Kauai in Hawaii, with wind velocities of over 130 miles per hour and waves along the southeast coast of up to thirty (possibly forty) feet high. Enormous damage resulted; buildings were destroyed and houses were completely wrecked, with nothing but the foundations remaining (TemBruggencate 1983). Part of one hotel was virtually washed out to sea.
Since that hurricane there have been five others of at least moderate size
that have hit French Polynesia in the south Pacific, showing a widespread effect of heavy winds and a rise in temperature affecting almost all of the equatorial Pacific. The trade winds mysteriously ceased and even reversed themselves (NMC, NWS, NOAA 1982).
Continuing into December, the storms on the west coast of the United States intensified and broke through the high pressure area that had been protecting southern California. The storms devastated coastal buildings with large waves and high winds, separately and occasionally at the same time. Later the rainfall increased, and in 1983 San Diego County had the second heaviest March rainfall in the records of the Weather Bureau (San Diego Evening Tribune , 24 March 1983). One storm in late January 1983 coincided with a very high tide, and particularly heavy erosion occurred. The coast retreated as much as fifteen feet in a number of places, and many stairways leading down the bluffs to the beaches north of San Diego were destroyed. Great caves formed along the coast. Farther north, the storm was much more intensive, and coastal retreats up to one hundred feet or more occurred in several places; as far as we know, this was one of the greatest storms since those that followed the eruption of Krakatoa. The storms continued east, causing further devastation, including a major flood in the Mississippi Valley. Snowstorms greater than any since 1885 (during the period following the Krakatoa eruption) hit the Colorado area, and record snowstorms were reported in many parts of the east. This period is now recognized by many Weather Bureau experts as one of very unusual weather (Wagner 1983), and there seems to be little doubt about the cause: the effect of the great mass of volcanic material which in turn formed into aerosols in the upper atmosphere.
One very interesting effect possibly connected to the recent volcanic activity of El Chichon is the sudden increase in water temperature off the coast of Chile and Peru which was measured a little over a month later, a phenomenon known as El Niño. This was followed by great floods along much of the west coast of South America. Great El Niños seem to be most common in periods
directly following volcanic eruptions. Whatever force causes the eruption may also be responsible for the warm-water trend characteristic of the great El Niños of the century. The rise in water temperature causes a general change of water circulation patterns, including movement of the warm water to more northern areas such as occurred during the fall of 1982 when abnormally warm water existed from the tip of Chile to the Gulf of Alaska and as far west as the International Dateline. We have seen it in San Diego, where water temperatures during the winter of 1982–83 rarely fell below 60 degrees, which is very unusual. The fish fauna in the area is changing because of the warm water, and many atmospheric conditions have been modified as a result. All these phenomena fit together in some way and should all be considered.
Going back in time to 1979, the present major volcanic episode was introduced by a moderate-size eruption, Soufriere in the West Indies in April (Simkin et al. 1981:155). During the six months that preceded the Soufriere and El Chichon eruptions, the weather became much colder than normal (Ludlum 1979–1980), and as the eruptions approached, a great Arctic outbreak swept over the United States (Phillips and Aston 1980; Wagner 1980; Ludlum 1982). The record cold preceding Soufriere was also reported in Great Britain and in Eastern Europe; and Siberia experienced the coldest temperatures in 100 years (Le Comte 1980). Thus there seems to have been a more or less worldwide temperature decline just before the beginning of our present volcanic era.
With the eruption of Soufriere, the weather became much milder in the United States, and within a month heavy rains became widespread both in the United States and in the eastern world, while at the same time terrible drought conditions were reported in South Africa, India, South America, and the Middle East. Shortly after the eruption of Soufriere, the intensive flood conditions that are so dominant after an eruption began without the usual delay. Record rains also occurred in France and England. In the United States, tornadoes were extremely abundant. These stormy conditions persisted for almost a full year after the eruption, although the tenth and eleventh month afterward had some
periods of unseasonably warm weather, followed again by a cold wave. At this point, it is inadvisable to follow this postvolcanic episode any further, as it runs into other eruptions which complicate the picture.
We will examine next the 1963 eruption of Agung Volcano, located on a little island just west of Bali (Simkin et al. 1981:150). The volcano erupted in the spring, which seems to be a marked tendency with the large phreatic eruptions that have occurred during this century. We know that a great deal of debris was thrown into the upper atmosphere. Very cold conditions preceded the eruption during the six months studied, especially during the month immediately before the eruption, though it was not as cold as before the eruption of El Chichon. After the eruption there was a decided change in weather conditions. Weather turned warmer than normal for a week, then became cooler, returning to the cool temperatures that had preceded the eruption.
About four or five months after the eruption, what appears to be the effect of the volcano is almost as evident as it was after the El Chichon eruption, with floods, tornadoes, and stormy conditions being very common. In fact, 1964 and 1965 were years of record numbers of tornadoes (Hardy 1966). This condition lasted for about three years before returning to more or less normal patterns. Our records and tables show a clear contrast to what would be considered normal weather. Cold weather preceded the eruption; a great deal of rainfall and stormy conditions were reported afterward, with rapid alternations of warm and cold temperatures. This also seems to be true of the period after the El Chichon eruption described previously. The Agung eruption has been studied in detail, and although the advanced methods used to measure the atmosphere after the El Chichon eruption were not yet developed, it seems fairly certain that this eruption was accompanied by the production of great quantities of aerosols.
Going further backward in time to June 1912, the next eruption of note was Katmai in Alaska. This eruption sent great clouds of ash, and presumably the usual gases, into the upper atmosphere, though little is known about the
measurement of the latter. It is known, however, that the eruption was preceded by record cold weather during most of the six months for which we have weather data. There was some heavy rain, indicating that it was not as dry as the periods that preceded some of the other major eruptions. It is also known that almost immediately after the eruption, within a few days, a haze or dry fog swept down from Alaska and was observed in Wisconsin (Kimball 1913). It was later seen in Virginia and in a widespread area farther south. Interestingly, this mist or dry fog seems to have accompanied various weather conditions. The weather had been quite mild just after the eruption, but within a day or two it turned cold all over the country (U. S. Dept. of Agriculture 1913), just at the beginning of what should have been the summer season. Indeed, there was practically no typical weather during the summer months of 1912. Rain increased and produced floods in many places, though these were not as pronounced as after some of the other eruptions. And unlike after other eruptions, the changes following Katmai were almost immediate. We can be reasonably certain that these changes were related to the volcano because of the mist or dry fog that was seen coming down from the volcano.
During the fall months of 1912, the weather turned warm and relatively dry. In other words, the weather was quite unlike that which followed many of the eruptions. The warmer-than-usual weather lasted through the winter months, so there was no typical summer or winter that year. The first winter storms began in March 1913, ten months after the eruption occurred. During 1913 there were alternating periods of warm and cold weather bearing little resemblance to normal seasons. Then about a year and a half after the eruption, flood conditions, which characterize most periods following volcanic activity, did occur, though not as predominantly as after El Chichon and Agung. Thus, a shifting of seasons followed this eruption, although as of yet there is no explanation for this curious condition.
A series of huge explosive eruptions began in 1886 and reached a maximum with Bandai San in 1888. According to our hypothesis, this period would
be expected to show considerable effects from volcanic activity. Following the last of the major eruptions, however, there was a considerable delay in any notable weather changes. The weather was warm and seasonable for a period of a year and a half after the eruption. Then the weather changed drastically for a period of at least one year. The volcanic eruptions actually continued until 1892, but curiously the period in which we have what might be called volcanic weather started in the midst of this volcanic outburst, approximately the first of January, 1890. At that time there was a sudden and remarkable change from the rather mild weather conditions that preceded the eruptions to a violent alternation of very stormy weather and relatively mild weather which lasted for virtually two years. This period included more violent windstorms, flood conditions, and tornadoes than any period during the 110 years for which we have records of weather data. The destruction of property was very extensive during this time. Yet, unlike in other postvolcanic periods, the weather was most often quite warm, although cold periods were interspersed with the unusual warmth.
Finally there is the case of Krakatoa, the great eruption which purportedly produced waves felt around the world. Tide gauges as far away as London recorded the effect of the tsunami it produced, and sunsets were noticeably affected worldwide. The weather preceding the eruption was similar to that during periods before other eruptions. It was mostly cold, but differed from other prevolcanic periods in being quite stormy, particularly just before the eruption. Heavy rain, floods, and tornadoes occurred, which was not the case in periods preceding other eruptions.
The big explosion on 27 August 1883 sent so much material into the atmosphere that the effects were observed worldwide during the months that followed. Strangely, the weather did not change immediately after the eruption; it continued cold, and only moderate stormy conditions were reported for about five months. Then a sudden, drastic change in weather conditions developed. Tremendous downpours produced flooding of monumental proportions. Never in the hundred years that followed has flooding in southern California been
greater. The river valleys were washed clean of almost everything; fortunately, the extensive constructions that now exist in the lower course of the great rivers were not present then. Another notable feature of this period is the concentration of tornadoes. On 19 February, 1884, between forty and sixty tornadoes killed hundreds of people in the southeastern United States (U. S. Signal Service 1884a ). Tornadoes continued throughout the month. At about this time unusually extensive flooding occurred in the lower Mississippi Valley, while killing frosts occurred as late as June over most of the northern part of the country (U. S. Signal Service 1884b ). Wild storms and great downpours continued through the end of the twenty-four months that we examined, and for some time after as well, eventually leading into the next volcanic episode.
Data Analysis
Perhaps one of our best pieces of evidence for the importance of volcanism in relation to weather changes comes from our analysis of the climatic data for the six months preceding and the ten to thirty-six months of unusual weather following each eruption, compared with data from a series of months during periods when little major phreatic volcanic activity was recorded. The latter series was determined by examining the most recent publication of the Smithsonian Institution (1981) which gives a chronology of volcanism. From this we chose periods for which the Smithsonian publication assigned a Volcanic Explosivity Index (VEI) that included no numbers above 2, indicating very light volcanism, though we excluded some periods in this category when additional sources of information suggested higher numbers should have been assigned. In general, we feel that the Smithsonian reference provides fairly accurate information, in addition to being the most updated for this century at the time of this writing.
Our analysis is by month, and each weather characteristic shown in figures 6a, b, c was given a value based on the following formula: If the
| |||||||||||||||||||||||||||||||||||||||||||||||||||||||||||||||||||||||||||||||||||||||||||||||||||||||||||||||||||||||
Figure 6
Compilation of volcanic data showing the relationship to historical weather conditions.
Figure 6a
Statistical comparison between the averaged lowest volcanic periods and each of the
significant posteruptive periods (which varied from 10–36 months in length).
characteristic seemed to be the dominant feature for the month, we gave it three points; if it was one of several weather characteristics noted during the month, it was assigned one point; and if it was not mentioned at all, it was worth zero points. We then added up the points assigned to the various characteristics for
|
Figure 6b
Statistical comparison of the six-month period preceding the major phreatic eruptions.
each month and determined the importance of each particular characteristic on a percentage basis for each of the ten to thirty-six months where it appeared unusual conditions existed following an eruption (fig. 6a ), as well as for the six months preceding (fig. 6b ); in addition, in figure 6c , we included each of
| |||||||||||||||||||||||||||||||||||||||||||||||||||||||||||||||||||||||||||||||||||||||||
Figure 6c
Statistical comparison of low-volcanic period.
several periods when the effects of volcanism were reportedly at a minimum. The results shown in these figures are preliminary, but they indicate a dramatic difference between the periods during which there was little appreciable volcanic influence and the periods following and preceding major volcanic episodes.
Conclusions
The six months that precede the great phreatic eruptions seem to have a consistent characteristic: not only are they colder than average, but each of them contains months during which there are some of the coldest temperatures in all of the 110 years of weather records. It seems impossible that this could be only a coincidence. Moreover, when we looked further back in the record, we discovered, in all cases, that the cold periods did not continue; apparently then, this is a phenomenon that develops shortly before the great eruptions take place. At present we have no explanation for this strange phenomenon, but it is hoped that further scientific inquiry will shed some light on it.
Regarding the weather that directly follows the great eruptions, the patterns are not the same in all cases, except that they all include periods of extremely changeable weather. That is, they all include features such as disastrous floods, an abundance of heavy windstorms coupled with extremely destructive tornadoes and hurricanes, record rains, snowstorms, an abundance of thunderstorms with unusually large hail pellets, and other indications of abnormal weather. Except during the periods following the great eruptions, such conditions are rare. It seems almost certain, therefore, that the cold summers and other abnormal temperatures discovered earlier are to be expected after the great phreatic eruptions, though they form just a portion of the unusual weather.
It would seem from our results that volcanic eruptions undoubtedly contribute to weather changes. We do not suggest, however, that the eruptions alone cause these weather changes. There seem to be other factors that develop before eruptions that are also of importance. In all, the problem still needs considerable investigation.
Great Windstorms of the Nineteenth Century
Going back to the early part of the nineteenth century, we find records of windstorms along the southern California coast that appear to have been more severe than any we have experienced in this century. We have excellent accounts of these storms in R. H. Dana's Two Years Before the Mast (reprinted 1966:56–57), which tells of the author's years as a seaman on a ship carrying cattle hides along the California coast during the 1830s. At the time, the ships were warned to anchor several miles offshore and to be ready at any moment to slip their cables and put to sea because of the sudden, awful southerly storms. The winds during these storms were described as worse than those encountered in rounding Cape Horn, and waves reached a height of fifty to sixty feet. The ships were in real trouble if they did not find shelter behind Catalina Island or elsewhere. Nothing of this sort has occurred, except on extremely rare occasions, since about 1891, and not with any regularity since 1856. We have no way of knowing whether or not these storms have ended forever; nevertheless, a recurrence could be disastrous to present-day shipping as well as to harbors with exposures to the south.
Storms of this magnitude during the last century would have been a tremendous factor in coastal erosion in the San Diego County area. One of the primary effects would have been to carry sediment up-coast in the surf zone, and erosion would have occurred mainly where the coast has an east-west trend, as on the south side of Point La Jolla. The storms described in the 1800s have equivalents today along the coast of Baja California, where Chubascos occur in late summer and early fall, often reaching hurricane velocity. On the very rare occasions when these storms come into California, they are largely spent but do affect east-west beaches such as Newport, where rapid undermining of coastal homes has taken place (fig. 7).
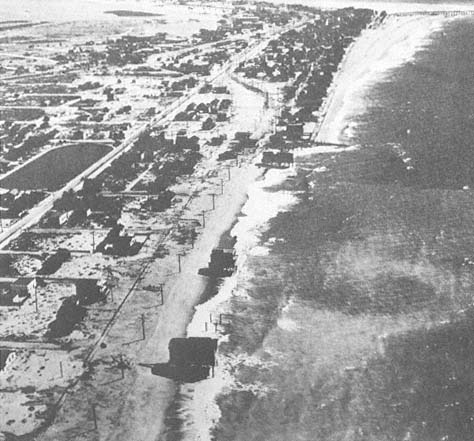
Figure 7
Oblique aerial view of Newport Beach in 1934 showing severe beach erosion and undermined
cottages about 1.5 miles northwest of the Newport Beach Pier. Note the accretion on each
side of the pier. This area was again severely eroded in the winter of 1968.
From: Fairchild Aerial Photos.
Great Floods of the Nineteenth Century
There is no doubt that floods of the past century were caused by rainfall much greater than any experienced more recently. A remarkable flood occurred in San Diego during September and October, 1821, causing extensive damage (J. C. Hayes 1874). The water rose in a single night, filling the San Diego River in Mission Valley from bank to bank, washing away most of the ranches, and changing the course of the river. Amazingly, no rain fell along the coast at the time of the flood, so its source had to be in the mountains to the east.
1862 Flood Period
During the early years of the Civil War, in the winter of 1861–62, southern California, and the entire west coast of the United States, appears to have had a rainy season completely out of line with anything experienced since the white man came into the area. The state was sufficiently populated at the time so that there is no doubt of the accuracy of the reports.
The rain began in December 1861 and continued until the summer of 1862. This period became known as the Noachian Deluge (Smythe 1908). The great Sacramento and San Joaquin valleys of California were turned into a lake about 300 miles long and 20 to 60 miles wide. Many towns were submerged, and the residents had to flee to the surrounding high ground or move to the coast. The state capital at Sacramento was temporarily moved to San Francisco when much of Sacramento was flooded. The governor, state legislature, and state employees were not paid for a year and a half, as the State of California went bankrupt. It was estimated that approximately one-quarter of the taxable real estate in the state was destroyed (Brewer 1966:243). To the south, the narrow coastal plains at Santa Barbara were flooded by the rivers coming out of the mountains, and the town of Ventura was abandoned.
The Los Angeles plains, at the time a marshy area with many small lakes and several meandering streams from the mountains, were extensively flooded, and much of the agricultural development was ruined; small settlements were
submerged in most of the lower areas. These flooded areas were formed into a large lake system with many small streams and a few more powerful currents cut channels across the plain and carried the runoff to the sea. In February 1862, the Los Angeles, San Gabriel, and Santa Ana rivers merged. Government surveys at the time indicate that a solid expanse of water covered the area from Signal Hill to Huntington Beach, a distance of approximately eighteen miles.
In San Diego the flooding coincided with a storm at sea, which backed up the water running into the bay from the San Diego River. As a result, the river cut a new channel into San Diego Harbor. The heavy downpour also changed the look of the land in another way. The previously rounded hills were extensively cut by gulleys and canyons (McGlashan and Ebert 1918:38). Interestingly, there seems to have been no warning to residents of San Diego that a flood was imminent. But then, even today, we are unable to predict the recurrence of such an event. Dry periods are irregular; some are quite long, as were the ones that preceded and followed the 1862 floods; and then again, others are quite short—their termination is likely to be as abrupt as their beginning.
Stormy Flood Period:
1884–1891
Unlike the floods of 1862, those beginning in 1884 could have been predicted in many areas, though with less certainty in California than in other parts of the world. It now seems clear, as previously indicated, that weather changes following the eruption of Krakatoa were the principal cause.
This second extremely wet period began in 1884 and lasted, with intermittent dry years, until 1891 (Kuhn and Shepard 1981). The events of the period are documented in memoirs, letters, and newspapers of the day. The weather was characterized by tremendous downpours; the highest daily, monthly, and annual rainfall levels of record in San Diego County were established during this period. The winters of 1884, 1886, 1889, 1890, and 1891 saw severe cyclonic sea storms, which are unusual for southern California. The intensive rainfall
caused sediment saturation of the bluffs along the coast, and large storm swells and high tides coincided with river basin flooding.
In 1884 there were two separate floods. The first was in February, when the railroad line to San Bernardino was washed out, and for nine months San Diego was cut off from San Bernardino. Several miles of track and all but one bridge between Encinitas and San Diego were washed out, and it was nearly two months before the rail connection between Encinitas and San Diego was reestablished.
Food supplies ran out in Encinitas so a ship was dispatched from San Diego with ten tons of provisions for the stranded settlers. But the heavy rain continued falling, and the waves were breaking far out in the kelp beds or even farther away, so the vessel stayed offshore for over a week, waiting for a chance to unload its supplies. A gale then approached from the southeast, and the ship ran for the lee of Santa Catalina Island. After remaining there for another week, the vessel returned to San Diego, its cargo still undelivered.
The California Southern Railroad station, located directly to the north of Oceanside, near the Santa Margarita Ranch house, reported on 14 February 1884, that in fourteen days rainfall totaling thirteen inches had fallen. This was more rain than had fallen at the same location during the entire previous year. Severe storms were reported throughout San Diego County. The mountainous region to the east was affected by the storms, as reported by the San Diego Union (26 February 1884) following one cloudburst on the southwest slope of Palomar Mountain:
Cloud Burst on Smith's Mountain—A private letter from Agua Tibia near Pala, dated on the 19th, says: "We had the most awful storm Sunday and Sunday night, I ever saw or heard. None of us slept that night. It was frightful. About half past four on Sunday afternoon a terrifying crashing and roaring was heard, and standing in the door we saw a wall of water, seventy feet high, coming down the creek, tearing trees, huge boulders, etc. to pieces, roaring and boiling in its course. It was a
frightful sight. Everything was swept before it. Enough wood was crushed up by this torrent to give us firewood for years. The once thickly wooded glen is swept bare as a sandy beach on the ocean shore. Every tree, shrub and branch is gone. It is absolutely desolate. Surely great destruction must have been wrought along all water courses in the county."
As of 1 April 1884, the California Southern Railroad, which had begun operations between San Diego and San Bernardino only a year earlier, declared bankruptcy on account of the storms and the flooding. By the second week of June, the city of San Diego had measured twenty-five inches of rain, and fifty to eighty inches had fallen in other parts of San Diego County, but the rains began to lessen. By July 1, the rainy season was over.
Between 1889 and 1891, southern California was again battered by violent subtropical storms and exceptionally heavy rainfall. During this period the U. S. Coast and Geodetic Survey (USCGS) was conducting topographic and bathymetric surveys along the coast of San Diego County. The USCGS (1889a ) topographic notes indicate that the bluffs show "new erosion during each winter storm as the characteristic feature of this coast." One thunderstorm hit Encinitas on the evening of 12 October 1889 (U. S. Signal Service 1889), and in eight hours 7.58 inches of rain fell there, while only 0.44 of an inch was measured at San Diego, and 0.04 of an inch at Los Angeles on the same date.
Examination of the 1889–90 San Diego County Tax Assessor records of land parcels located at the mouth of Cottonwood Creek, Encinitas, and south of there (fig. 8a ) indicate that seaward property was greatly devalued or stricken from the tax roles, and land parcels directly inland increased temporarily in value (fig. 8b ). The weather varied greatly from month to month throughout the world during the winter of 1889–90. A stormy condition seems to have prevailed generally throughout much of the United States. During February 1891, there were destructive floods in California, Arizona, and on all major rivers east of the Rockies. Extremely large snowpacks existed in southern California prior to the warm rain that fell from 17–27 February 1891. Pourade (1964:224) noted:
Figure 8a
The assessed value of the former oceanfront and
inland subdivided blocks of Encinitas in the 1880s.
As former seaward parcels of land were devalued,
the blocks directly inland temporarily increased in value.
From San Diego County Tax Assessor
Records, 1886–1892.
Figure 8b
Subdivision map of Encinitas, 1883. Seaward hachured data are from California Southern Railroad
Topographic Survey, 1880. The white dashed line is from the 1883 subdivision map and the California
Southern Railroad right-of-way location map (January 1, 1883). The 1888–1891 lines derive from the
U. S. Coast and Geodetic Survey, and solid black line farther inland represents the approximate 1980
bluff top. Note that more than 600 feet of retreat occurred between 1883 and 1891.
For its brief duration, scarcely more than a week, the storm that struck Southern California and Arizona in February of 1891 was probably the worst on record. . . .
The San Diego River quickly rose to flood level and hundreds of residents flocked to ride the cable cars to the pavilion park overlooking Mission Valley. A solid sheet of water spread across the valley floor and over the tide flat to False Bay [Mission Bay]. Every telephone and telegraph line was out, railroad connections were severed and a heavy storm at sea with gale winds interrupted shipping. Virtually everything that had been built in the riverbeds or on the alluvial plains between the great watersheds and the sea was gone or reduced to wreckage [presumably referring to much of the coast of southern California]. . . .
Bear Valley [south of Escondido near the present Wild Animal Park] reported thirty inches of rain in thirty-seven hours; Cuyamaca, eighteen inches in forty-eight hours, the City [of San Diego] recorded only 2.57 inches for the storm and 4.77 inches for the month.
As these storms moved east, Arizona was devastated. Flooding in Arizona reached a peak in the last week of February 1891, and the U. S. Army reported that the Colorado River was twenty miles wide at the former crossing at Yuma.
August 1891 was the warmest August recorded up until that time along the Pacific coast (U. S. Signal Service 1891:188, 191). Although no rainfall was reported over the greater part of California, a world record rainfall was verified at Campo (near the Mexican border) on 12 August 1891 when 11.5 inches fell in only eighty minutes!
Perhaps the significance of these floods, as far as coastal erosion is concerned, is that the rains that produced them were very concentrated. In more recent times such rains have caused immediate erosion of sea cliffs. One can imagine how this much more concentrated rainfall would have cut deeply into the cliffs and canyons and would have been responsible for landslides of far greater devastation than those we have experienced in recent years.
When stormy seas and heavy rain of this magnitude attack the sea cliffs, erosion can be so disastrous that any buildings on top of the bluffs, so common now, can be seriously damaged if not destroyed. The one foreseeable alternative to this scenario is that the rivers, swollen by the floods, might carry such a large quantity of sediment to the sea that wide beaches would be formed which would, for a time, protect the cliffs from the waves.
Infrequent Floods of the Early Twentieth Century
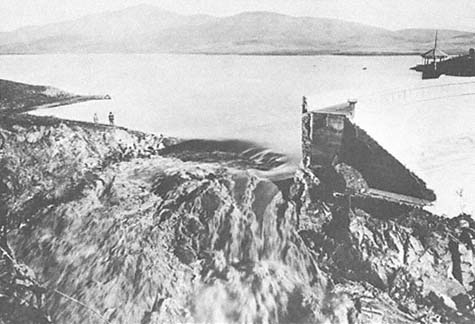
Figure 9
January 1916 view along the lateral margin of Sweetwater Dam showing the break.
Photo : Title & Trust Insurance Co.
The most significant flood of the present century in the San Diego area was in 1916 (McGlashan and Ebert 1918). This was a very localized flood with an interesting story behind it. In 1915 the weather was quite dry, and the reservoirs were receiving little water. There was at this time a renowned rainmaker, Charles Hatfield, who had been successful in Arizona and offered to fill the reservoirs around San Diego within a year for a fee of $10,000. He would ask no fee if he failed (Pourade 1965:204). There was also the condition that he had to prove that he had caused the rain that filled the reservoirs. He proceeded with his operation, and between January 15 and 30, 1916, over seven inches of rain fell in San Diego. Both the Sweetwater (fig. 9) and Lower Otay dams broke, fifty people were drowned, and the city decided to pay Mr. Hatfield only if he agreed to pay for all damages caused by the rain. He declined, and the residents ran him out of town.
Flooding occurred again in 1927, 1938 and 1941, but these more recent floods were not as severe as the 1916 flood, and not nearly as serious as those of the 1880s. In view of the present extensive real estate development in the valleys, lowlands, and along the shore, it is questionable whether any economical or environmentally acceptable technology could protect existing structures in the event of a recurrence of storms like those of the 1880s.
PART II—
DESCRIPTION OF COASTAL HISTORY IN GEOGRAPHIC SEQUENCE
Figure 10
Littoral cells along the southern California coast and the southward termination of each
at submarine canyons.
From Inman and Frautschy 1966.
Figure 11
Oceanside littoral cell that extends from Dana Point to
the La Jolla canyons. The arrow indicates predominant
longshore current direction measured between 1950
and 1978. Since 1978, currents seem to have been more
variable. A recent investigation of Carlsbad Canyon
indicates that this canyon may be more important in
trapping sediment than generally had been assumed.
4—
San Onofre and Camp Pendleton Area
Oceanside Littoral Cell
Investigators have recognized a series of littoral cells along southern California (Emery 1960:27; Inman and Chamberlain 1960). These cells are based on general southerly drift of sediment, largely derived from rivers, and the entrapment of this sediment by submarine canyons which carry it out to sea (fig. 10) and by points of land that jut out perpendicular to the coast. The Oceanside Littoral Cell includes the area from Dana Point to La Jolla (fig. 11). This cell may be further subdivided at Carlsbad Submarine Canyon, although this generally was not recognized in the past.
The Faulted Coast at San Onofre and the Nuclear Power Plant
San Onofre State Park and Camp Pendleton are located in the north central portion of the Oceanside Littoral cell (fig. 12). A general idea of the character of the area is shown in figure 13, a photo taken when only the first building phase
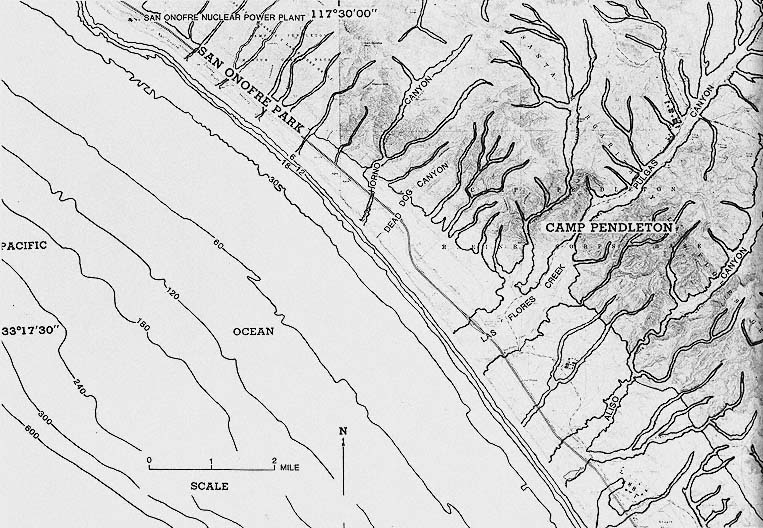
Figure 12
Location map of San Onofre State Park and Camp Pendleton.
NOTE: ocean bottom contours are in feet on this and other maps in the book.
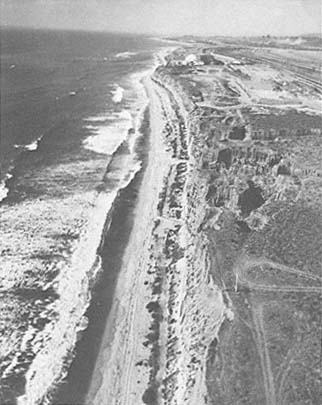
Figure 13
Oblique aerial view looking northwest at San Onofre Nuclear
Power Plant, located directly north of Camp Pendleton, 1970.
Since 1970, two additional units (nos. 2 and 3) have been built
at this nuclear power plant.
Photo : California Coastal Commission.
of the nuclear plant had been completed. The power plant is located on the coastal terrace, which is underlain by Miocene marine rock capped by Pleistocene marine and nonmarine sediments. These Pleistocene sediments are essentially horizontal and are easily eroded from the bluff face and along the canyons.
Approximately 80 percent of the cliffs between the power plant and Target Canyon six miles to the south, on Camp Pendleton, consist of landslides. The Cristianitos Fault is a major structural feature of the region and extends to within about five miles of the construction (not begun at the time of fig. 13) on the seaward side of the plant site. There is considerable difference of opinion among geologists as to the stability of the region relative to recent faulting (Converse, Davis and Assoc. 1970; Western Geophysical Co. of Amer. 1972; Fugro 1974; Hunt and Hawkins 1975; Ehlig 1977a , 1977b ; Fugro 1977; Woodward-Clyde Consultants 1978; Berggreen 1979; Greene et al. 1979; Legg and Kennedy 1979; Greene, Clarke, and Seekins 1980; Green and Kennedy 1981).
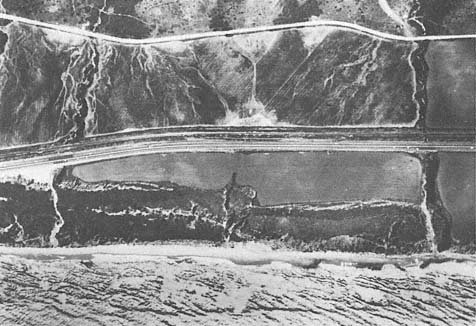
Figure 14
Vertical aerial view of the landslide of 1941 along the cliffs at Camp Pendleton, taken in 1953.
Photo : U. S. Dept. of Agriculture.
Nature of Coastal Cliffs and Canyon Erosion
Early studies of the area conducted by the U. S. Coast and Geodetic Survey (1889a ) concluded that the bluffs eroded during each storm. They also noted that beaches from Los Angeles almost to San Diego were sufficiently wide and continuous to be traveled by horse-drawn vehicles.
The U. S. Army Corps of Engineers (Newton 1960) found that all triangulation monuments set out in 1934 were recoverable in 1958, suggesting that erosion during that period was slight. There were, however, only a few monuments, and they were apparently located outside the landslide zone. Thus a conclusion that there was minimal erosion is not well justified. Actually, there was one major landslide and considerable canyon cutting and bluff-face sloughing. Landslides appear to be directly related to intense sediment saturation and large storm swells. These conditions occurred only during the two wet
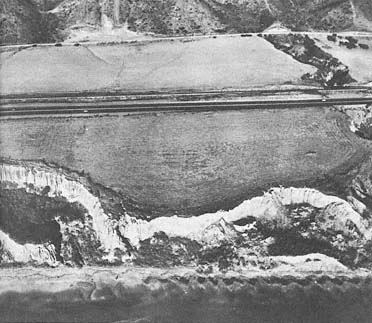
Figure 15a
Oblique aerial view along the bluff at San Onofre State Park, 1954.
Photo : U. S. Navy.
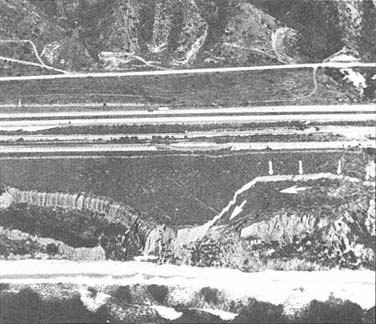
Figure 15b
February 1980 oblique aerial photo showing a landslide measuring 700
feet long by 300–320 feet wide, which occurred in the winter of 1978.
The small arrows show the direction of movement of landslide debris
toward the beach.
Photo : U. S. Navy.
years of 1941 and 1978 (Kuhn, Baker, and Campen 1980). The 1941 landslide measured 1,700 feet in length and 350 feet in width and was along a seaward-dipping plane (fig. 14).
More recently, in February 1978, a landslide measuring approximately 700 feet long by 320 feet wide occurred (figs. 15a and 15b ). The slide apparently was initiated by heavy rain which fell in January 1978. Since the slide, water has ponded on the head of the slump and produced a landward tilting of the bedrock, as shown by the only exposure at the lower end of the block, which dips into the slope. The scarp on the lateral margin on the upper part of the slide is
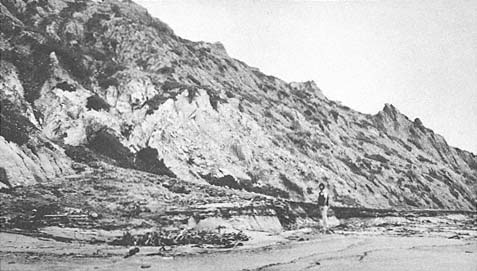
Figure 16
February 1980 view of the debris fan contributing sedimentary material directly to the beach.
Photo : G. Kuhn.
steep enough that slump blocks separate and move on the outer fringe of the main slide. Landslide debris continues to feed the beach as the toe is removed by wave action. Debris fans form in front of small gullies after every storm (fig. 16).
Accelerated Erosion Caused by Man
Since 1885 normal erosion along all drainage avenues has been drastically altered by man. Railroad trestles were built across canyons as early as 1885, but they did not alter the drainage patterns as far as we can tell. The construction of Highway 101, from 1912 to 1918, first altered the natural drainage patterns with the installation of culverts under the highway to channel surface runoff. In the wet years that followed, gully erosion accelerated where culverts concentrated water flow. In the early 1960s, still larger drains were installed under the new Interstate 5. These drains concentrated surface runoff from numerous drainage avenues, channeling it parallel to the highway and then west, under the highway and railroad tracks. There were no severe wet years following the completion of Interstate 5 until 1978, when rainfall was above average and was more concentrated than usual from January to April, and headward erosion along the altered drainage avenues greatly accelerated. The following are some of the
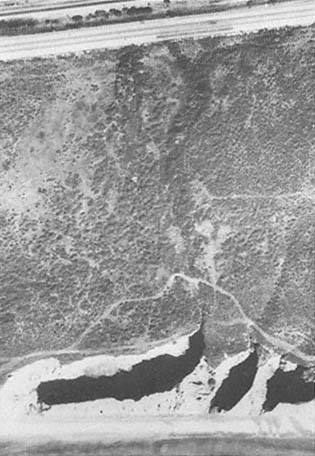
Figure 17a
Vertical photo of the canyon along the bluffs at San Onofre
State Park, 1969. The arrow points to the canyon head.
Photo : U. S. Navy.
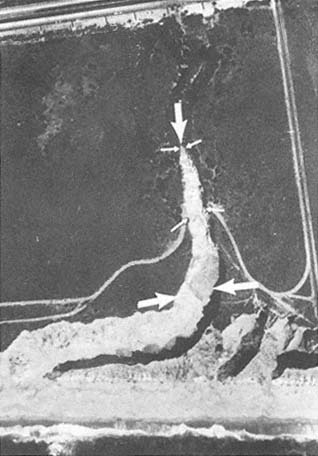
Figure 17b
March 1980 vertical aerial photo showing the development of
a 460-foot canyon perpendicular to the shoreline. It was
extended 235 feet on 20 February 1980 alone.
Photo : U. S. Navy.
more drastic results of this engineering practice.
At Horno Canyon the southbound lanes of old 101 collapsed, leaving a seventy-five-foot deep scarp. At one location, no canyon with an axis perpendicular to the shoreline existed prior to the 1969 storms (fig. 17a ). Sometime between 1968 and 1976, a new canyon was cut perpendicular to the shoreline, about 60 feet headward. Then in January and February 1978 approximately 160 feet of headward erosion occurred, and on February 20, 1980 alone, the canyon eroded another 235 feet landward; this new canyon was 50 to 100 feet deep and 60 to 90 feet wide (figs. 17b and 17c ).
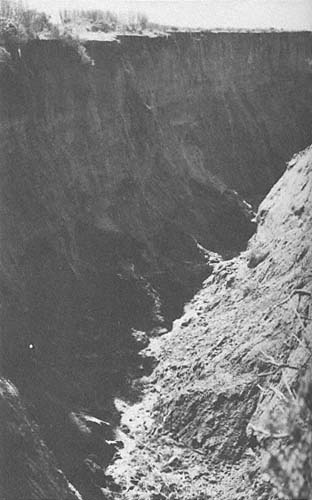
Figure 17c
February 1980 view of the canyon cut into the unconsolidated
colluvial bluff forming terrace deposits at San Onofre State
Park. The evening after the canyon was cut, a park ranger
nearly drove his jeep into the new canyon just before
dark, since it had not been there the previous night.
Photo : G. Kuhn.
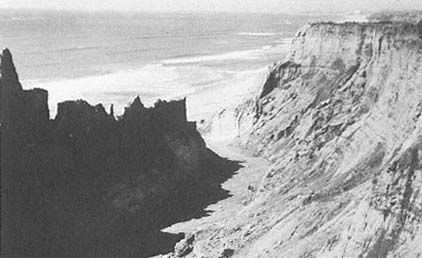
Figure 18
January 1983 view looking down the newly formed canyon, showing how the
sand from the offshore bars has moved onshore to form a wide, new beach.
Dead Dog Canyon, south of Horno Canyon on Camp Pendleton, eroded approximately 560 feet headward between 1932 and 1977. During a two-week period in January and February 1978, this same canyon eroded another 100 feet, and approximately 100 feet more in February 1980. These are just two examples of man-induced erosion which have occurred during the wet years.
Bar System Formed by Rapid Canyon Cutting and Landslides
Prior to 1978 the beaches in this area varied in width from 40 to 60 feet, with few sandbars offshore. This changed in 1978, however, when stormy weather caused extensive erosion of the bluffs and canyons, which in turn provided sediment that widened the beach by at least 40 feet and caused sandbars to form offshore. There were more storms in 1980, and eight to ten bars parallel to the shore were observed afterward. This source of sediment had not been recognized previously, nor had it figured into the sedimentary budget of this part of the littoral cell. Since at least 1950, the predominant longshore transport direction had been from north to south. Had this continued to be the case, large quantities of sediment would have been deposited on the beach in Oceanside and to the south, but since 1980 the net longshore drift has been virtually balanced (Seymore 1980–1982). After the very stormy period from January through March 1983, the beaches along this fourteen-mile stretch of coast were markedly widened and presently vary from 60 to 100 feet wide. It appears that sediment derived from erosion of bluffs and canyons, and landslides between 1978 and 1982 moved back onshore in 1983 (fig. 18).
Figure 19
Location map of Santa Margarita River south through Oceanside and Carlsbad.
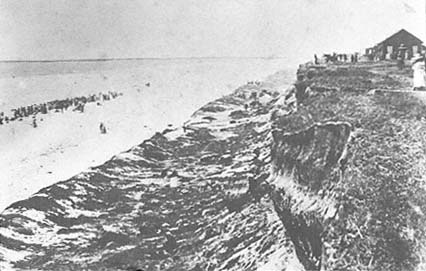
Figure 20
Summer 1885, photo looking north along the bluffs at Oceanside with the wide
beach below. Note the extensive landslide material fronting the cliffs, showing
a predominance of subaerial erosion and a lack of wave erosion.
Photo : SIO Archives, 4 July 1885.
5—
Santa Margarita River South through Oceanside and Carlsbad
Description of the Area
The terraces of the Camp Pendleton area terminate with the entrance of the San Luis Rey and Santa Margarita rivers which come to the coast just north of Oceanside. The City of Oceanside is built on the low terrace margin of Pleistocene nonmarine origin which extends on into Carlsbad and is about 30 feet above sea level (fig. 19). During the late 1880s the beach off Oceanside was approximately 300 feet wide (USCGS 1889b ). In former times this beach, which was practically unbroken from San Diego to Los Angeles, was used as part of a highway for horse-driven vehicles. The cliffs above the beach were retreating during the wet years of the 1880s as the result of subaerial erosion (fig. 20).
Works of Man
In 1888 a supply wharf extending approximately 1,080 feet into the water was built, and with it the first coastal construction began. This wharf, however, was destroyed by rough surf two years later. Nevertheless, local interests rebuilt the wharf, and it was altered and improved several times in the course of the next thirty years without detrimental effect to beach processes (Hales 1978). In 1927, a 1,132-foot open-pile recreational pier was constructed by the city of Oceanside at the foot of Third Street, just north of where the former wharf had been destroyed. The new pier has been severely damaged many times, during periods when depletion of the beach sand berm coincided with large storm swells and high tides. Some 200 feet of the pier collapsed in March 1978 during a perigean spring tide, and in 1983 another large section was destroyed.
In 1922 Lake Henshaw, the largest reservoir in San Diego County, was completed. The structure reduced the sediment-carrying capacity of the San Luis Rey River and thereby diminished the natural supply of beach material to Oceanside beaches. By 1925 the usable beach was quite narrow, and the beach width could be correlated with the stream runoff rate from the river (Hales 1978). The last storm-flood year to contribute appreciable amounts of sediment to southern California beaches was 1938 (Troxell et al. 1942). Following the floods the beaches were considerably widened, and the tourist trade flourished at Oceanside.
From 23 December 1940 through 7 January 1941, a series of storms originating in the Aleutian Islands moved into southern California and considerably damaged beachfront and bluff-top property (Kuhn and Shepard 1979a ). Houses in Oceanside were damaged or destroyed (fig. 21), and the beach berm was severely eroded elsewhere. A thirty-foot swell running along the coast coincided with gale-force winds and the perigean spring tide. Near Wisconsin Street in Oceanside, Sereno Court was damaged. The San Diego Union (27 December 1940) noted:
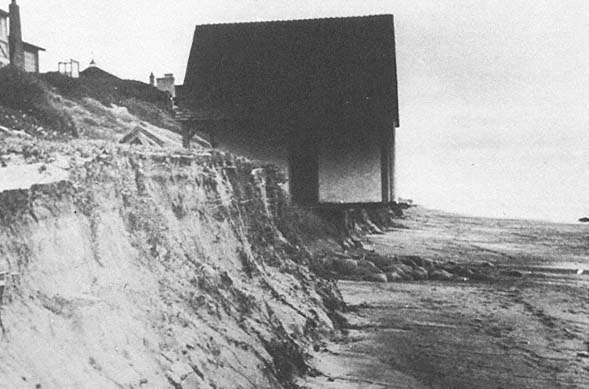
Figure 21
January 1941 beach erosion initiated by a severe storm.
Photo : D. L. Inman.
High tides and a pounding sea continued to damage the Oceanside shoreline. Combers broke over the end of the pier at high tide today. A crew of men worked all day yesterday and today to save El Sereno Court from being swept out to sea. Sandbags have been piled high against the buildings. The Arthur Neff home, which has been protected by a retaining wall, has received a severe buffeting from the sea. Foundations of the Guy Sensaba home are menaced. Precautions were taken today to hold back the sea.
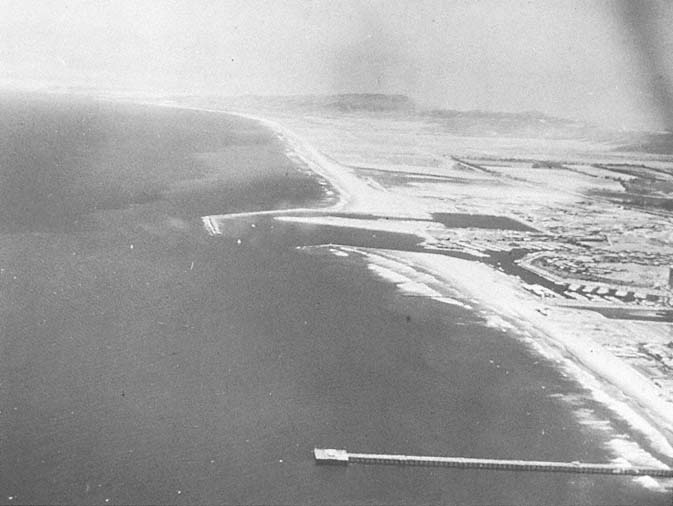
Figure 22
Aerial view looking north across Oceanside toward the Camp Pendleton Boat Basin and the Oceanside Harbor, 1974. Note that
the width of the beach decreases south of the harbor.
Photo : G. Kuhn.
Harbor Construction:
At Camp Pendleton and North of Oceanside
In 1942, under emergency wartime conditions, Camp Joseph Pendleton was created by the federal government with the purchase of Rancho Santa Margarita y Los Flores, immediately adjacent to the northern limits of Oceanside. In conjunction with the establishment of a Marine Corps camp, the federal government built a jetty and boat basin on the beach, just north of the city limits, in order to provide Camp Pendleton with a harbor facility and boat-turning basin.
The harbor began silting up immediately after the jetties were constructed, and much of the sediment which had been carried south to preserve the wide beaches of Oceanside was lost, necessitating continual dredging of the harbor and pumping the spoils to the south to replace the lost material (Inman 1976) (fig. 22). Despite clear evidence that jetties for the boat basin north of Oceanside would cause difficulties for the wide beach off Oceanside, pressure was applied, and in the early 1960s a small boat harbor was constructed south of the ill-fated turning basin at Camp Pendleton. In March 1960, Marine Advisors (1960) made a study for the U. S. Army Corps of Engineers relating to the size of storm waves that would be likely to hit the small-craft harbor site. They showed that waves of over twenty-five feet were recorded at Oceanside during the tropical storm of 23–25 September 1939. In spite of the danger of such storms, the harbor was authorized. In 1963, four million cubic yards of material were dredged to construct the Oceanside small-craft harbor and deposited on what were then the downcoast beaches. This dredge spoil material contained many cobbles, derived from floods of the San Luis Rey River (Hales 1978:20). Approximately ten million cubic yards of sediment, including cobbles, have been dredged from the Camp Pendleton Basin and Oceanside Harbor between 1942 and 1980 (Shaw 1980). Despite this large fill, erosion began almost immediately. In 1965, cobbles made their first appearance on the beach in front of Oceanside, as the beaches eroded.
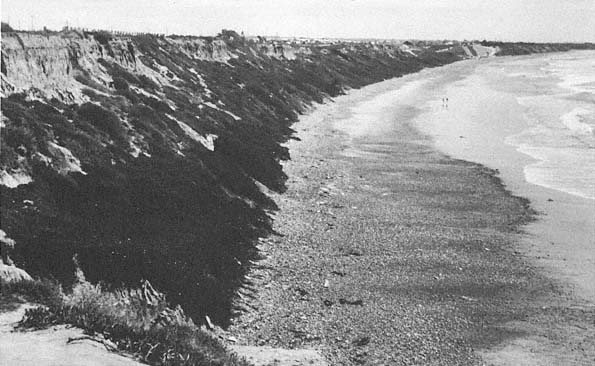
Figure 23a
April 1981 view from the Palomar Airport Road looking south along the beach.
Photo : G. Kuhn.
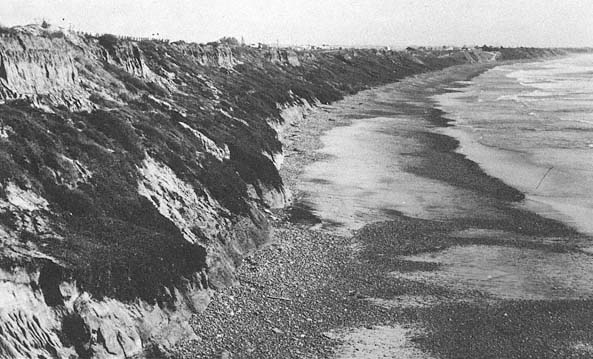
Figure 23b
February 1983 view from the same vantage point as that in 23 a . Note the extensive cliff erosion.
Photo : G. Kuhn.
Cobble Beaches
In southern California beach cobbles are derived from two sources: from rivers as the result of floods, and from sea cliff erosion (Emery 1955). The longest cobble beach in southern California is found in south Carlsbad (Emery 1960:184) (fig. 23a ). During the storms of January 1983, the beach cliff eroded six to ten feet in places (fig. 23b ). In 1960, Emery noted that the cobbles of this beach, which is presently owned by the State of California, were the result of local cliff erosion. Today, however, the cobbles are much larger and were most likely dredged from the Oceanside small-boat harbor to the north, as early as 1963.
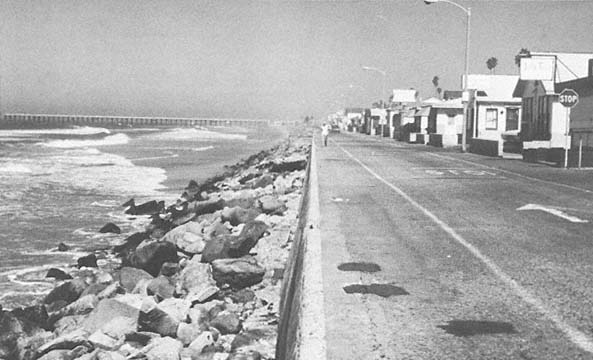
Figure 24a
September 1979 view looking north along The Strand at Oceanside. The structure and road were located on the
former beach. Riprap was placed to protect the concrete seawall and road.
Photo : G. Kuhn.
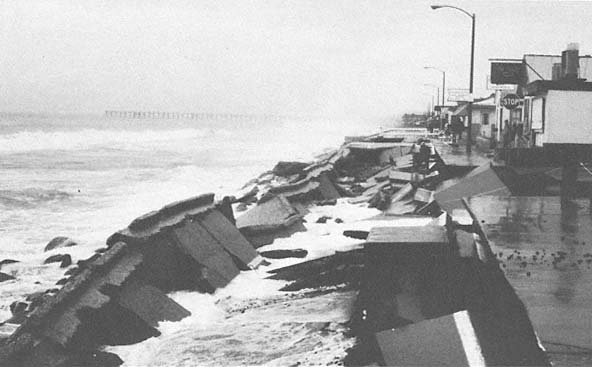
Figure 24b
February 1980 view looking at the same site as that in 24 a . The road and seawall were undermined and collapsed
between 12 and 15 February 1980; the waves were less than six feet high.
Photo : G. Kuhn.
During the storms of 1978 from the south, the beach sand was rapidly removed by storm surge, and the cobbles were withdrawn by the waves and thrown like artillery against houses at Oceanside (Kuhn and Shepard 1980). The cobbles became a destructive element again in the winter of 1980, contributing to the undermining and collapse of the beach road (figs. 24a , 24b ) and to the damage to apartments and homes along the shore (figs. 25a , 25b ). In south Oceanside, roofs collapsed and windows were broken as the cobbles again became projectiles (fig. 26), although the waves were consistently less than six feet in height. Even where riprap protected the shore, the cobbles moved as far as twenty feet up the beach (fig. 27a ). The stones were seen to move along the shore and by June 1978 had largely disappeared (fig. 27b ).
The Army Corps of Engineers (Hales 1978:27–32) suggested several alternatives for stabilizing the sand and creating a buffering beach at Oceanside. These included rock revetments, concrete seawalls, groin systems, sand-fills, breakwaters, and a permanent sand bypass system. At the present time sand-fills are the only method being attempted.
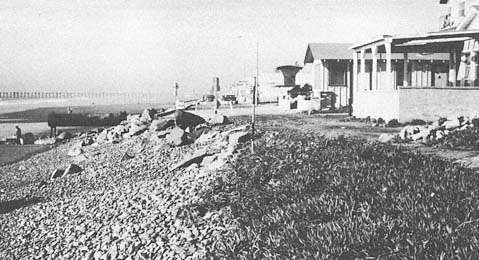
Figure 25a
View of beach cottages south of Wisconsin Street in Oceanside, 4 January 1978.
Photo : G. Kuhn.
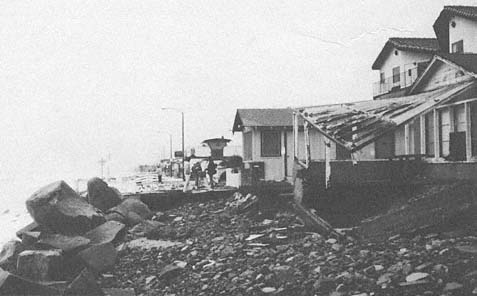
Figure 25b
View at the same site as that in 25 a , taken 17 February 1980. Wave and beach cobble
abrasion damaged houses along the shore during the February storms. Property damage
occurred as the result of cobbles being thrown by waves less than six feet in height.
Photo : G. Kuhn.
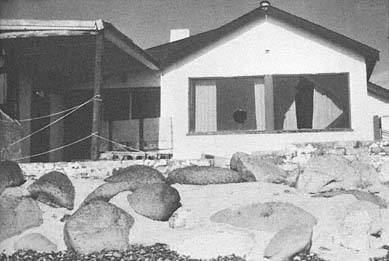
Figure 26
February 1980 view of the damaged beach cottage in south Oceanside.
Note that the windows were shattered and the roof collapsed as a result
of cobbles being thrown by relatively small waves.
Photo : G. Kuhn.
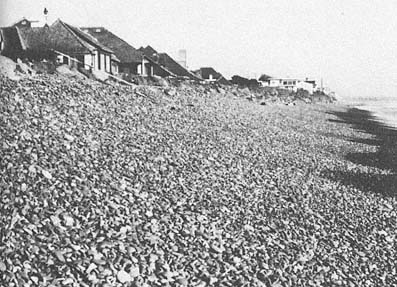
Figure 27a
January 1978 photo of beach cobble abrasion in south Oceanside. Cobbles
moved up the beach eighteen to twenty feet, covered the riprap seawall in
places, and eroded lawns behind the seawall.
Photo : G. Kuhn.
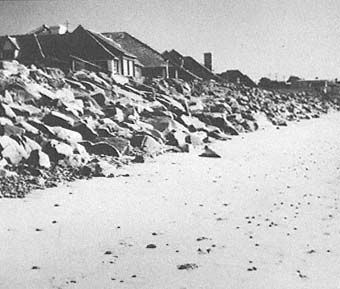
Figure 27b
June 1978 view at the same site as that in 27 a . Only remnant
pockets of cobbles remain.
Photo : G. Kuhn.
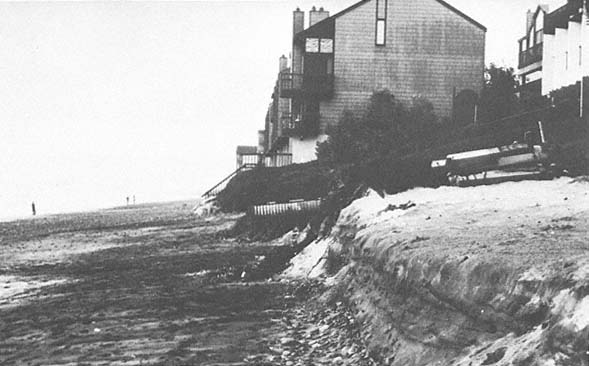
Figure 28a
April 1978 view of eroding beach at Carlsbad.
Photo : G. Kuhn.
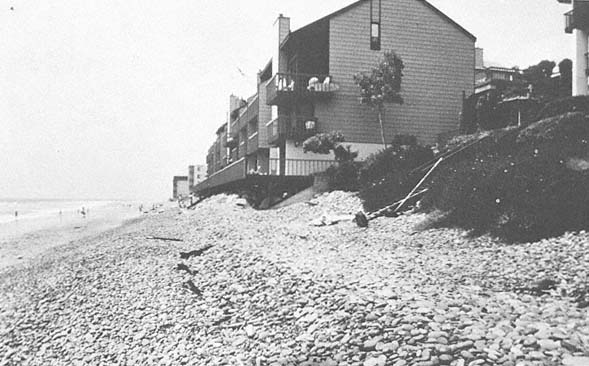
Figure 28b
July 1980 view of the same site in Carlsbad. The sand did not return to the beach this year during the summer.
The cobbles have eroded behind and around the seawalls and the riprap and adjacent to the building.
Photo : G. Kuhn.
Failure of Sand to Return to Beaches During Summer 1980
Beach processes monitored prior to 1978 indicated that sand levels drop during the winter (fig. 28a ) and return again approximately to their usual level in the summer. In the summer of 1980, however, the sand did not return to its usual level along the Oceanside-Carlsbad area (fig. 28b ). As noted previously the longshore currents changed after 1980 at Oceanside (Seymore 1980–1982). An additional factor may be that the Carlsbad Submarine Canyon to the south intercepted the sand offshore.
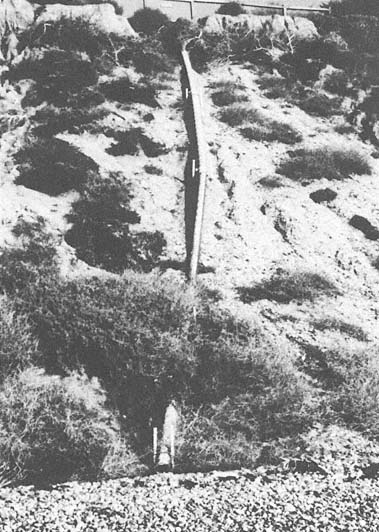
Figure 29a
December 1977 view of the storm drain designed to carry surface water
down and away from the slope face at Carlsbad State Park.
Photo : G. Kuhn.
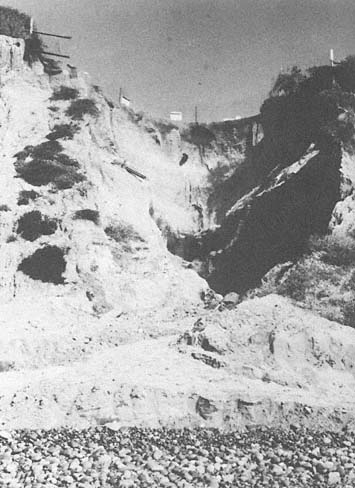
Figure 29b
February 1979 view at the same site as that in 29 a , following the
collapse of the drain pipe, which caused severe erosion of
the bluff face.
Photo : G. Kuhn.
Many cliffs in the area are actively retreating today, not in response to wave action, but primarily because of solution by groundwater and the fact that man has installed storm drains on the bluffs, which were designed to divert surface water away from the bluff face (fig. 29a ). However, in 1978, 1980, and again in 1983, many of these drains collapsed, and escaping water severely eroded the bluff face (fig. 29b ).
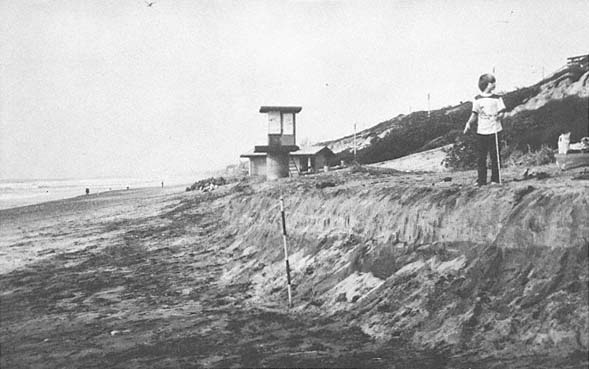
Figure 30a
January 1978 view looking north along Carlsbad beach.
Photo : G. Kuhn.
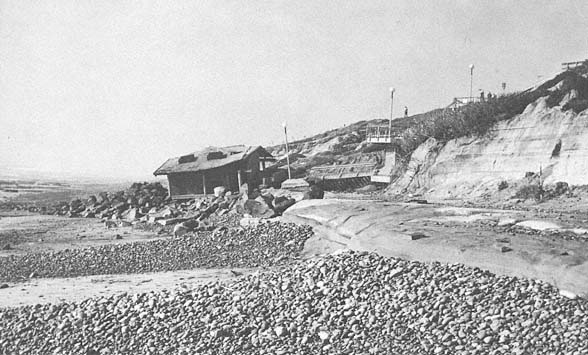
Figure 30b
February 1983 view at the same site as that in 30 a . The lifeguard tower is gone, the restroom and the stairway
have buckled and collapsed, and the cliff has retreated fifteen to twenty feet.
Photo : G. Kuhn.
If the formerly predominant southern transport of sand is not restored, it is difficult to estimate what will happen to the large quantities of sediment found off portions of the inner shelf south of the San Dieguito River (Fischer et al. 1981). At any rate, the beaches from Leucadia south to La Jolla grew during February 1982. An explanation is elusive at this point, but it may have something to do with the change of the longshore current direction. Erosion of the beaches and cliff retreat accelerated during the stormy months in early 1983. At Carlsbad Beach, where concrete restroom facilities and lifeguard towers were built directly on the beach prior to the 1978 storms (fig. 30a ), in 1983 two concrete restrooms were undermined and bombarded by cobbles and small riprap, and eventually collapsed and subsequently were removed. The adjacent cliff retreated by as much as fifteen to twenty feet during one storm (fig. 30b ). The coast highway near the Carlsbad Encino Power Plant was severely damaged and collapsed in places during this storm. Most of this very rapid erosion occurred during the storms of late January and early February 1983, which coincided with the perigean spring tide, a ten- to twelve-foot swell coupled with extremely strong winds.
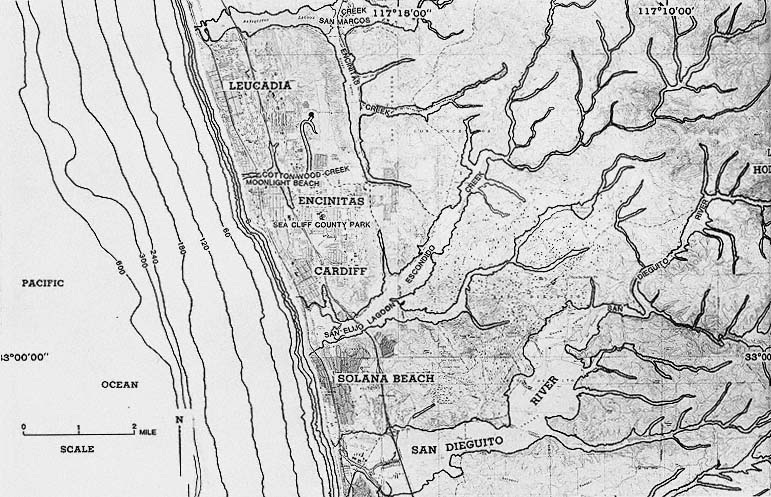
Figure 31
Location map of Leucadia, Encinitas, Cardiff-by-the-Sea, and Solana Beach.
6—
Leucadia South through Solana Beach
Description of the Area
The communities of Leucadia, Encinitas, and Solana Beach to the south are located on beach and dune ridges of Pleistocene marine and nonmarine origin, about 80 to 120 feet above sea level (fig. 31). Cliffs on the seaward side consist of ancient lagoonal-barrier sand bars and open coast sediments. Rapid erosion has occurred in recent years as a result of extensive grading of the iron-oxide cemented dunes and soil horizon along the bluff top. In several areas, the dune has been entirely removed by grading. As a consequence, the natural drainage patterns were altered, and where water had previously flowed landward, away from the bluff edge, it was allowed to flow over and down the bluff face, causing erosion during even the early stages of construction. Once a dune has been removed, the underlying uncemented sand is eroded rapidly.
Old Surveys and Maps of Encinitas Showing Extensive Coastal Changes
The California Southern Railroad surveyed the coastal route from Colton south to San Diego many times between 1880 and 1891, and it was during this time that the county surveyor, L. L. Lockling, surveyed the first coastal town between the city of San Diego and San Juan Capistrano. This town was called Encinitas (Little Green Oaks). John Pitcher had purchased the land of 244 acres at one dollar per acre. The surveys, dating from 1880 to 1883, show more land than exists today: especially large changes took place before 1892.
Five very wet and stormy years followed the surveys, and the county tax assessor records show marked devaluation of seaward property, with a corresponding short-term increase in property value for lots directly inside the bluff edge. By 1889 the coast had changed dramatically as shown on a U. S. Coast Survey map and on composites of the maps from 1880 through 1891 (fig. 8b ).
Of particular interest is the effect of the highly localized storm of 12 October 1889, when 7.58 inches of rain fell at Encinitas in eight hours, while only .04 inch fell at Los Angeles and .44 inch at San Diego during the same period. A water storage reservoir up-canyon from the present-day Moonlight Beach on Cottonwood Creek collapsed, and a great wall of water roared down the canyon, washing away the railroad bridge and destroying ranches in its path (U. S. Signal Service 1889:279). Subsequent county assessor records indicate a devaluation of downstream property and a short-term increase of property directly inland.
As previously noted, in 1884, following the eruption of the Krakatoa Volcano in Indonesia, a short-term climate change occurred in southern California. The weather changed from semiarid and very dry to subtropical, and world-record rainfall levels were recorded. During February 1884, storms lashed the coast, causing flooding of all rivers, and all but two of the railroad
trestles between San Bernardino and San Diego were destroyed. For obvious reasons there was no building being done on the bluffs, beaches, or flood plains, or in the canyons during this period.
Construction on Bluff Tops and Methods for Preventing Bluff Erosion
Beginning in about 1973 condominiums and apartments have been constructed along the bluff tops, many within ten feet of the edge. Numerous recent geologic studies done by consultants for real estate developers indicate negligible erosion of these bluffs since 1928, based on early aerial photographs. What was not readily apparent to the investigators is that bluff and cliff erosion is episodic, site-specific, and directly related to climate changes. The impact of urbanization on the cliffs was also not taken into account.
Examination of sequences of photographs of a specific site revealed not only that erosion occurs sand-grain by sand-grain but also that it is largely episodic in nature, often involving failure of 100 feet along the cliff at one time. In 1973 it became apparent that in the middle of a drought period, cliff collapse was caused at least as much by groundwater and the effects of man as it was by wave erosion.
The groundwater table began rising in 1973, commensurate with urbanization of the adjacent areas. This rise resulted largely from an excessive watering of lawns and the introduction of non-native vegetation to the region. Other contributing factors include agricultural irrigation, leach lines, and cesspools. Sorbon and Sherrod (1977) indicate that overirrigation of landscaping in residential subdivisions alone is equivalent to fifty to sixty inches of rain per year on each lawn. This extensive overwatering in coastal areas has at least three important effects: it has caused a slow but steady rise in the water table, even during the driest period preceding the rainy year of 1978; it adds
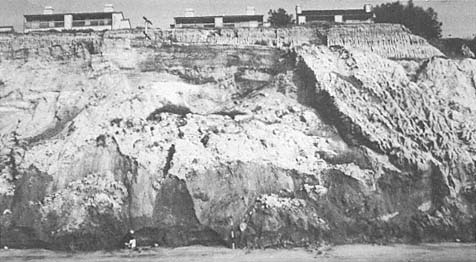
Figure 32a
Views of landslide along the bluffs in south Del Mar, 1977. Note that the groundwater
caused movement of the landslide directly seaward from the new construction during
this drought year.
Photo: G. Kuhn.
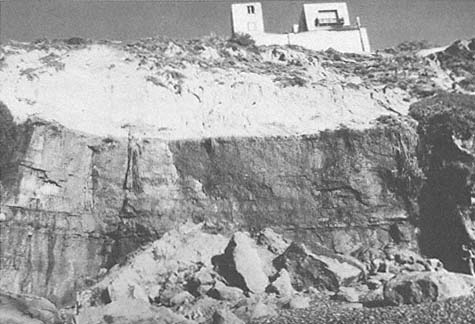
Figure 32b
February 1978 view of block fall and debris at H Street in Encinitas.
Photo: G. Kuhn.
weight to the cliff material and increases pore pressure; and this in turn contributes to landslides (fig. 32a ) and blockfalls (fig. 32b ).
At one location condominiums were constructed over an unrecognized ancient river channel fill (figs. 33a , 33b ). Erosion at the base of the cliff, at the southern end of the condominium site, amounted to ten feet between 1971 and 1978 in two separate five-foot episodes. The homeowners in the project have gone to great expense to stabilize the cliff base and bluff face. In April 1978 a concrete crib wall, designed to prevent further erosion, was near completion (fig. 34a ). However, during the first week of May the crib wall collapsed, severely eroding the bluff face (fig. 34b ). A concrete seawall now exists at the cliff base, and the upper bluff face has been terraced with concrete (fig. 34c ) at a cost of over $2 million to the homeowners.
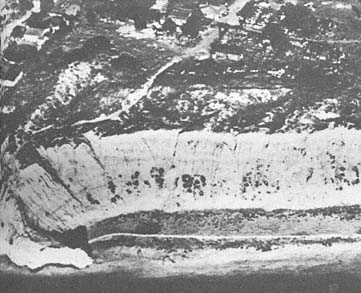
Figure 33a
Oblique aerial view of a portion of south Solana Beach prior to the
bluff-top development, 1954.
Photo: U. S. Navy.
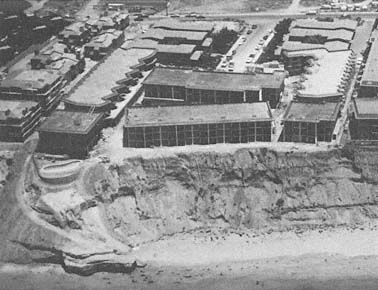
Figure 33b
View of the same site as that in 33 a following development of the bluff
top, 1974. Note that the bluff face began eroding during the construction.
Photo: B and A Engineering.
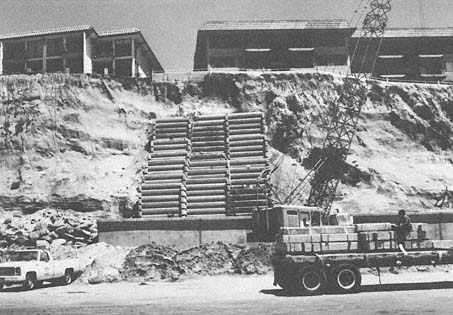
Figure 34a
April 1979 view of the concrete crib wall being installed on the bluff face at Solana Beach.
Photo: G. Kuhn.
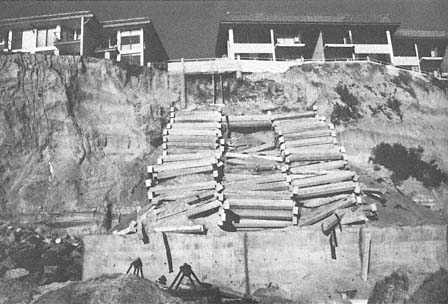
Figure 34b
May 1979 view of the same site as that in 34 a . Note that the crib wall collapsed
before completion.
Photo: G. Kuhn.
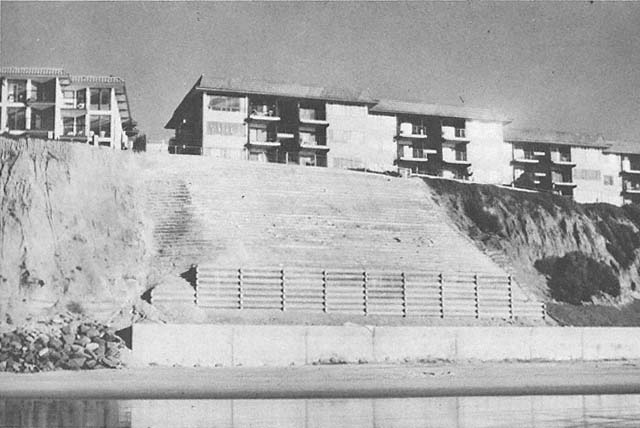
Figure 34c
View of the same site, 1980. The bluff face has been terraced with concrete, and the adjacent bluff face south of the terraces
has been planted.
Photo: G. Kuhn.
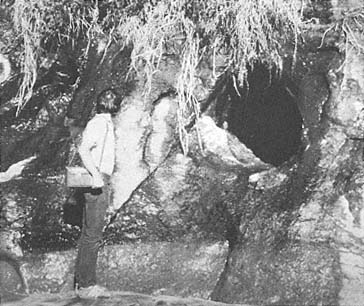
Figure 35a
View of a cave forming above sea level along a remnant of shear zone
in Leucadia, 1980. The cave was formed primarily as result of inland
groundwater exiting the cliff face.
Photo: G. Kuhn, January 1980.
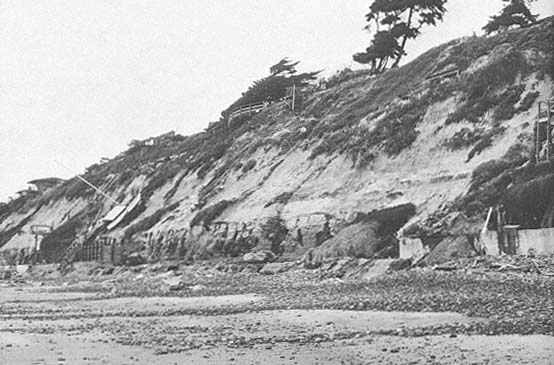
Figure 35b
View in the vicinity of 35a , showing the extensive cliff erosion that occurred during the storms of
January through February 1983.
Photo: G. Kuhn.
Formation and Collapse of Caves and Arches
A unique feature of this section of coast is its caves and seldom-formed arches. The caves are of three different types. First, in Leucadia, the caves are formed along weak rock shear zones four to eight feet above sea level and are solution-formed in origin rather than entirely caused by wave erosion (fig. 35a ). These caves enlarge laterally into the cliffs. They may grow downward and enlarge rapidly as they are abraded by beach cobbles and waves. Accelerated cave and cliff erosion occurred during the stormy period of January to March 1983 (fig. 35b ). Many cave roofs collapsed and cliff retreat amounted to ten feet in places.
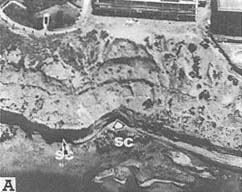
Figure 36a
Oblique vertical photo of condominium
construction in south Solana Beach, 1974.
Note the small cave at the base of the cliff.
Photo: B and A Engineering.
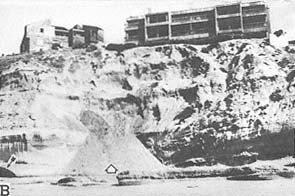
b . View of the same location as that in 36 a , 1975. The sea
cave was formed by beach cobble abrasion and marine
erosion along the vertical remnant shear zone and along
the essentially horizontal weak bedding plane. Note the
recent collapse of the upper unconsolidated sands.
Photo: G. Kuhn.
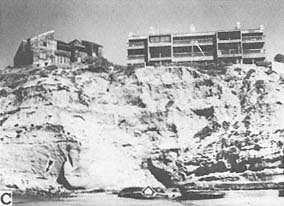
c . View of the same site as that in 36 a and 36b , 1977.
Note that the sea cave on the left has collapsed.
Photo: G. Kuhn.
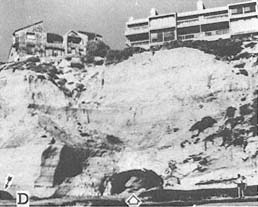
d . June 1978 view at the same site as that of 36 a –c ,
following the storms of February through April
1978. The recently enlarged sea cave is the result of
beach cobble abrasion during high tides.
Photo: Sea Grant/G. Kuhn.
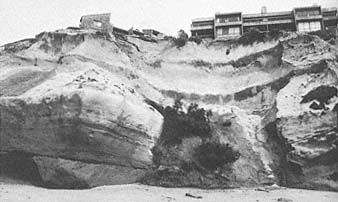
Figure 36e
April 1983 view at the same site as that at 36 a –d following the
latest collapse of the massive sea cave roof.
Photo: G. Kuhn.
Second, exposed caves in Encinitas and Solana Beach are mainly marine in origin and are seen to enlarge and collapse as a result of beach cobble abrasion with relatively small wave activity (figs. 36a –36d ). During the storms in January to February 1983, a massive sea cave roof collapsed, endangering the buildings on the bluff above (fig. 36e ). Third, a recent geological investigation in Solana Beach (Libby 1978; Shepardson 1978) indicates the presence of a large subsurface cavern inland of the cliffs (fig. 37). Concrete was poured into the void that had been encountered during construction. When it was not filled after forty-five minutes, it was assumed that the concrete was flowing into an intricate passageway. Normally such caverns occur in limestone or other soluble rock, not in sandstone. Solana Beach also has sea caves and tunnels caused by wave, sand, and cobble erosion.
Figure 37
Map showing locations of the sea cave in the cliff face and the
cavern located directly inland. During construction, concrete was
poured into the cavern for forty-five minutes before it was realized
that an intricate passageway had been encountered. From Libby 1979.
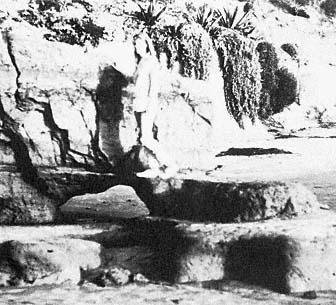
Figure 38a
December 1982 photo showing the early stages of a rapidly
enlarging sea arch forming in weakly consolidated rock.
Photo: G. Kuhn.
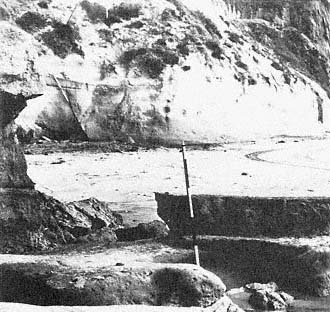
Figure 38b
January 1983 photo showing the same site after the arch
collapsed.
Photo: G. Kuhn.
During the storms in January 1983, many of these caves and tunnels were enlarged in as little as two days. Surprisingly, an arch was seen to form in the slightly consolidated Del Mar formation of Eocene age. It enlarged rapidly between 27 and 30 December, 1982, and collapsed on 1 January 1983 (figs. 38a , 38b ). As far as we know, this arch was formed by the hydraulic effect of moderate and excessively high tides, and without any cobble or sand abrasion. In late January and early February 1983, six feet of cliff face directly adjacent to the arch site also collapsed (fig. 39).
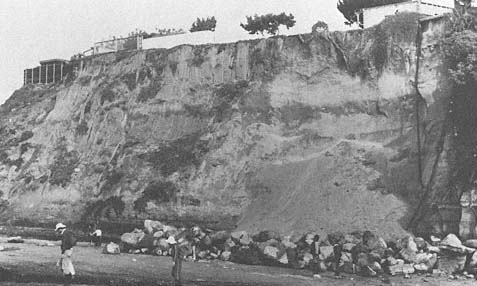
Figure 39
View of the cliff collapse at north Solana Beach, 1983.
Photo: G. Kuhn.
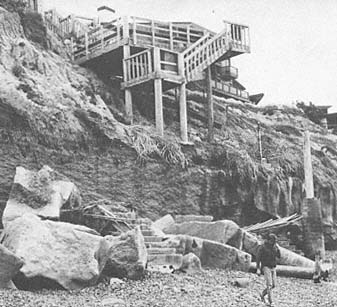
Figure 40
April 1983 view of the public stairway to the beach. The stairs,
in north Leucadia, were crushed by a mass that separated from
the cliff.
Photo: G. Kuhn.
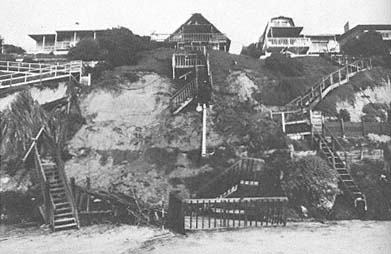
Figure 41
View of the private stairway that collapsed in Leucadia, 1978. Note that
the stairs failed as a result of a small storm-drain collapse.
Photo: G. Kuhn.
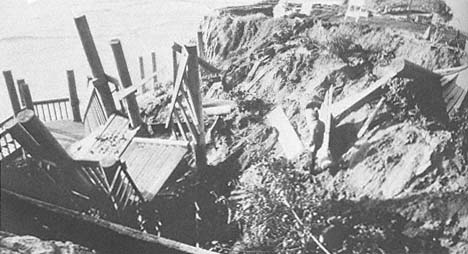
Figure 42
Photo of the stairway at D Street in Encinitas which collapsed as a result of surface
water flowing down the adjacent street end, undermining the underlying buried water
main and causing it to buckle, break, and erode the cliff, 1978.
Photo: G. Kuhn.
Loss of Beach Access Stairs
Public and private stairs of various types of engineering design were located along this section of coast. In March 1983 a section of cliff collapsed, crushing a public stairway and injuring several people who were on it at the time (fig. 40). This apparently was the result of a combination of wave erosion at the cliff base and groundwater sources inland. Along this same section of Leucadia, almost every homeowner, at one time, has had a private stairway to the beach. Most of these stairways have collapsed in recent years, often because of their proximity to broken storm drains and pipes (fig. 41), and many have fallen victim to storm waves. The severe winter storms of 1983 crushed many stairways and caused as much as ten feet of cliff retreat.
In Encinitas the cliffs are much steeper than elsewhere, and not many stairways, either public or private, have been built. One public stairway was constructed in 1977 at D Street at a cost of $100,000. This collapsed during the February 1978 storms (fig. 42), and it cost over $80,000 to remove the debris and replant the slope. This collapse, which resulted from surface runoff eroding an underground water main, should have been anticipated, since waterfalls had been observed at the site during winter storms in the 1940s. At the time of this writing, the county of San Diego has proposed to reconstruct the stairway at the same site.
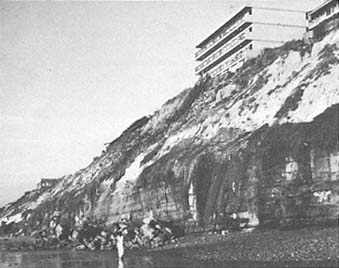
Figure 43
November 1977 photo of the apartment complex at F Street
in Encinitas. In the fall of a drought year 110 feet of cliff
collapsed as a result of subaerial erosion (groundwater
table rise) rather than marine erosion.
Photo: G. Kuhn.
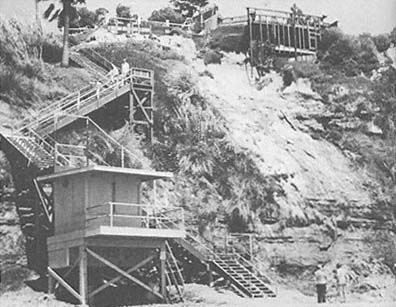
Figure 44
View of the public stairway at the Sea Cliff County Park in Encinitas, 1978.
A similar stairway collapsed and was crushed by a cliff failure at this
location in 1963. Note the recent cliff failure to the right of the stairs.
Photo: G. Kuhn.
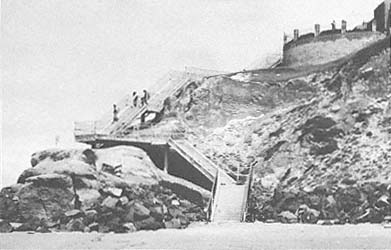
Figure 45
June 1977 view of the public concrete stairs at Solana Beach. The
stairway was located in the northern end of the embayment and was
thus semiprotected from direct wave action.
Photo: G. Kuhn.
Directly south a private stairway collapsed and was crushed by a 110-foot section of cliff in November 1977 (fig. 43). Stairways in Encinitas are subject not only to erosion by wave action and surface runoff but also to erosion by groundwater, as was the case when the stairway at Sea Cliff County Park collapsed in 1963. There was no public beach access at this location until the following year. The supports for the stairway now in use are being undermined and are separating again as the result of groundwater erosion (fig. 44).
At Cardiff State Park to the south, access stairways are partially protected at the base of the cliff by large blocks of stone, but the cliff itself is eroding around the stairway as water flows over the bluff and down the wooden stairway supports. Of the three public stairways in Solana Beach, two were thought to be particularly well designed in that the base of the stairs was located in protected cove areas away from direct wave action (fig. 45). During storms in late January 1983, however, the base of one stairway was completely destroyed by large waves (fig. 46).
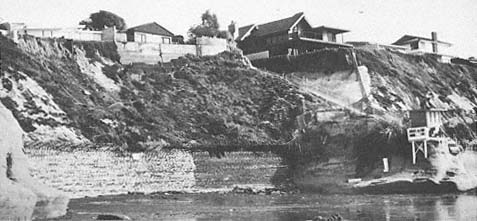
Figure 46
February 1983 view of San Diego County public beach access stairway at Tide Park in
Solana Beach. Note that the lower portion of the stairway was destroyed during
the storms of January 1983.
Photo: G. Kuhn.
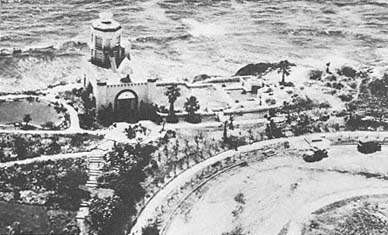
Figure 47a
Oblique aerial view of the Self-Realization Fellowship temple at Encinitas, 1938.
Photo: Self-Realization Fellowship.
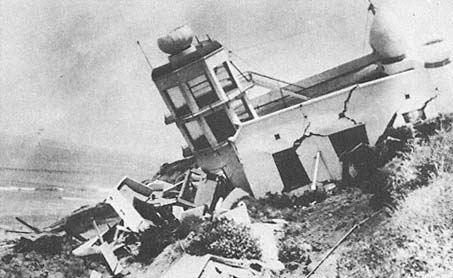
Figure 47b
View of the temple collapse in the early 1940s following significant sea storms
accompanied by intense sediment saturation of the bluff top.
Photo: Self-Realization Fellowship.
Erosion History at the Self-Realization Fellowship Property
In 1938 the Self-Realization Fellowship built a temple on the bluffs at Encinitas (fig. 47a ). Following storms in 1941 the temple, which had been constructed thirty feet back from the bluff edge, was a victim of frontal landslides and collapsed to the beach (fig. 47b ). This property is especially prone to erosion, and numerous landslides have occurred as a result of wave action as well as from a rise in the groundwater level. Piezometers, placed in wells on the site, clearly indicate a rise in the water table beginning in about 1973, commensurate with the inland urbanization (fig. 48). This rise began during the end of a drought period that lasted from 1946 to 1977.
Figure 48
Piezometric well readings from three locations on the Self-Realization
Fellowship property in Encinitas. The small arrows indicate landslide
or block-fall occurrence. There has been a slow but steady rise in the
water table that began in 1973. This corresponds to extensive
urbanization and a marked increase in water use inland from this site.
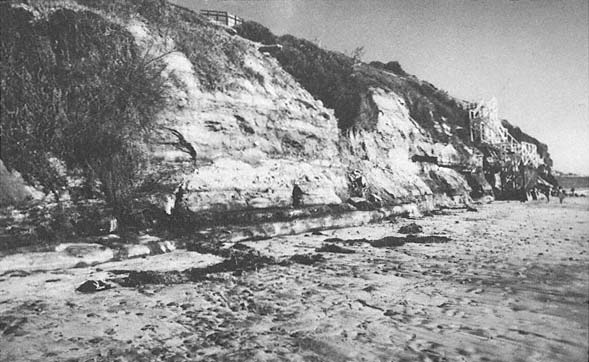
Figure 49a
February 1978 view of the cliff at the Self-Realization Fellowship. Note that the cliff face is not abnormally
undercut but that excessive wet conditions are visible.
Photo: G. Kuhn.
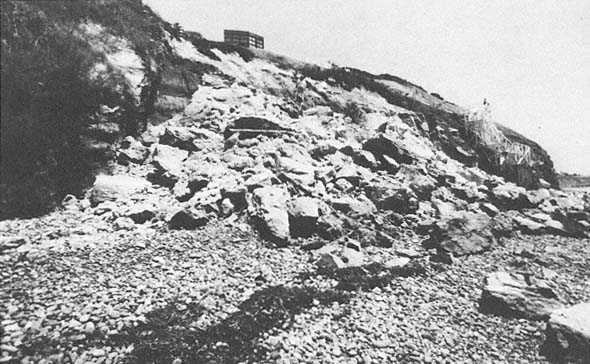
Figure 49b
May 1978 view of the same site as that in 49 a , following the cliff collapse of 26 April 1978.
Photo: G. Kuhn.
In April 1978, a cliff collapse measuring 110 feet along the bluff and 12 to 15 feet landward, with a maximum height of 40 feet, occurred at this same site (figs. 49a , 49b ). Saint and Turner (1980) investigated conditions at the site, including the 1978 event, and indicated that the cliffs in the area are subject to collapse because of a combination of factors. They state "large blocks, bounded by weakened joints, fractures, and bedding planes move out laterally following a build-up of pore pressure under the attack of wave action."
Figure 50
Subsurface groundwater movement along the old erosion surface. The arrows
indicate the approximate direction of the subsurface water.
From Saint and Turner, 1980.
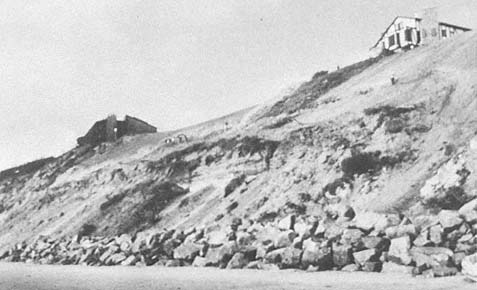
Figure 51a
View of the bluff face at the Self-Realization Fellowship, 1981. Note that the bluff face
was illegally graded and, as could have been predicted, it collapsed.
Photo: G. Kuhn.
After the storms in 1980, subterranean drains were installed around this property to intercept inland groundwater. Saint and Turner (1980) ascertained from a geological investigation that underground water was flowing directly under the Self-Realization property (fig. 50). An extensive stone seawall was installed along the cliff face in 1980. The bluff top was graded the following year, and, as could have been predicted, the cliff collapsed (fig. 51a ). Subsequently, it was covered with plastic sheeting to slow erosion of the bluff face (fig. 51b ). Since then the bluff face has been seeded and appears to be at least temporarily stabilized. Fortunately the winter of 1982 was very mild, with only a few storms and relatively little rainfall, so that not much erosion occurred. During the severe storms of January to March 1983, this was one of the few sites along the coast that was not damaged.
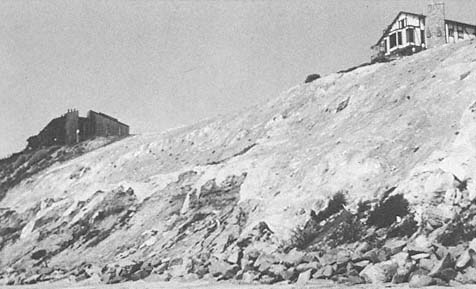
Figure 51b
May 1982 view at the same site as that in 51 a . Note that sheet plastic has been placed on
bluff face to slow erosion.
Photo : G. Kuhn.
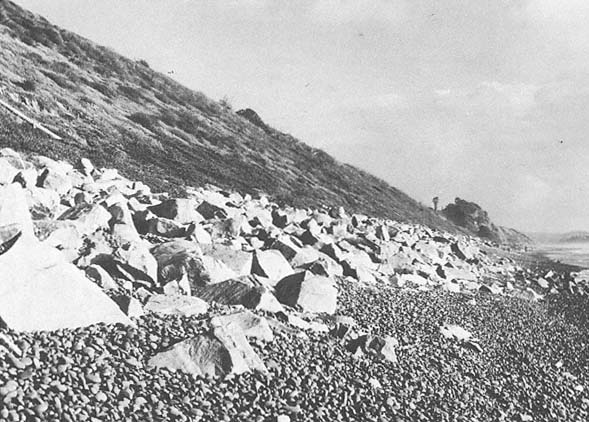
Figure 52
March 1983 view of the bluff face at Cardiff-by-the-Sea. The highway collapsed at this location in the late 1950s.
The slope was stabilized, subsurface drain pipes were installed to intercept groundwater, and the slope toe was
semiprotected by installation of riprap. Note that riprap was scattered by the high surf in various places during the
storms of January through March 1983.
Collapse of Highway 101 and Subsequent Stabilization
In April 1958, a landslide occurred along the cliffs between Sea Cliff County Park and Cardiff State Beach. A section of Highway 101 collapsed, and one lane was lost for a distance of about 300 feet. The cliffs in this area, prior to the failure, were nearly vertical and were eroding as the result of groundwater from inland sources. In 1960, subsurface drains were installed parallel to the existing railroad track, inland from the cliffs, and pipes were run down the cliffs to remove the groundwater. The base of the slide was removed, the slope face cut back and stabilized, and rocks were placed along the base to slow future erosion. Many of the large rocks were scattered during the winter storms of January through March 1983, effectively cutting off lifeguard service even at low tide (fig. 52).
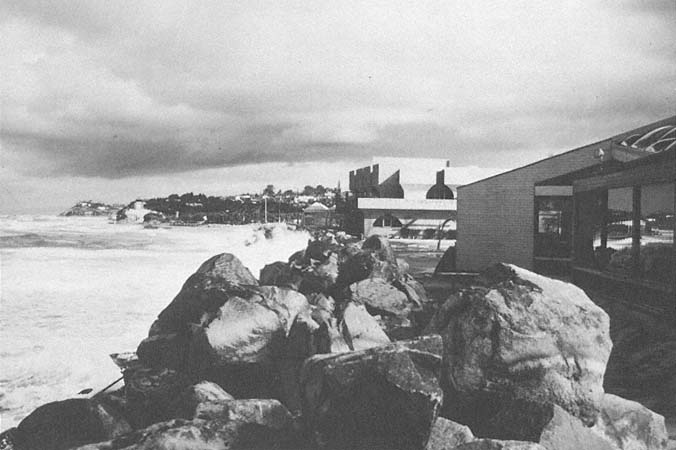
Figure 53
April 1983 view looking north along the beach at Cardiff. Note that the restaurants were severely damaged during the storms
of January through February 1983, when beach cobbles and riprap rubble became artillery and were thrown by large
waves into buildings and onto the coast highway.
Photo : G. Kuhn.
The Precarious Existence of Restaurant Row at Cardiff-by-the-Sea
During the past few years, numerous large restaurants have been constructed directly on the beach at Cardiff. This low-lying area has been inundated in the past when large storms breached or even temporarily removed the fragile sand barrier. During the last week in January and early February 1983, large storm swells, which coincided with the perigean spring tide, began to set the stage for extensive destruction along this area. Beach sand levels dropped markedly, and cobble rocks became projectiles, breaking out windows in the restaurants, undermining other places, and covering Highway 101 elsewhere to the south. The riprap rock that had been placed in front of one restaurant was ineffective in protecting the buildings and, in fact, many boulders weighing as much as 1,200 pounds were thrown through the air by the waves. This occurred where a large rampart of cobbles was formed in front of buildings; the large blocks of stone were first rolled seaward and then were catapulted through the structures. Some of these large rocks even came to rest in the middle of Highway 101 more than 80 feet inland. Since March 1983, larger riprap has been placed in front of the buildings and cemented (fig. 53). A great storm would probably break this barrier up leaving the restaurants in a definitely hazardous position.
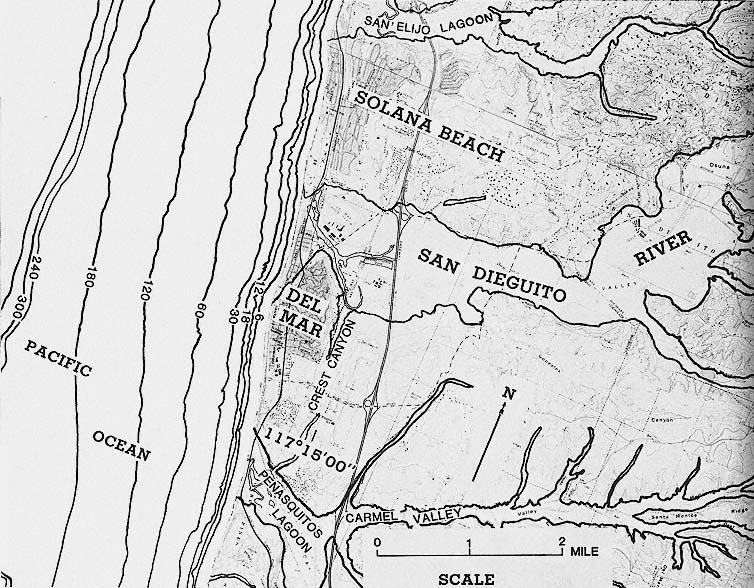
Figure 54
Location map of Del Mar and vicinity. Note: Bathymetry in feet
7—
Del Mar and Vicinity
Description of the Area
The city of Del Mar is situated partially on an inland coastal terrace and partially on a delta bordered by a low-lying beach to the north (fig. 54). It is adjacent to the flood plain of the San Dieguito River. The coastal terrace has a seaward margin with vertical to near-vertical cliffs consisting of weakly cemented, highly fractured ancient lagoonal barrier bar sediments of Eocene age. These sediments are capped by Pleistocene sand that is well cemented with iron oxide that tends to stand vertically even when undercut and appears to be more resistant to erosion than the underlying Eocene shale and sandstone. Inland and upland from the first coastal terrace, numerous canyons and gullies have been cut.
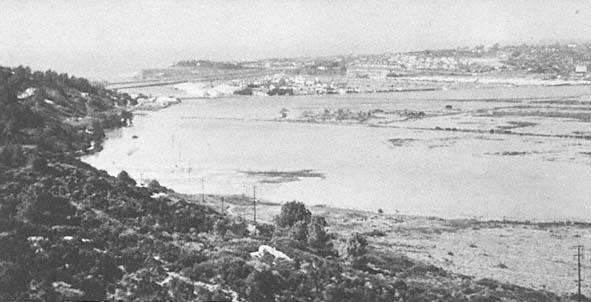
Figure 55
View of the low-lying Del Mar area which was flooded in February 1980. The view is looking across the San
Dieguito flood plain toward the Del Mar Racetrack which was partially underwater at the time.
Photo : G. Kuhn.
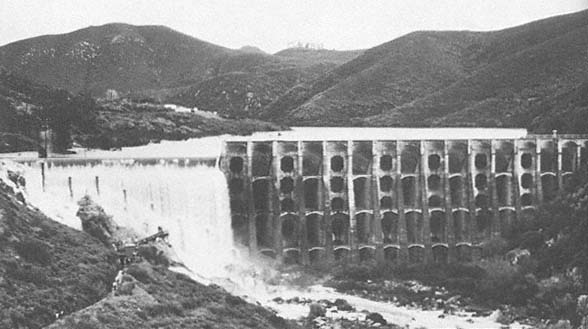
Figure 56
View of Hodges Dam on the San Dieguito River, inland of Del Mar, 1980. Note that this dam was designed for
agricultural purposes, not flood control, and has no flood control gate. The only means of releasing
water is a spillway. This dam could be breached by a major flood.
Photo : G. Kuhn.
San Dieguito River Flood Plain
The San Dieguito River is one of the largest rivers in San Diego County. Major floods occurred in past years, the most recent in March 1938. At present two water-storage dams, Lake Hodges and Lake Sutherland, are located on the river. Little usable beach sand or other sedimentary material reaches the coast today; instead it is deposited behind the dams. The State of California Department of Water Resources (1967) estimates that the sediment thickness of the flood plain varies from 100 to 150 feet.
When the water receded after the flood of 1938, a number of backers including Bing Crosby financed the building of the Del Mar Racetrack on the lower reaches of the flood plain. Exceptionally heavy rainfall occurred in February 1980, and once again the lower areas were flooded (fig. 55). Neither dam is equipped with flood control valves, and thus, when their reservoirs fill up, there is no way to let the water out gradually. It can escape only when the dams fill to overflowing (fig. 56), which may cause excessive scouring along the lateral margin, as during the flood of 1916 at Sweetwater Dam (fig. 9) (McGlashan and Ebert 1918). In recent years, business interests have exerted more and more pressure on the community to develop a large section of the flood plain. Should there be a recurrence of a major flood such as the one in 1938, and should the dams be full, it could be disastrous not only for the agricultural interests and the golf course, now located on the flood plain, but also for the racetrack and the major highways that cross the plain.
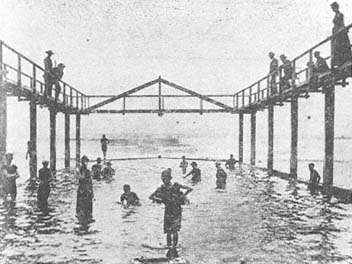
Figure 57
View of the glass-enclosed Natatorium on the beach at the foot of
Tenth Street in Del Mar, 1890s. This structure was designed to
protect the bathers from "the dreaded sting-a-ray."
Photo : Fletcher Collection, University of California, San Diego.
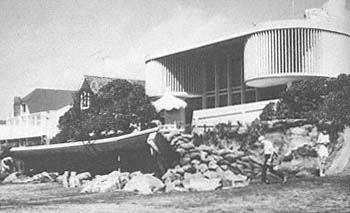
Figure 58
March 1978 view of the eroded beach at Del Mar. Note that the
wooden seawall collapsed and that adjacent lots were eroded.
Photo : G. Kuhn.
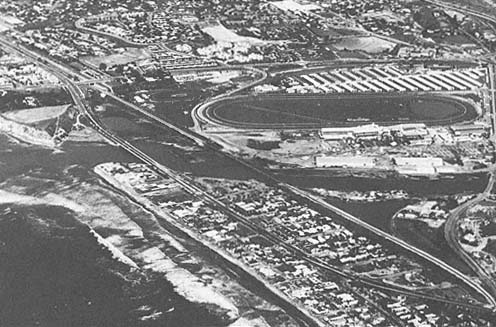
Figure 59
February 1980 oblique aerial view of the low-lying parts of Del Mar and the beach, which were
eroded both by waves and the flooded river.
Photo : G. Kuhn.
The Beach and Its Sand Replenishment
As mentioned previously, most beach sand in the area is deposited during river floods. Early settlers did not build homes on the beach, although they did construct some recreational facilities, such as the glass-enclosed wading pool at the foot of Tenth Street (fig. 57), along with other bathing facilities. By contrast, during the past quarter-century there has been extensive building on the sand beach. Many people, including some scientists, have overlooked the somewhat obscure evidence of past storms when the beach was deeply scoured.
Storms in 1978 and 1980 severely eroded the beach and undercut wooden seawalls, lifeguard towers, and even fences, patios, and homes (fig. 58). In February 1980, river flooding, combined with large storm swells, made the beach almost uninhabitable (fig. 59). Homeowners in the area periodically have sand transported in to rebuild the beach at their own expense. At one location an unusual method of beach stabilization was employed. A sand-filled tube approximately six feet in diameter was placed on the beach. Between 1980 and 1982 the sand levels had been high and the tube was usually covered. During storms in late January 1983, however, the tube was undermined and then collapsed, and was later struck by a bulldozer that was placing riprap rock revetment along the beach. The sand at this location had built up during February and March of 1982 as the result of the predominant south-to-north sand transport mentioned previously. However, sand levels again dropped in the winter of 1983, causing immediate panic along the shore as property was once again threatened. After seeing the damage done in 1978, 1980, and again in 1983, one questions what would happen to the homes along the shore during a really major storm, with waves larger than the maximum ten-foot heights recorded at fairly recent dates.
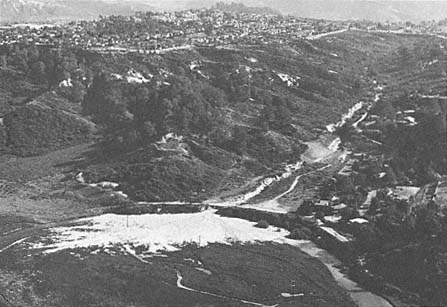
Figure 60
Oblique aerial view of Crest Canyon adjacent to the San Dieguito River, 1978. Storm
drains located up-canyon concentrated surface runoff and exhumed an old, filled
canyon which caused a massive alluvial fan to form in a portion of the filled
San Dieguito Lagoon.
Photo: G. Kuhn.
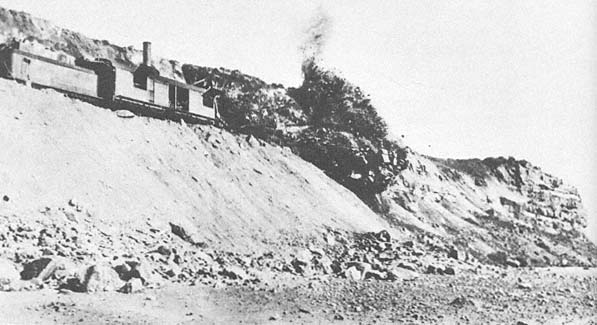
Figure 61
February 1910 view looking north along the bluff top at Del Mar, showing construction of the railroad bed.
Photo : Santa Fe Railway Company.
Coastal Canyon Erosion and Lagoon Siltation
The canyons surrounding the uplands of Del Mar have, for the most part, been formed by erosion during storms. Presently they appear to be inactive, as they are filled with alluvium. Erosion and down-canyon cutting of alluvial sediments occurred at Crest Canyon behind Del Mar in February 1978 (fig. 60). Storm drains that had been located on the upper slope of the canyon concentrated the water flow down-canyon from a housing subdivision, causing extensive erosion which exhumed an old canyon. As a result a massive alluvial fan, approximately 50,000 cubic yards, was deposited in the San Dieguito Lagoon, which is now a wildlife preserve (PRC Toups Corp. 1979). The lower part of the eroded canyon was artificially filled during 1979, but it eroded again in 1980. The same action was repeated in 1983. This is but one canyon on the coast where renewed erosion is a direct result of subdivision storm drains placed up-canyon.
Threat to the Railroad Along the Cliff and General Changes
Prior to 1900, the Santa Fe Railroad line was placed a block inland from the bluff. In 1910, the railroad relocated the route seaward because the grade inland was too steep and because the rail company wanted to accommodate the growing city of Del Mar (Atcheson, Topeka, and Santa Fe Railway Co. 1978). To create a more level right-of-way, the bluffs were steam-shoveled and dynamited (fig. 61). Since then three trains have crashed to the beach, as the cliffs have been undercut by waves and by runoff from streets ending at the bluff, as well as by increasing subsurface groundwater pressures. The most recent train derailment occurred on 1 January 1941 when the bluff collapsed. This specific location in Del Mar is particularly susceptible to erosion, as surface water,
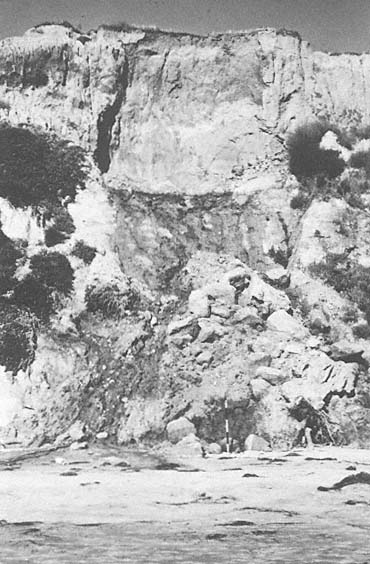
Figure 62a
August 1979 view of the cliff collapse at Del Mar. Note that this
failure was a direct result of subaerial erosion (groundwater sources
inland of the sea cliff) and not wave erosion.
Photo : G. Kuhn.
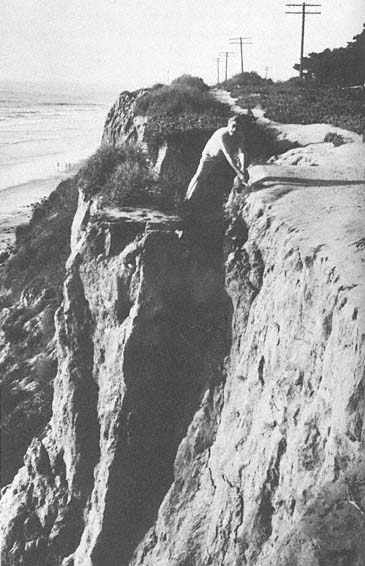
Figure 62b
September 1979 view along the bluff top at Del Mar. Note that the
block in the foreground has partially separated from the cliff face.
Photo : G. Kuhn.
especially during the wet years, flows directly down the street end, ponds east of the tracks, and then exits the cliff face atop impermeable clay layers. In 1978, during the January storms, this site collapsed, and the bluff face had to be stabilized again landward; subsequently the tracks were relocated still farther inland.
Recent Summer Cliff Failures
The vertical cliffs in the Del Mar area began collapsing in 1979, even during the summer, on account of increased groundwater flow (fig. 62a ). Tensional fractures occur along the top, parallel to the cliff face, and future failures appear imminent (fig. 62b ). Since 1980, very little sand is found on the beaches along this section of the coast, even during summer months, so that large waves at any period actively erode the cliff base.
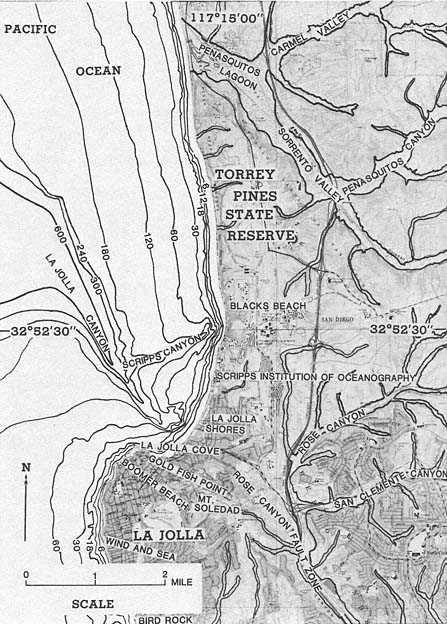
Figure 63
Location map of the Sorrento Valley south through Torrey Pines State Park,
Scripps Institution of Oceanography, La Jolla Shores and north La Jolla.
8—
The High Cliffed Area between Sorrento Valley and North La Jolla
Description of the Area
The spectacular cliffs along this section of the coast reach a maximum height of over 350 feet and extend from Sorrento Valley (Penasquitos Lagoon) to La Jolla Shores. These cliffs consist of ancient lagoonal marine and terrestrial sediments of Eocene age, with a capping of iron oxide—cemented terrace deposits of Pleistocene age (fig. 63). At the south end, a volcanic dike of Miocene age cuts the sediments, and south of the dike there is an infilled embayment of late Pleistocene sediment, including iron oxide—cemented alluvial sands and gravels.
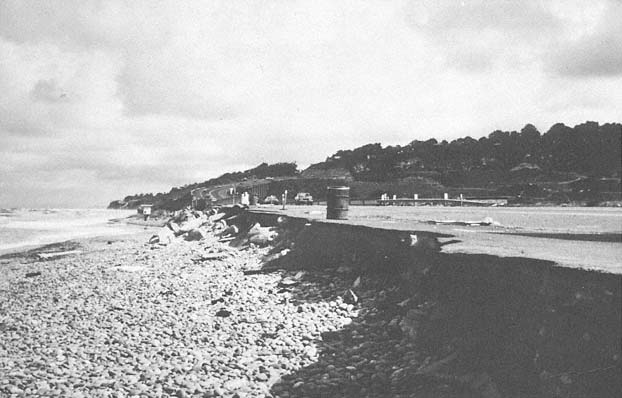
Figure 64
April 1983 view looking north along the undermined, collapsed portion of Highway 101, at the mouth of the Sorrento
Valley.
Photo : G. Kuhn.
History of the Lower Reaches of Sorrento Valley
Among the earliest inhabitants of the area were the San Diegueño Indians. Numerous shell midden deposits have been found along the high slope surrounding the valley. Shells have been dated by amino acid method to about 4,500 to 10,000 years old (Masters and Bada 1978).
The northwesterly trend of the valley is thought to be structurally controlled as it parallels the La Nacion Fault to the south, and as it is oriented in an anomalous direction toward the lagoons to the north. In 1874, Judge Benjamin Hayes described the extensive cobble barrier that completely sealed off the mouth of the lagoon and noted that its height exceeded forty feet above sea level. In 1889, the California Southern Railroad installed a beach shingle railroad siding in order to mine cobbles for use as abrasives and as paving material for the streets in the city of San Diego. The highway at this location was severely damaged between January and April of 1983 as storm waves launched beach cobbles and riprap against and onto the road (fig. 64).
In 1883 the railroad company located its right-of-way through the valley. During the great storms and flood of 1884, the railroad had to be dug out after massive landslides sealed off the lower valley and buried the track (San Diego Union , 2 March 1884). Since then, Sorrento Valley has been flooded on several occasions, the last time in 1938. At that time, only ranches and farms existed there, and the structures were high up the slopes, safe from the floodwaters. In the late 1960s, however, extensive development took place in the eastern section of the valley, and it is now a huge industrial park. Future floods could be rather serious, since there is no adequate flood control channel to handle a large volume of water.
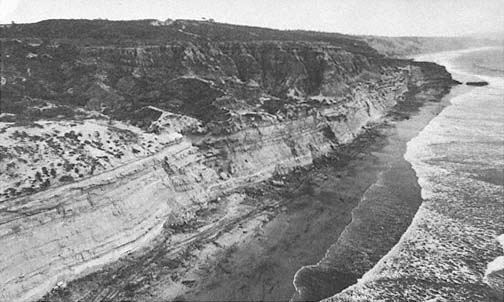
Figure 65
Oblique aerial view of the cliffs looking south at Torrey Pines State Park, south of Del Mar.
Bathtub Rock is visible at the far right.
Photo : California Coastal Commission.
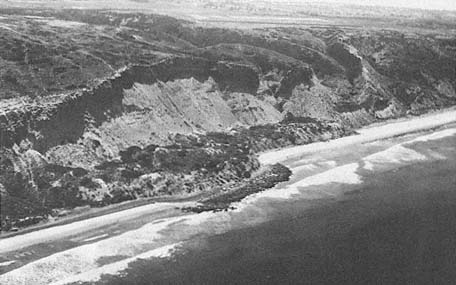
Figure 66
View of Torrey Pines landslide which measures approximately 1,700 feet along the
cliff, 1949.
Photo : F. Shepard.
Torrey Pines State Preserve and Its Cliffs
Thanks to the generosity of Miss Ellen Scripps, Torrey Pines was purchased as a state preserve in the 1920s. These magnificent cliffs and canyons thus have been preserved in their natural state and may be enjoyed by the general public. Cliff retreat along this area occurs in small rockfalls, as far north as Bathtub Rock (fig. 65). Bathtub Rock itself was hollowed out by a Welsh coal miner who thought it looked promising for a coal seam, but nothing of the sort was found. Just north of Bathtub Rock, a path leads up to the Torrey Pines State Park Center. To the left of the trail, as it leaves the cliffs, is a small sand deposit with many beach-type shells at an elevation of sixty-five to seventy feet above the present sea level. These sediments show the typical beach laminae. The shells have been dated at approximately 120,000 years B.P ., both by uranium thorium and amino acid dating methods (Masters and Bada 1978). This is an uplifted remnant of the beach from a period of relatively high sea level during the latest interglacial stage.
Torrey Pines Landslides
South of Torrey Pines the cliffs are disturbed by extensive landslides. The largest of these measures approximately 1,700 feet along the cliff and several hundred feet landward and is called the Torrey Pines Park landslide (fig. 66). When the U. S. Coast Survey mapped the area in 1889, this landslide and others to the south appeared to be quite recent, as talus and debris extended far out on the beach. The Torrey Pines Golf Course is located along the top of the bluff just south of this point, and in 1982 new fractures were noted directly inland from the old landslide.
Blacks Beach Landslides
Blacks Beach (now Torrey Pines City Beach) has vertical and near-vertical cliffs over 350 feet high. During the summer, as many as 50,000 people may be on the beach at one time. For many years Blacks Beach was the only legal nude beach in southern California, and even today the practice is not entirely eliminated. It is fortunate, considering the large numbers of sunbathers, that few landslides have occurred in recent years. In the past, Blacks Beach has apparently experienced very large landslides, as noted by Sumner and Ross (1930). They described a failure between 1917 and 1922 with dimensions of 450 feet along the shore, 175 feet to the base of the cliff (75 or 100 feet wide higher up), and approximately 200 feet of the vertical cliff face. Prior to 1940, a large talus buildup allowed access to a hanging valley. During the storms at the end of 1940, this talus was completely removed (Kuhn and Shepard 1979a ) and was not reconstituted until about 1970.
In February 1982, a massive landslide occurred at this same location, measuring approximately 750 feet along the cliff by 280 feet into the cliff (fig. 67). This slide carried material, including large boulders, across the beach to the water, cutting off one side of the beach from the other except at low tide. The fallen material comprised acres of sandstone and provided a large future source of sand for the beach. Prior to this movement, groundwater was seen on the cliff face, and tensional fractures were noted along the top by San Diego city lifeguards. A local engineering geology firm, Leighton and Associates (1981), had completed a reconnaissance study of the area in May 1981 and had mapped an existing old landslide at the site. At the time of their report, fractures existed farther back from the landslide head scarp, indicating sections of future failures.
The 1982 landslide occurred during a very benign winter with little rainfall and few storms. Interestingly, on the evening prior to the cliff collapse, the seismograph at Scripps Institution of Oceanography registered a surface wave, with no earthquake being reported. It therefore appears that collapse of this
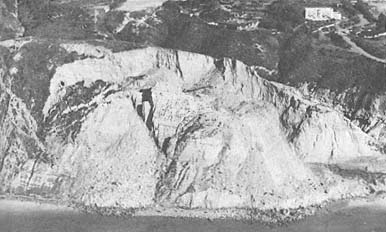
Figure 67
Landslide at Blacks Beach north of Scripps Institution of Oceanography
(SIO) which occurred January 29, 1982. Note the recent slide material on
the beach and the fresh vertical scarp behind the slide.
Photo : Ron McConnaughey.
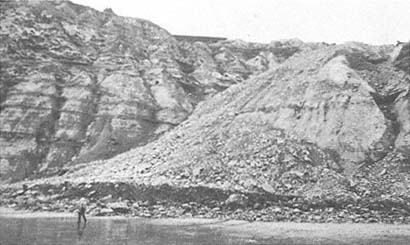
Figure 68
February 1978 view of the fall of 1977 landslide debris along the cliffs in front
of the former Drell residence.
Photo : G. Kuhn.
slide was forthcoming, as the earth shock indicated that a major section had broken loose. In 1977, before the heavy rains of 1978, a landslide occurred directly in front of the former Drell residence in the La Jolla Farms area (fig. 68) (SCT Consultants 1979). This slide included approximately forty-five feet of the yard on the seaward side of the house, and debris from the slide reached far across the beach below.
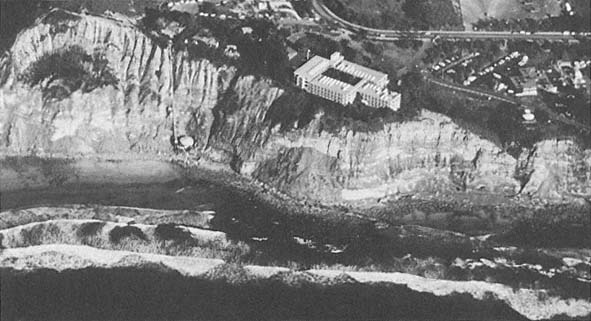
Figure 69a
March 1978 oblique aerial view of the National Marine Fisheries Building. Note the funicular tram built at a
precarious position north of the building, and the rockfall directly in front of it. An old landslide was
discovered to be under the building after it was constructed.
Photo : G. Kuhn.
Spectacular Location of the U. S. Fisheries and Wildlife Buildings, and the Cliff Margin of Scripps IGPP Building
When Andy Anderson purchased the property along the sea cliffs just north of the Scripps Institution grounds, he developed the property to have spectacular views from his home of the cliffs to the north and beautiful Point La Jolla to the south. He never gave a thought to the possibility that a large building might be constructed next to his property and thus completely block his view to the south, but that is exactly what happened. The National Marine Fisheries Building was constructed in the 1960s just above the cliffs, north of Scripps Institution (fig. 69a ). The structures were exempted from local building code requirements for a preconstruction engineering geology study because it was a U. S. Government complex (Moore 1973). In 1963, geologists from Scripps Institution noted
Figure 69b
Sketch of the same site as that in
69a , showing the mapped and
the inferred structural relations
at the National Marine Fisheries
Building landslide, 1973. From
Moore 1973.
the possibility that the buildings were on a landslide (Frautschy 1963). A thorough study, conducted after the architects received a letter from the concerned geologists, ascertained that the Fisheries buildings did indeed stand on a block-glide landslide (Moore 1963). Periodic micrometer measurements were made between each of the four buildings of the complex, from September 1967 to April 1973. It was noted that during that period Building B moved down, relative to Building D, at a rate of 2.2 millimeters per year (Moore 1973) (fig. 69b ). However, it was noted by Moore (1968) that much of the measured movement was related to rather distant earthquakes. Previous investigators of the area (Hanna 1926:233; Vaughan 1932) noted the gross instability of these cliffs during wet years and the concomitant hazard of situating not only buildings but even access roads along the fragile margins.
There did not appear to be a good site for another building to the south of the Fisheries Building, since there was a ridge along the seaward side and a longitudinal valley on the landward side. However, on the suggestion of Dr. Walter Munk, who wanted a building in this location, and with the help of his architect wife, the University filled in the valley and constructed the building for the Institute of Geophysics and Planetary Physics (IGPP). In recent years, the west end of the building has developed a lean toward the ocean.
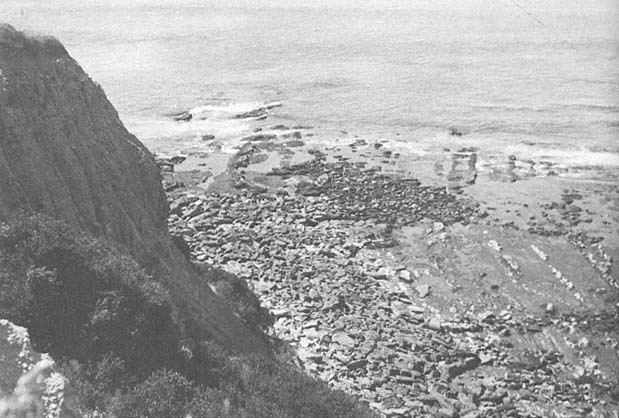
Figure 70
View of the low cliffs bordered by the wave-cut terrace at La Jolla, 1948.
Photo : F. Shepard.
9—
La Jolla and Its Projecting Point
Description of the Area
The La Jolla coast, with its northern boundary at the original Scripps Institution campus (now expanded considerably to the north), extends along the alluvial cliffs, now almost entirely guarded by seawalls, to the old barrier beach which historically enclosed a lagoon at the mouth of Hidden Valley (fig. 63). The lagoon now consists of only an artificial pond at the La Jolla Beach and Tennis Club, but it is low enough that it occasionally floods during heavy rains, temporarily submerging what is now a completely built-over area on the marshy soil.
To the south, rocky cliffs with terraces rise above this low area and are bordered by a wave-cut terrace which is exposed at low tide (fig. 70). There is a right-angle bend in the coast where these terraces terminate. Point La Jolla extends seaward with an escarpment face that is based with deep reentry caves extending far back under the forty-foot high terrace which terminates at La Jolla
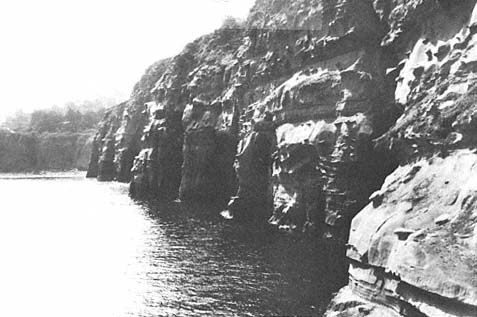
Figure 71a
View looking east at Goldfish Point, LaJolla, 1916. Note the unique development of the
caves for this part of the coast. They have presumably formed through a combination
of marine and solution erosion along pre-existing fractures.
Photo : SIO Archives.
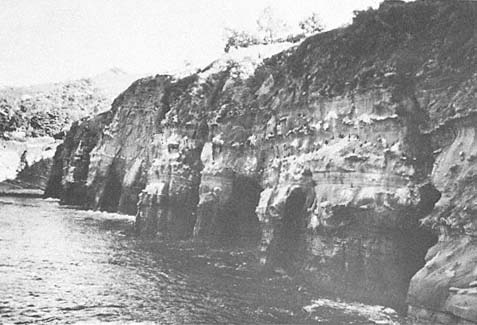
Figure 71b
View of the same site as that in 71 a , 1978. Note that very little change is evident.
Photo : F. Shepard.
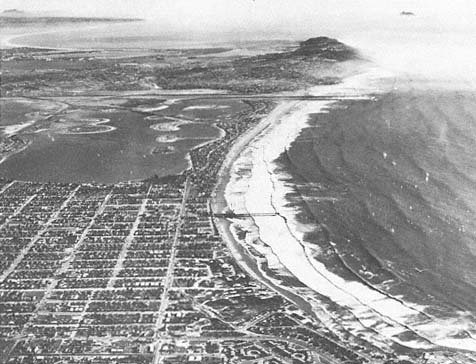
Figure 72
Early 1950s view looking south across Pacific Beach, Mission Beach, Point Loma, and
into Mexico. Note the Mexican Coronados Islands offshore in the upper right of
the photo.
Photo : F. Shepard.
Cove (figs. 71a , 71b ), one of the few protected swimming areas along the coast. Farther south, the point recedes but continues to be rocky with relatively low terraces and is indented by a few coves with steep, sandy beaches which derive their coarse sand from the local cliffs (fig. 72).
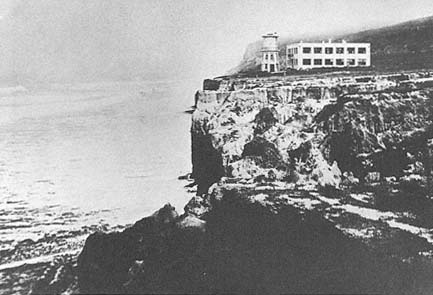
Figure 73
View of the original Scripps Building and water tower, SIO, 1910. Note the
absence of a talus at the base of the cliffs, indicating active wave erosion.
Photo : SIO Archives.
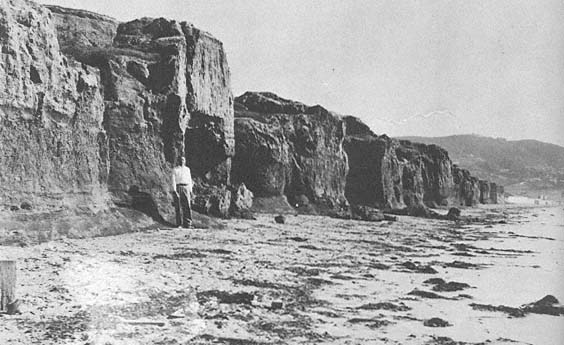
Figure 74a
View of low-lying alluvial cliffs south of Scripps, 1936. Cliffs were retreating at that time at a rate of about
one foot per year.
Photo : U. S. Grant IV.
Alluvial Cliffs Near Scripps Institution
We have considerable knowledge of the history of the alluvial cliffs at the northern end of the La Jolla section of coast. The first buildings of the Scripps Institution were located just a few feet inside this terrace (fig. 73). Apparently the builders did not realize that this area was subject to rapid retreat, on the order of a foot or more per year, as was established by repeated measurements (Vaughan 1932). This was actually known earlier than Vaughan's work because seawalls had already been constructed in front of the Scripps buildings (Hanna 1926:233); nonetheless, retreat continued north and south of the wall until about 1946.
The erosion was found to be related to the fact that the sand beach was several hundred feet wide at low tide in the summer and was subject to depletion during winter storms (Shepard and Grant 1947). Generally the erosion began as a series of sand cusps, after which the waves completely removed the sand from the beach to expose underlying gravel and sometimes the underlying semiconsolidated alluvial formation (fig. 74a ). During late winter storms, this allowed the waves, with the help of cobbles, to undercut the alluvial cliffs and thereby produce the annual retreat. Beginning in 1946, however, the storms became less violent, and the beaches were not appreciably cut away in the winters, so the smaller waves that reached the cliffs were not capable of undermining them. Instead, over the next thirty years, most of the bluffs gradually became less steep, and vegetation became well established on the slopes. Only an occasional storm did any cutting, and then it was at the cliff base.
As a result, the builders, who rarely show interest in anything that may have happened more than a few years in the past, began building homes all along these apparently stable bluffs and filled canyons, some even extending support columns out over the inner beach. This practice was curtailed by the California Coastal Commission, however, in the 1970s.
In January 1978 the first severe storms in thirty years occurred and panic followed (Kuhn and Shepard 1979b ). Desperate measures of all sorts were tried in an effort to stop the erosion of the alluvial bluffs, which had been postponed for so long. In one threatened area, the homeowners obtained old cars and drove them onto the beach, hoping they would buffer the cliffs from the waves (fig. 74b ). The cars were soon smashed to pieces, posing little resistance to the high surf and leaving a pile of glass and steel frames on the beach. The steel frames were removed by the homeowners, and concrete was poured over riprap in another attempt to stop the waves (fig. 74c ), but the waves broke over the existing concrete wall, causing it to collapse (fig. 74d ) and greatly accelerating erosion of the adjacent property (fig. 74e ).
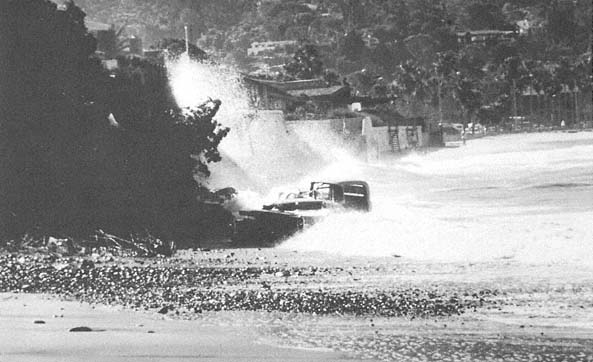
Figure 74b
January 1978 view at the same location as that in 74 a . A long, benign period with little erosion had just ended
with the severe storms of 1978. Note the remnants of old automobiles which were driven onto the beach
in an attempt to stop renewed erosion.
Photo : G. Kuhn.
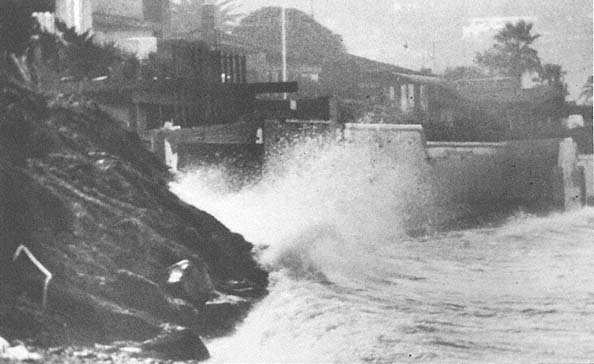
Figure 74c
February 1978 view at the same location. Automobiles have been removed from the beach, riprap was placed along
the slope toe, and the slope face was covered with gunnite.
Photo : G. Kuhn.
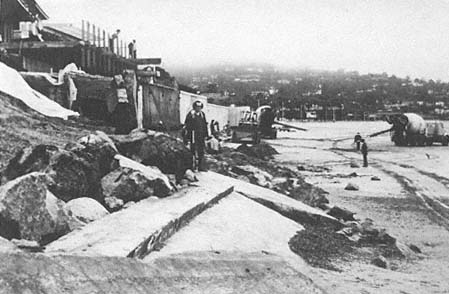
Figure 74d
February 1978, same location. Note the partial seawall collapse.
Photo : G. Kuhn.
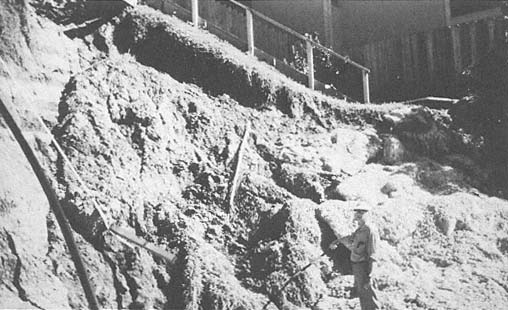
Figure 74e
March 1978 view at the same location. 1978 storms produced local retreat of fifteen to eighteen
feet in this general area.
Photo : G. Kuhn.
Elsewhere seawalls were begun. This method, however, was only partially successful, as some collapsed while being built. As this book is being written, most of the homes are protected by a substantial, continuous seawall (fig. 74f ), and only one small section at Scripps Institution remains unprotected. This last site is now being threatened, as evidenced by a number of cracks that became visible in the winter of 1982 in the pavement of the parking lot there. These cracks have since been filled. During the large storms of January to March 1983, however, the alluvial cliffs retreated about three feet as a result of cobble abrasion, and the Scripps wooden stairs collapsed, necessitating their closure for public safety.
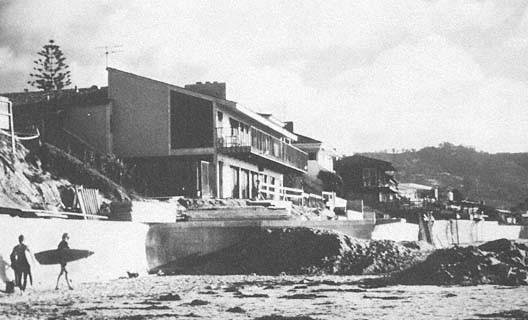
Figure 74f
October 1979 view at the same location. Victory achieved at a considerable expense: an almost
continuous seawall constructed along the cliffs.
Photo : G. Kuhn.
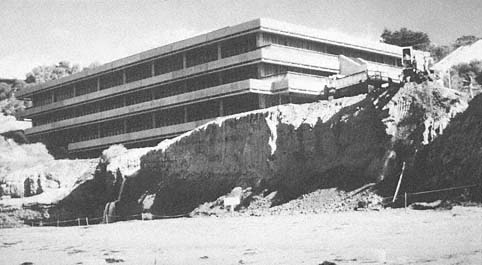
Figure 75
View of the recently constructed Marine Biology Building at SIO, 1979. Note that the cliff
had retreated approximately fifty-six feet since 1912.
Photo : G. Kuhn.
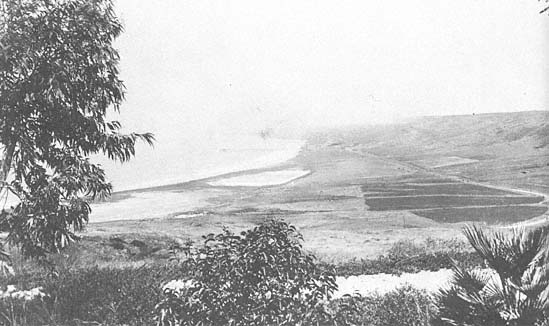
Figure 76
The unmodified lagoon shoreward of the La Jolla Submarine Canyon as it appeared in 1930.
Photo : F. Shepard Collection.
One of the last sections to be protected by a seawall was the Marine Biology Building at Scripps (fig. 75). This was a sore point with university architects who located the building on a low terrace of alluvium, about fifteen feet from its cliffed margin. They apparently failed to utilize studies showing that this margin had retreated some fifty-six feet over a sixty-three-year period from 1912 to 1975 (Hannan 1975). They even graded the outer terrace, which added to the erosion potential, and allowed pipes that drained water from the laboratories of the building to run out under the building margin, which only further eroded underlying semiconsolidated rock formations. The results should have been anticipated. The terrace margin was cut away during the first year the building was occupied, and serious sagging of the floor occurred. A seawall was then built, and other measures were taken to prevent further damage to the new building. Just north of the building, over fifty Indian burial sites have been uncovered in the cliffs. Carbon-14 dating shows them to be from 5,460 to 7,370 years old (Shumway et al. 1961). A fossil horse bone found directly south of the building yielded an age of 55,000 years as determined by amino acid (Bada et al. 1974).
A curiosity observed in the beach north of Scripps Institution pier is the long, concretionary rock extending out from the shore. It forms a sort of dike that is well exposed each winter, when the sand is cut away from either side. Photographs dating back to 1943 show that erosion has gradually removed the outer portion of the concretion and, as blocks became detached, they were ground into sand (Emery and Kuhn 1980). South of the alluvial cliff zone is a barrier beach. It continues for more than half a mile, where it terminates south of the beach club in the sandstone cliffs. There is evidence that a considerable lagoon once existed inside this barrier, as indicated from soil foundation cores and from the fact that the lower part of the old lagoon became submerged in heavy rains (fig. 76). Extensive artificial infilling occurred during the recent dry decades, and a portion of what is now known as La Jolla Shores was created. This lagoon was partly filled by the runoff from Hidden Valley. There are
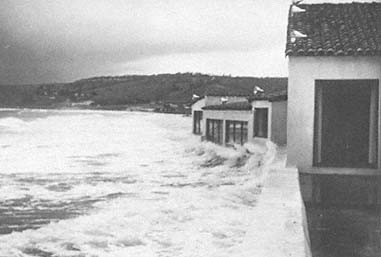
Figure 77
January 1949 photo of waves breaking against the Marine Room, La Jolla
Shores. Much more extensive damage occurred during the
stormy winter of 1982–83.
Photo : F. Shepard.
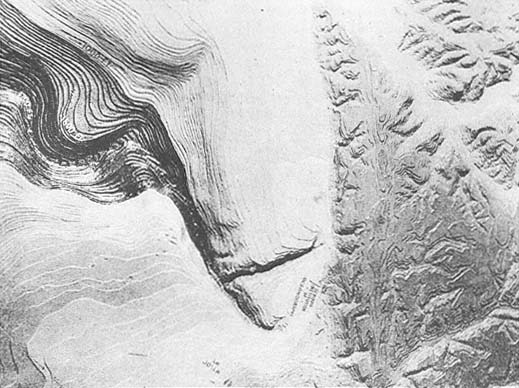
Figure 78
Locations of the La Jolla and the Scripps Submarine Canyons offshore at La Jolla, and their
relation to the land canyons. From Shepard and Emery 1941.
indications that at one time a barrier also existed at a somewhat higher level, to the north, as can be observed by the small terrace level when following the road south from Scripps Institution. The Marine Room Restaurant at the La Jolla Beach and Tennis Club was damaged by several storms in the 1940s (fig. 77) and sustained extensive damage again in 1983.
Submarine Canyons off La Jolla
The La Jolla coast is somewhat unique in having two submarine canyons that extend virtually in to the beach (fig. 78). One of these canyons is located off the cliffs north of Scripps Institution, and the other is off the south end of the long beach at La Jolla Shores. Both canyons are rather clearly related to the land valleys at their heads. The northern one, Scripps Canyon, extends southward in an almost straight line and has vertical, and even overhanging, walls all along its length for about a mile out, where it joins the less precipitous La Jolla Canyon. One unique feature of Scripps Canyon is its constantly changing depths. It fills gradually for a number of feet, and then a slide, sometimes combined with a turbidity current, carries the sediment seaward, often with enough force to remove large boulders along its course. It has several side canyons at its head and, from time to time, new or old buried tributaries are apparently uncovered, which may subsequently be refilled.
La Jolla Canyon has steep sides and a vertical headwall but is generally less precipitous than Scripps Canyon. It extends for thirty-three miles seaward in a general southwest direction and enters San Diego Trough twenty-seven miles off the coast at a depth of 3,600 feet. Dives into the head of the canyon show it to be unstable, and the character of the bottom changes at frequent intervals of time. The surrounding terrace has yielded many artifacts, some dated at approximately 4,200 years old. There is substantial evidence that the head has been retreating shoreward at an average rate of about one inch per year for the past few thousand years (Shepard and Dill 1966:57–58). Shepard and Dill (1966) also showed that the retreat from 1950 to 1964 was over two feet
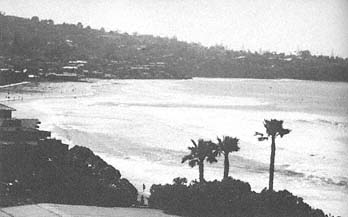
Figure 79
View looking south toward La Jolla Shores, 1978. Note that the
rip currents can be seen in the center of the photo. They form
between the lowest and the highest waves near the La Jolla
Submarine Canyon.
Photo : G. Kuhn.
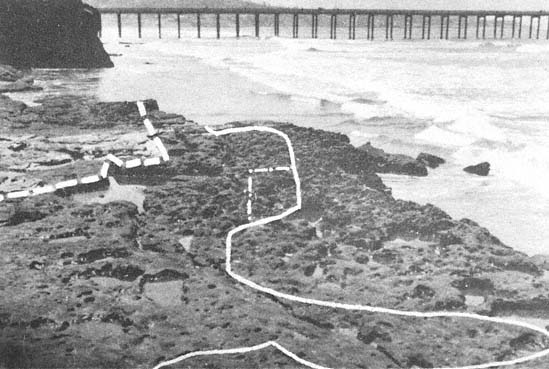
Figure 80
Sea cliff retreat by removal of the joint blocks of the sandstone bed in the lower-middle Eocene Ardath
shale that caps a bench projecting from the sea cliff 300 feet north of SIO pier; the top is about seven feet
above high-tide level. The sequence of retreat at the edge of the sandstone capped bench: July 1940, May
1944, June 1953, and July 1979. Maximum retreat was twenty-three feet in forty years, but none of the
blocks remain at the foot of the bench front. From Emery and Kuhn 1980.
per year. An interesting feature of La Jolla Canyon is the effect it has on the waves on the long beach at La Jolla Shores. The waves are almost always much smaller at the head of the canyon, owing to wave divergence as the crests move shoreward up the canyon. Conversely, they are much larger at the north end of the beach where the waves converge, so there may be two-foot breakers at the canyon head and ten-foot breakers in the northern convergence, half a mile up the beach. Thus, swimming is easier at the canyon head, and huge numbers of bathers swim there every day in the summer, whereas surfers are relegated to the northern convergence, where they abound. The effects also relate to the rip currents which are an ever-present danger. These rips are in the area between the lowest and highest waves, and the lifeguards are on constant alert for unwary bathers in this zone (fig. 79).
Rose Canyon Fault Zone and Change in Coastal Configuration
South of La Jolla Shores one encounters the seaward continuation of Mount Soledad. The relatively low cliffs, just south of the beach club, are of cretaceous sandstone and are bordered seaward by a wide wave-cut terrace that shows at low tide a series of small hog-backs made by erosion of the tilted strata. This is an amazingly wave-cut terrace rock and is unique, so far as we know, along the San Diego County coast; although rock terraces do exist in other places, they are not quite so exposed at low tide.
The history of the area poses an interesting question. So far as we know from available literature, it should take a long time, on the order of several thousand years, to form such a terrace with its low, hog-back ridges. This suggests a relatively long period of stability for the site. However, the terrace may be cut away rather rapidly, as shown by the measurements made in Eocene sand and shale just north of the Marine Biology Building at Scripps Institution (fig. 80) (Emery and Kuhn 1980). Yet we seem to be considering an area of little
stability; certainly the uplifted terraces extending 800 feet to the top of Mount Soledad do not suggest long-term stability.
Just south of the tidal terrace, there is a fault coast continuation of the north scarp of Mount Soledad. In fact, this terrace clearly dips down at its southern end before encountering the east-west sandstone cliffs of Cretaceous age at its southward termination. One would expect the Cretaceous terrace rock, which is older than the Tertiary, to be bent to the south by the faulting at the base of Mount Soledad, but this is not the case. The cliffed north side of Point La Jolla, with its sandstones and deeply penetrating caves, was probably the place for which the town was named: la jolla comes from the Indian phrase meaning "hole in the ground." (The old interpretation of the name to mean "the jewel" was possibly an invention of the original chamber of commerce.) It is curious that such caves exist in a sandstone formation. It does not seem reasonable that they are the result of wave erosion alone. If they were, there should be a wave-cut terrace at their base, but the only terraces are somewhat below the base. It does not seem likely that waves could have extended deep into this sandstone with any erosive power. It is more likely that some type of solution of the sandstone cement is involved below groundwater level. Thus, we have the same puzzle that was encountered in the caves under Solana Beach to the north, where there appear to be caverns deep below the surface that may connect with the caves found along the shore, the latter being clearly related to wave erosion.
Sea Arches and Stacks at Point La Jolla
Erosion of the bluffs at Point La Jolla pose an interesting problem. Examination of the formations and their concretions at the west end of the bluffs and a comparison of their present condition with photographs taken in about 1900 show a conspicuous lack of appreciable erosion (figs. 81a , 81b ). One arch at Goldfish Point has shown very little change since 1908 (figs. 71a , 71b ). The
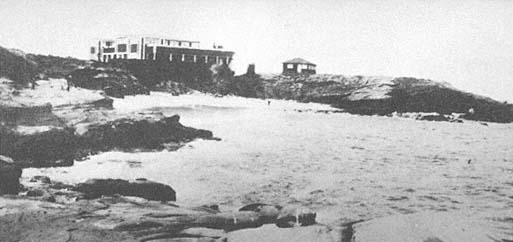
Figure 81a
Photo of La Jolla Cove, 1906. Two buildings were then located on the bluffs behind the cove. The
sandy beach is a favorite swimming spot.
Photo: Anonymous.
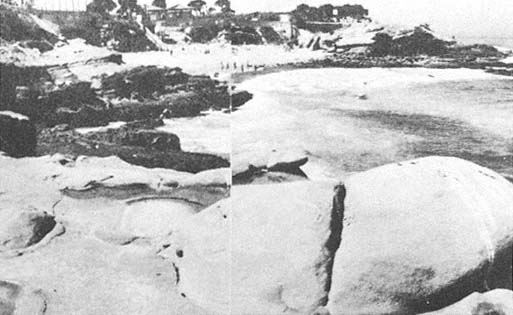
Figure 81b
April 1968 photo of the same site as that in 81 a . Note that the sandstone rocks in the foreground
show almost no change in sixty-two years, but the 1906 buildings have been replaced, and the
cove area is now a city park.
Photo: F. Shepard.
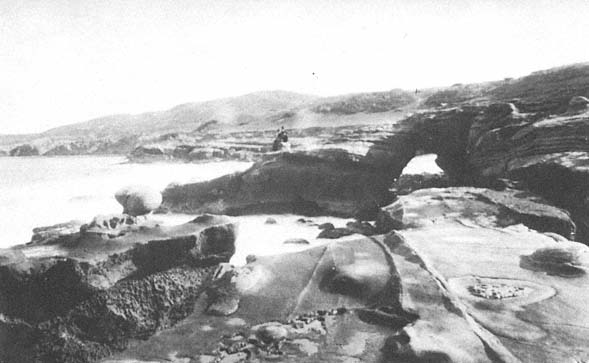
Figure 82a
View of Alligator Head arch, 1870. Note that many lineations and concretions are clearly identifiable in both
this and the following photo.
Photo: F. Shepard collection.
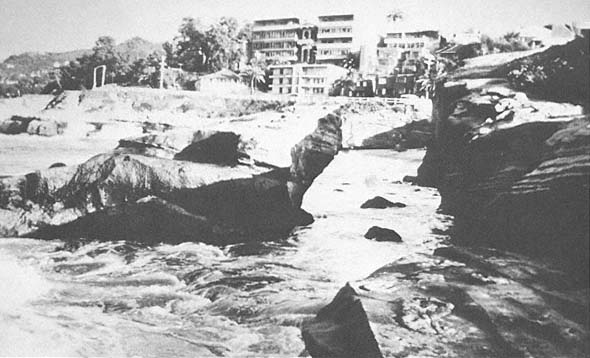
Figure 82b
View at the same location as that in 82 a , 1978. Collapse of the arch occurred during a storm in January 1978.
Photo: G. Kuhn.
same is true of some massive boulders of concretionary appearance a little to the west near La Jolla Cove, which apparently are on the edge of a rock terrace exposed to large converging waves formed by Alligator Head. Furthermore, old pictures of the cove west of the cliffs show decided changes in the well-known arches which existed in the early part of the century and which were partially reinforced with cement in later years. They finally collapsed, the last one falling in 1978. The outer part of Alligator Head has also changed since early photographs were taken around 1870 (fig. 82a ). This arch also collapsed in 1978 (Shepard and Kuhn 1983) (fig. 82b ).
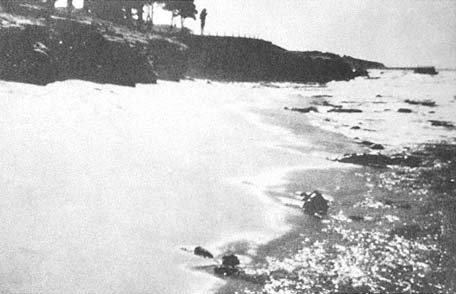
Figure 83a
Boomer Beach west of La Jolla Cove, sometime in the 1940s. Seasonal change occurs
as the result of the different direction of wave approach and the heavier winter surf.
This photo shows summer conditions; waves from the south have built a beach at the
north end and have taken sand away from the south end.
Photo: F. Shepard.
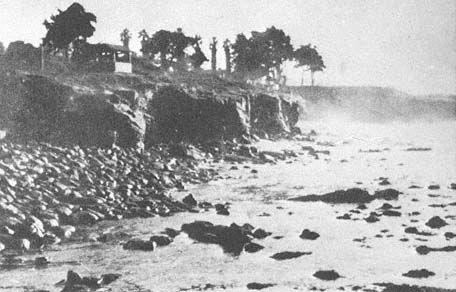
Figure 83b
The same location as that in 83a , taken sometime in the 1940s. This view shows the winter
conditions when heavy surf from the northwest has removed the beach shown in 83 a and
carried sand to the south, creating another, smaller beach on the right in the photo.
Photo : F. Shepard.
Boomer Beach, just south of Alligator Head, is interesting to watch for seasonal changes. It consists of a coarse sand beach with a steep frontal slope during summer months (fig. 83a ) but, with the first winter storm, the sand is washed away to expose underlying boulders (fig. 83b ). The sand apparently is carried partly to the south, forming narrow beach fringes, and some is carried seaward. However, with the onset of summer and the south-approaching waves, the sand returns to Boomer Beach, and the narrow fringes to the south disappear.
Most of the relatively straight, rocky coast extending toward the Children's Pool had had little erosion since the 1930s until the storms in January through March 1983 caused many large cracks to develop. At the Children's Pool, also known as Casa Pool, there is a jetty built out from a rocky point, partly enclosing a cove. It was thought that by putting large holes in the south end of the jetty, any sand that was carried into the enclosure could be washed through, keeping the pool open. This did not work, however; the holes soon became blocked, and the pool was filled with sand, leaving at the north end only a narrow semicircle of water. Farther south, there was a rocky point with some breaks in its continuity
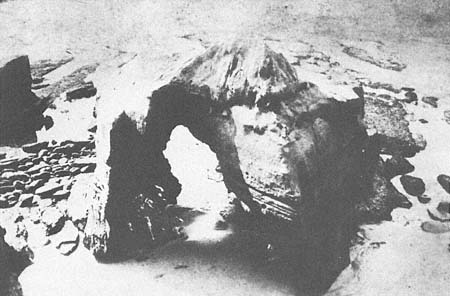
Figure 84a
View of Cathedral Rock Arch, La Jolla, 1873.
Photo: F. Shepard collection.
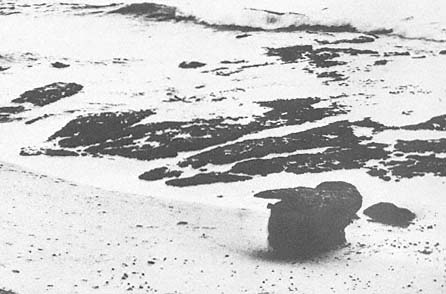
Figure 84b
October 1963 view of the same site as that in 84 a . A remnant is all that is left of the
buttress at Cathedral Rock. By 1968 this remnant had also disappeared.
Photo: F. Shepard.
and a beautiful arch called Cathedral Rock on its west side (fig. 84a ). The arch collapsed in 1906 and, when Shepard first photographed the site in 1934, the buttresses of the old arch were still standing, as were other rocks that have since gradually disappeared; now every remnant of the arch is gone (fig. 84b ). Many sections of the partially submerged rock point have been removed as well, so that the entire coast south of the Children's Pool has changed extensively since the first photographs were taken of this area.
Still farther south is Windansea Beach where body surfers find excellent wave conditions for riding the surf. We have some photographs dating back to 1934 which show some interesting changes. There was a natural bridge, apparently cut in a surge channel and exposed only when the sand was cut away
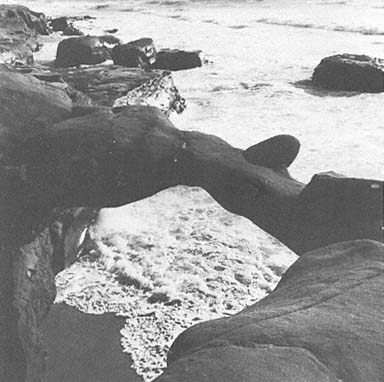
Figure 85a
View of arch at Windansea Beach, La Jolla, 1952.
Photo: F. Shepard.
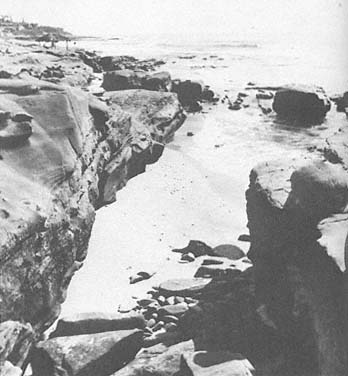
Figure 85b
Summer view after Windansea arch collapsed, 1968.
Photo: F. Shepard.
from the sandstone during winter storms (fig. 85a ). This arch collapsed sometime in the 1950s (fig. 85b ). It is interesting that the sand shifts to the south during the winter months and to the north during the summer, as at Boomer Beach. Again, there is more sand during the relatively small waves of summer. Sea cliff retreat was observed by lifeguards one-half mile south of Windansea Beach during January 1983. Other parts of this rocky coast that have not been studied are probably also retreating. It is known, however, that erosion was occurring at the foot of Marine Street just before Christmas of 1940 during a period of large waves. The small bluff in front of the Revelle house near Windansea Beach was being eaten away by these waves when Shepard and Revelle returned from a cruise to the Gulf of California on December 23 of that year. Erosion was halted by dumping large boulders at this point; a seawall later was constructed by the Revelles. This was the same storm that cut away the talus at the base of the cliffs that terminate north of La Jolla (Kuhn and Shepard 1979a ). One wonders what conditions of the early 1900s allowed the development of sea arches in these resistant rock units. Only one arch is being formed at present, so far as we know, and all the old ones have disappeared (Shepard and Kuhn 1983).
South of La Jolla the cliffs and terraces are of much softer rock, and beyond the Bird Rock area they are largely alluvium. One house there had a porch extending out to the edge of a shale cliff, but in 1965 the porch collapsed when the underlying cliff failed. At Bird Rock, a stack standing above the tidal terrace showed little erosion during the past few decades, up until January 1963, as documented through photographs. The low alluvial cliffs, however, are actively eroding, although the rate has not been established.
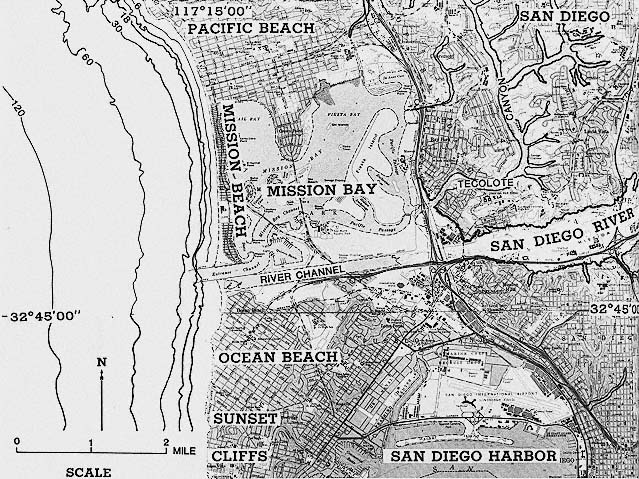
Figure 86
Location map of Pacific Beach, Mission Beach, and San Diego Bay and River.
10—
Pacific Beach and Mission Beach; San Diego Bay and River
Description of the Area
The coastal lowland constituting Pacific and Mission beaches rests on the former delta of the San Diego River (fig. 86). There is one slightly elevated portion at Crown Point, which is an extension of the La Jolla terrace. The alluvium extends almost to Crystal Pier in Pacific Beach where it is replaced by a natural barrier across Mission Bay. The community of Mission Beach to the south is constructed on this barrier and has been protected in recent years from wave erosion by seawalls. Waves have occasionally swept over the walls and into the streets. The southern part of Mission Beach is a sand spit built across Mission Bay. The San Diego River occupies a rather broad valley extending east and west and entering Mission Bay, where it has deposited a considerable amount of alluvial material. The mouth of the river has been greatly modified by man to form a delta for the flatland between the northern margin of Point Loma and the lowland around Old Town.
Changes in Mission Beach and Mission Bay
The beach terminates before forming a complete barrier across the mouth of the bay. The tide is sufficient to keep the mouth open, and a flood channel has been built across the beach to carry floodwaters from Mission Bay to the sea. It is very doubtful whether this outlet could carry the volume of floodwater that could sweep down the valley in a repetition of the great floods of 1862, 1884, 1889, and 1891, or even subsequent smaller floods. In fact, if the reservoirs were full, as they are as this is being written, heavy rain in the adjacent mountains might render the flood channel useless (fig. 87). Three jetties built across the mouth of Mission Bay have cut off the supply of sand from Mission Beach to Ocean Beach, and as a result, the cliffs at Ocean Beach have receded considerably. Sand has been introduced from north of the jetties to prevent serious erosion of that community.
History of San Diego Harbor and River Channel Changes
San Diego is the oldest city on the west coast. It grew around the Mission San Diego de Alcala, founded by Father Junipero Serra in 1769 (Pourade 1960:7). San Diego Harbor had been discovered more than 200 years earlier, in September 1542, by Rodriquez Cabrillo (Pourade 1960:49). Presently the harbor is kept open by tidal currents, with the exception of a sandbar that has to be dredged from time to time. It is the best protected natural harbor on the southern California coast. Mission Bay, formerly called False Bay, was deep enough up until 1810 to allow even relatively deep draft vessels to enter (U. S. Congress 1853:111).
During the early nineteenth century southern California rivers seem to have changed their courses periodically as the result of numerous floods. Prior
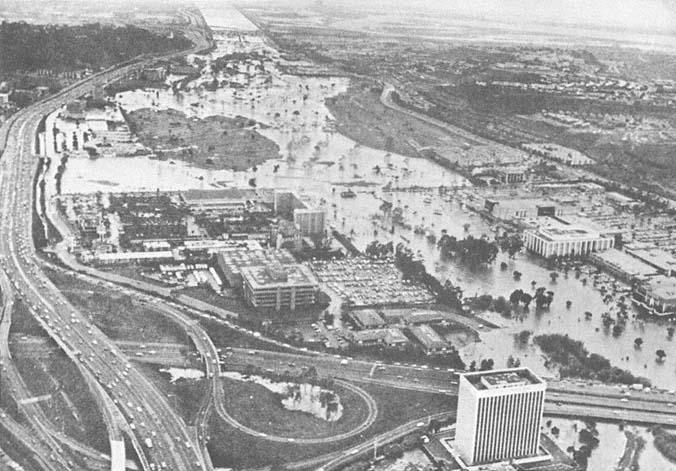
Figure 87
January 1979 oblique aerial view looking west down the San Diego River Valley during the peak of flooding that year.
Photo : Union-Tribune Publishing Co.
to 1821, the San Diego River usually entered San Diego Harbor. In the fall of 1821, however, a flood changed the river channel in one night, and the greater volume of the flow was diverted into what was then known as False Bay, leaving only a small stream still flowing into the harbor (J. C. Hayes 1874). This flood was remarkable in that no rain fell along the coast. The river was later observed
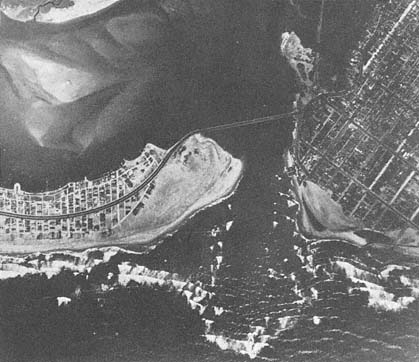
Figure 88a
Aerial photo of the entrance to Mission Bay, before jetties were built to maintain
the boat channel, 1944.
Photo : F. Shepard.

Figure 88b
Aerial photo of the same location as that in 88 a , following the construction of jetties at the mouth
of the San Diego River and the entrance to Mission Bay, 1968. The area north of the jetties was
extensively dredged to create a yacht basin and recreational facilities.
Photo : U. S. Army.
to flow into San Diego Harbor in 1849 and 1856, and the U. S. Coast and Geodetic Survey map of 1859 shows it to be flowing there once again. Because of the high deposition rate of the river, which threatened to ruin San Diego Bay as a harbor, the federal government diverted the flow into Mission Bay and built a levee embankment of earth extending from near Old Town to Point Loma in the fall of 1853 (Derby 1853). Later that year, heavy rains caused the river to change course once again, washing out part of the levee and resuming its old course into the harbor (San Diego Herald 1855). The worst flood in this area was in 1862, appropriately called the Noachian Deluge, and was of special significance because it had a bearing on the Civil War. In San Diego, Mission Valley was inundated, and houses in lower Old Town were flooded when severe winds from a sea storm from the south backed the water up from the bay into the river (Pourade 1964:250). This flood was very significant because it held its peak for over twenty-four hours. In 1876, the levee was reconstructed, and no further diversions into San Diego Bay have occurred. Since then, a considerable volume of sediment has been added to the San Diego River delta in Mission Bay from occasional floods.
In 1935 El Capitan Dam was constructed 27 miles up the San Diego River; this reduced the sediment entering the bay considerably. An earlier dam was overtopped in 1916, increasing the floodwaters coming down Mission Valley at the time. The Mission Bay and San Diego River jetties were built in 1948, at a time when the shore of the bay was subject to alternating periods of recession and advance. By February 1951, the river levees had been connected to the jetties. All tidal flow was confined to a new channel. Since the river discharges only during flooding, the middle channel was soon completely filled. The channels were finished by 1955, after various difficulties were overcome and the jetties were considerably lengthened so that shallow bars would not form in the entrance. Extensive dredging was done in Mission Bay to make the channel deep enough for a yacht basin, and other areas were developed to accommodate swimming and other recreational activities (figs. 88a , 88b ).
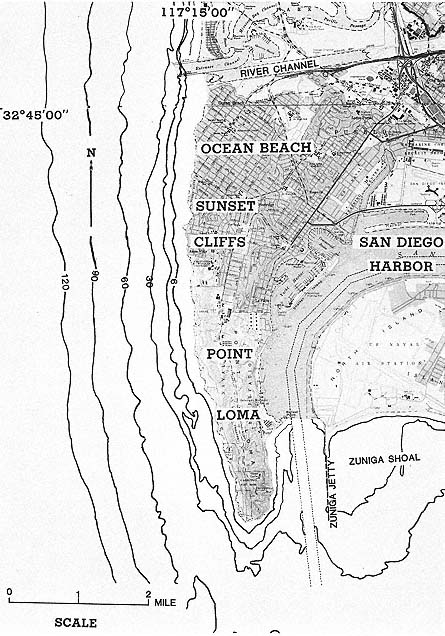
Figure 89
Location map of Ocean Beach, Sunset Cliffs, and Point Loma.
11—
Sunset Cliffs and Point Loma
Description of the Area
The community of Ocean Beach extends south into Sunset Cliffs, a residential area in the city of San Diego at the north end of Point Loma. The northern part of Ocean Beach is laid out on a remnant of the old delta deposit of the San Diego River plus sand dunes (fig. 89). Historically, the beach in this area was subject to periods of accretion following floods. Since the building of the San Diego River jetties, the beach has had to be maintained by the spoil from dredging.
South of Ocean Beach the coast rises, consisting of Cretaceous and Pleistocene sedimentary formations, forming the scenic Sunset Cliffs area of Point Loma. The point itself rises to a height of about 400 feet, with steep sides at the southern end. The structure of this area, which forms a counterpart to Soledad Mountain, is described by Kennedy (1975a , 1975b ).
Rapid Erosion of Sunset Cliffs in Recent Years
It was noted by Kennedy (1973) that sea cliff retreat at Sunset Cliffs amounted to three feet in the last seventy-five years, or about two inches per year. Where a cave roof collapsed, however, local retreat could be much greater. In recent years, rapid retreat has endangered the road along the cliff, necessitating the dumping of concrete debris at several locations (fig. 90). Unfortunately, the debris has actually accelerated erosion by grinding away at the cliff face, aided by the wave action throwing the coarser material against the cliffs, as shown in our study at Oceanside (Kuhn and Shepard 1980).
As evidenced from examination of photographs taken in 1938, 1946, and again in 1968 (figs. 91a , 91b , 91c ), originally there was an offshore arch and another attached to the cliff. By 1945, the longshore arch had collapsed, and the offshore arch was well developed. In 1968, only a small pedestal remained of the offshore arch, and the isolated rock near the former cliff arch had completely disappeared. Also, a large quantity of concrete and asphalt debris had been dumped down the cliff to retard further erosion.
In recent years, the U. S. Army Corps of Engineers (1976) investigated the coastal retreat at Sunset Cliffs and determined that as much as thirty-eight feet of landward retreat occurred at the toe at Del Mar Street and forty feet along the top of the bluff (fig. 92). The majority of the erosion at this site is the result of surface runoff, overwatering of the bluff top, pedestrian traffic, and burrowing by animals. Erosion has occurred in many places as far back as the coastal road, and city authorities have dumped concrete debris and asphalt at these locations in an attempt to slow erosion. In March 1968, a section of Sunset Cliffs separated from the cliff and slumped as a result of an earthquake, and the coast road was endangered (fig. 93).
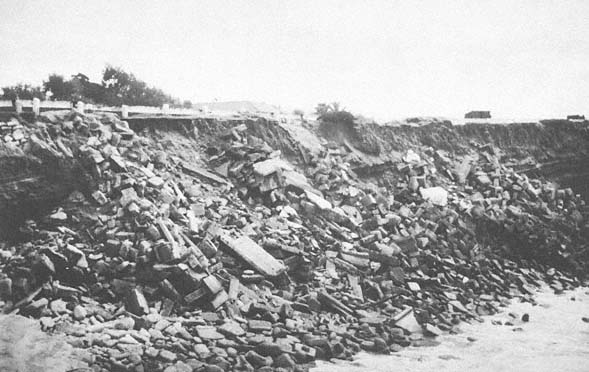
Figure 90
View of erosion along Sunset Cliffs, Point Loma, 1980. Note that large amounts of concrete debris have been
dumped along the area to slow erosion of the cliffs and the adjacent road.
Photo : G. Kuhn.
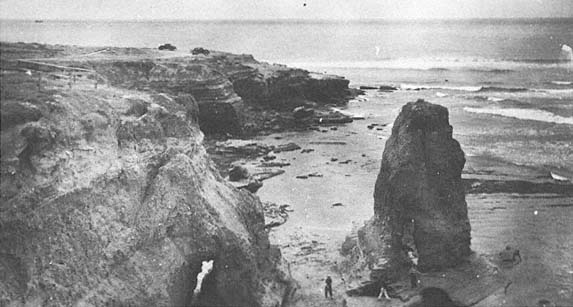
Figure 91a
View of sea arches at Sunset Cliffs, 1938. Note that one arch is formed in the center of a sea stack and the
other is connected to the mainland cliff.
Photo : F. Shepard.
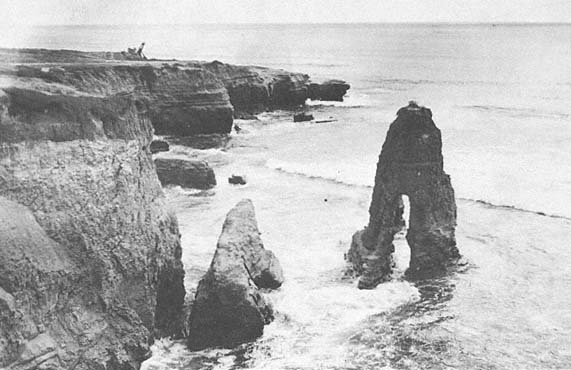
Figure 91b
View of the same site as that in 91 a , 1946. Note that the arch previously connected to the mainland has collapsed.
Photo : F. Shepard.
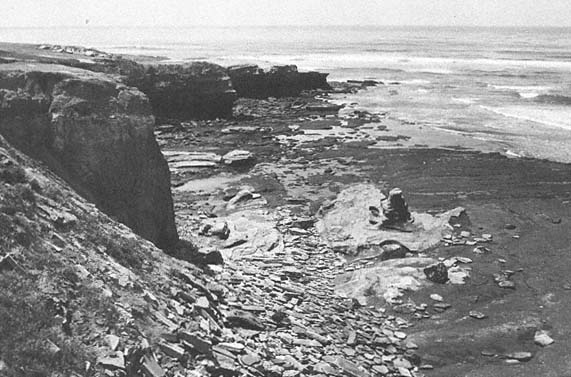
Figure 91c
View of the same site as that in 91 a and 91b , 1968. Note that only a small pedestal remains to mark the
site of the arch. The isolated rock near the cliff has also disappeared.
Photo : F. Shepard.
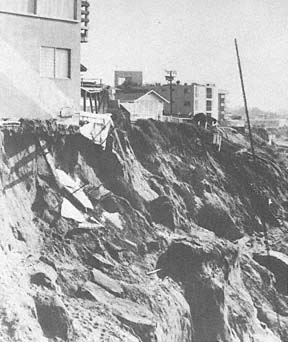
Figure 92
View looking south along the bluffs at Del Mar Street,
Sunset Cliffs, 1976. A line indicates 1954 property
line. The bluff top retreated forty feet, and the cliff
base retreated thirty-eight feet between 1962 and
1976. From 1952 to 1976, the total retreat at the top
of the bluff was approximately seventy-five feet.
Photo : D. Pain.
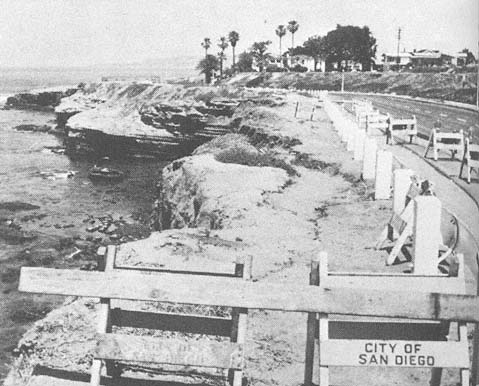
Figure 93
Slumping as a result of an earthquake at Sunset Cliffs, endangering the coastal road.
Photo : F. Shepard.
Ballast Point
What is now Ballast Point was originally named Punta de los Guijarros, or Cobblestone Point, by the early Spanish explorers. The stones found there were a natural phenomenon. Because this area, on the east side of Point Loma, was an obstacle to entering the bay, it was a favorite place to dump ballast while the ships waited for sailing tide, and hence the name change. The point was originally fortified as a military defense for the harbor and the city of San Diego. In 1847, however, all but one cannon from the fort located on the point were dismantled and thrown into the deepest part of the bay. The point was later utilized by whalers, and thousands of whales, killed in nearby waters, were processed at this location. In fact, the first smog in the area was created from the whale-oil smoke. The smog finally disappeared when the whale population in the area was sufficiently reduced so that the whaling operation was no longer profitable. Guns were installed again in 1873 but were not fully operational until the 1890s. One wonders what nation might have attacked us at that time. Since then, the Navy has continued various operations at Ballast Point and elsewhere on Point Loma.
The sedimentary formations near the lighthouse at the southern, outer end of Point Loma contain some boulders with dimensions of up to twenty feet, consisting of metamorphosed volcanic rock completely foreign to the area. This is a most difficult occurrence for geologists to explain because no well-known method for transporting such large boulders seems to apply. It is obvious that there were no icebergs or glaciers at the time which could explain the placement of these foreign rocks. It has been suggested that faulting, and landslides resulting from the faults, might have produced the phenomenon, but no such faults have been found. Another possibility is that there were great slides on the sea floor, as are occasionally seen in submarine canyons, which might have carried the boulders for miles from the crystalline rock zone to where they are now found. We are finding that great displacements are possible on the sea floor, although we do not totally understand their mechanism.
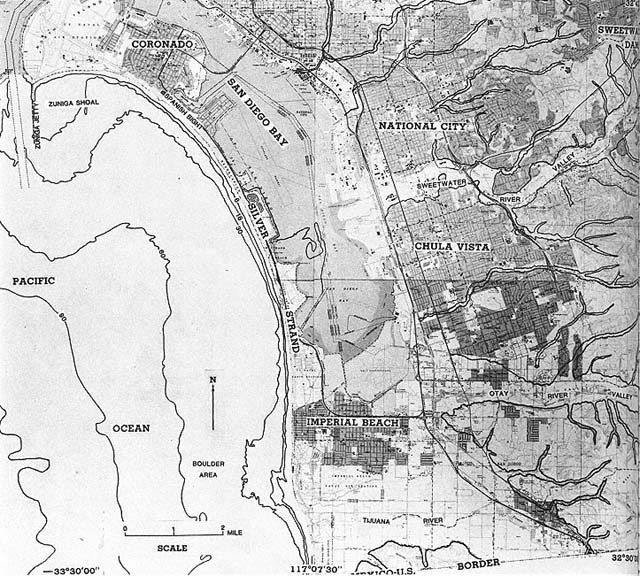
Figure 94
Location map of Coronado and Imperial Beach south to the Mexican border.
12—
Coronado and Imperial Beach
Description of the Area
Silver Strand Littoral Cell
The segment of coastline extending from the entrance of San Diego Bay southward to beyond the International Border between the U.S. and Mexico is known as the Silver Strand Littoral Cell. This cell has its own northward transport path and zone of deposition. The principal natural source of sediment for this cell is the Tijuana River. The accretion area zone is in Zuniga Shoal and directly offshore of this zone (Inman 1976:40).
Coronado was once a combination of two islands, with a swampy area between them. The swamp is now entirely filled with sediment brought by the Navy when the large base was established to the south. There is a long spit coming from the embayment of the Sweetwater and Tijuana rivers, and inside this an extensive delta has built up much of the land, extending as far south as the Mexican border (fig. 94).
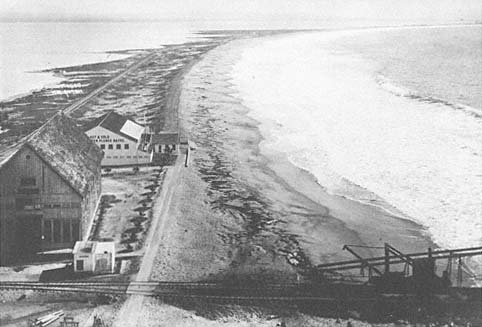
Figure 95
View of the Coronado sand spit looking south, 1898.
Photo: U. S. Grant IV collection.
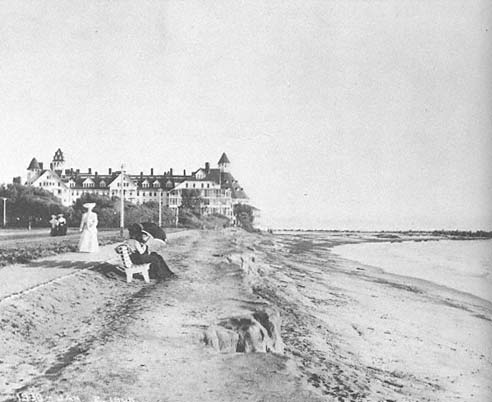
Figure 96a
January 1905 view of Hotel Del Coronado.
Photo: F. Shepard collection.
Zuniga Jetty and the Building of the Hotel Del Coronado
In 1888, the Hotel Del Coronado was built at the northern end of Coronado on a poorly developed sand spit (fig. 95). In 1893, construction began on a 7,500-foot-long jetty on Zuniga Shoal, intended to stabilize the entrance to San Diego Harbor. This rubble structure, located west of the hotel, was completed in 1904. Erosion problems developed on the spit immediately following construction of the hotel, and a small stone breakwater was built to the southeast, in 1897, to offer protection from wave erosion. It was damaged and repaired at a later date.
Erosion of the beach occurred just west of Spanish Bight in 1900, following extension of the Zuniga Jetty. Railroad tracks northwest of the jetty had to be relocated in 1901. Erosion continued during the next extension of the jetty in 1903–1904, which took it farther east of Spanish Bight. Severe storms beginning in January 1905 caused erosion both north and south of the Hotel Del Coronado (figs. 96a , 96b ). On January 4 and again on February 18, waves focused on the hotel area, necessitating the installation of 30,000 two-hundred-pound sandbags. February and March storms continued to cause serious wave erosion, and a total of 110 feet of land was removed by the waves along Ocean Boulevard (fig. 96c ); the houses left undamaged were subsequently relocated to downtown San Diego. Between 1905 and 1908, a 5200-foot-long seawall was built from the hotel west along Ocean Boulevard.
In recent years, over thirty million cubic yards of sand have been dredged from San Diego Harbor (Shaw 1980). One million of that was deposited north of the hotel and sixteen million was deposited to the south, which greatly widened the beach. Subsequently, construction of huge condominium apartments has dominated the spit south of the hotel and down through Imperial Beach (fig. 97).
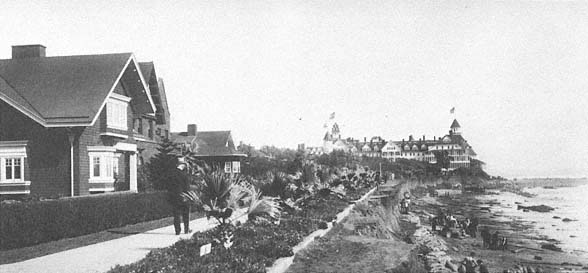
Figure 96b
February 1905 view of the same site as that in 96 a . Note the severe erosion of the beach cliff and that
approximately 30,000 two-hundred-pound sandbags had been placed north and south of the hotel, in
order to save it from destruction by the waves.
Photo : F. Shepard collection.
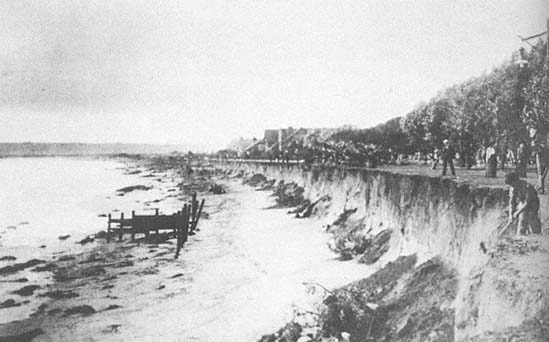
Figure 96c
March 1905 view looking south from the Hotel Del Coronado. The photo was taken following severe sea
storms which eroded approximately 110 feet of beach and cliff sediment to the north of the hotel.
Photo : Center for Coastal Studies, SIO.
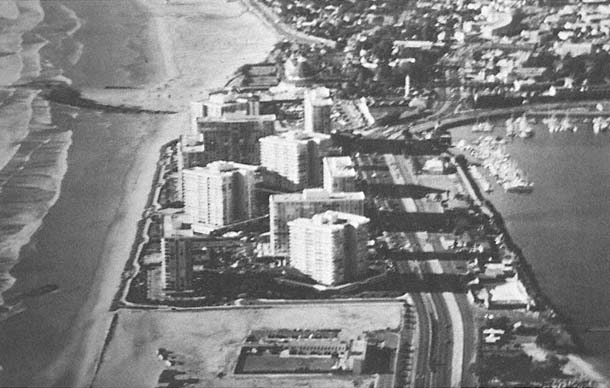
Figure 97
View of condominiums recently constructed on the Silver Strand Coronado sand spit, 1980.
Photo : M. Clark, Center for Coastal Studies, SIO.
Figure 98
"Silver Strand littoral cell showing the Tijuana River as the
former natural sand source, the littoral transport path north
along Silver Strand, and the depositional areas or sinks.
The final sink for sand in this littoral cell is the offshore area
indicated by the isolines of sand accretion determined by
comparisons of surveys in 1923 and 1934." From Inman 1976:41.
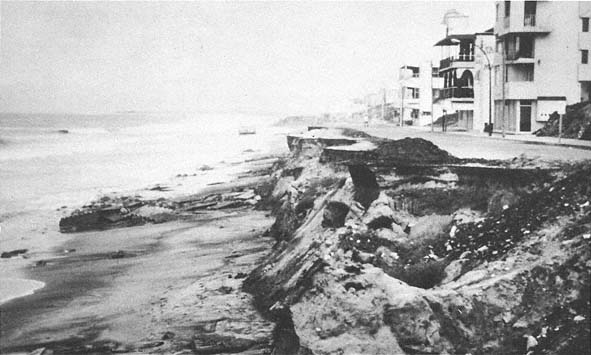
Figure 99
View along the beach at Tijuana, 1983. Note the severe erosion of the beach and road.
Photo : C. Everts.
Imperial Beach Erosion
Erosion at Imperial Beach has been an increasing problem since 1953, even during the drought periods preceding the recent floods of 1978 to 1980. It was during this earlier dry period that sand became unavailable to the beaches because dams had been built on the Tijuana River Basin. Inman (1976) indicates that approximately 660,000 yards of sand per year would have normally reached the beach, if not entrapped by these dams. As it actually happened, however, the beach had to be artificially nourished by dredging. Between 1945 and 1967, this sediment had moved north from Imperial Beach to the Zuniga Shoal area, indicating a predominantly south-to-north longshore current during this period (fig. 98).
By contrast, weekly observations made by Shepard (1950) for about a year in the late 1940s showed a more variable direction of the current. At the south end of the beach, the currents were predominantly south to north, while in the northern portion, they were largely north to south, with the exception of an intermediate point at the northernmost station. Shepard also found that currents near Zuniga Jetty were more commonly south to north in the summer (fig. 3) and north to south in winter, as would be expected from the wind direction during the varying seasons. The cutting away in recent years of the broad beach at the condominium apartments may indicate yet another change in direction of the current. During the early part of the winter of 1983, the beaches south of the border were severely eroded, and the sediment apparently moved north, accreting in the Imperial Beach area. Since construction of the Rodrequis Flood Control Dam on the Tijuana River in Mexico, the beach cliff has eroded markedly for at least three miles south of the border, and all construction along the shore, including the highway, is disappearing as this is written (fig. 99). It is obvious that the currents in the area are quite complicated.
For some time there has been much discussion about cutting another entrance into San Diego Bay, near the south end, so as to have a second channel
to the sea in case the main entrance becomes blocked by earthquakes or military activity. This also would give access to boats from the south. One of the difficulties with the second entrance idea is that it would probably decrease the tidal current at the main entrance, which would result in deposition such that dredging would become necessary. Before constructing a second entrance, Imperial Beach should consider the various marinas being maintained along the coast: these all require jetties that have considerable influence on sediment transport.
13—
Conclusions
The information presented in this small volume is unique in that it represents probably the most complete study ever done of any coastline. It includes the history of erosion, the development of its beaches, and the retreat of its cliffs. In our description of the various coastal areas of San Diego County, we have illustrated the problems confronting coastal planning of future development, relating what has happened in the past to what may recur in the future.
The coast of San Diego County is of two principal types. In the northern part and extending as far south as La Jolla, the coast is cliffed, with raised terraces and beach ridges. The cliffs and terraces at the northern end rise to several hundred feet in the central portion. This section of coast is cut by a series of relatively large valleys with partly filled estuaries at their mouths and barriers at their lower ends. The southern portion of this area has mostly lowlands with large estuaries, deltas, and barrier islands, the history of which has been investigated with special interest.
The sea cliffs consisting of unconsolidated alluvium that are directly exposed to attack from the open sea normally experience erosion on the order of
one or more feet per year and locally as much as ten to fifteen feet during a single large storm, as experienced in late January 1983. This rapid erosion, however, did not occur during the mild winters that lasted from the late 1940s until 1977, and in much of the area, this has led to a deceptive indication of cliff stability. We have found that more consolidated sea cliffs, such as well-cemented sandstone, often give a false appearance of long-term stability. Cliff erosion in sandstone, for the most part, is episodic, where long periods of little change may be followed by large landslides, causing many feet of retreat in a short time. Also, cliff erosion may occur on account of the solution by groundwater, precipitated by the extreme watering of non-native vegetation such as iceplant, which has a high water retention, or from leach lines, and the watering of lawns, which may amount to the equivalent of fifty to sixty inches of rain per year (Sorben and Sherrod 1977). The rise in the groundwater table that accompanies urbanization inland from the bluffs is producing a far greater rate of cliff erosion than had been thought possible. Sea caves enlarge and even collapse during storm conditions. Other caverns have been discovered under some buildings along the bluffs and are apparently the result of solution of the cement of the underlying fractured sandstone. Still other caves are seen to erode by groundwater and constitute a menace to the bluff dwellings.
Recent large landslides, particularly those in the high cliffs north of La Jolla, are of special note, as they occurred even during drought years as a result of groundwater and so illustrate this great danger to coastal cliff dwellings. The surprising changes that have occurred in some beach communities along the bluff top are due to surface water. From Oceanside southeast through Encinitas, a distance of fifteen miles, formerly large sandy beaches have now been replaced by cobbles, which for the most part were observed to come from offshore. These cobbles and even large rock riprap, the latter designed to protect the shore, may be thrown by relatively small waves against the buildings they were designed to protect, as documented during the storms from January to February 1983. Similarly, the beach constituting the long strand
south of Coronado has a history that shows how the activities of man can effect an amazing change in the character of the shoreline.
A particularly horrifying aspect of our studies is the evidence of great floods and terrible storms in the past century, and the realization that a recurrence of these conditions in the future would be disastrous to the economy of southern California coastal valleys and lowlands and, in fact, to the life of our community.
An in-depth examination of weather records for the period following the great explosive volcanoes in the past, notably Krakatoa in 1883, shows us how the weather seems to undergo the most remarkable changes within two or three years of these major eruptions. Since we are clearly in the middle of one such volcanic episode, it is particularly interesting to note that in the year since the eruption of El Chichon in Mexico, we have experienced some terrible storms here in southern California and throughout the world, and some of the worst floods on record have occurred, notably in the Mississippi Valley. Awful hurricanes of record destructive force have hit the Hawaiian Islands and French Polynesia, and almost continuous downpours on the coast of Chile and Peru have caused floods such as have been unknown there previously. La Jolla had one windstorm greater than any experienced in many decades, which produced serious damage to coastal structures. The Seine River overflowed near Paris, and even worse flooding occurred in the vineyards in the south of France and in large cities all along the Rhine River in Germany. The worst snowstorms on record have been hitting the Colorado Rockies, and yet New England had an amazing period of warm weather during the early winter of 1982–83 which almost ruined ski resorts because of a lack of snow. As of April 1983, this same area suffered the coldest, snowiest spring of record. In 1982 New York had the warmest daily temperatures for December in 150 years of record-keeping. This was followed by one of their worst snowstorms, which almost paralyzed the city for days. On 19 April 1983, nearly sixty new record low temperatures were set from the Great Lakes to the Gulf Coast.
These are just the most significant of the amazing weather changes that have been evidenced in the early stages of the present volcanic episode, and they are clearly the same sorts of disasters that followed the eruption of Krakatoa in 1883. The picture that emerges is not very encouraging, but it is hoped that future developments may at least benefit from what has been learned by observing the past and what is occurring at the present. Through this, southern California may be encouraged to provide better flood control channels and reservoirs wherever possible, and to prepare for the great storms which might recur in the not-too-distant future, following future volcanic episodes. It is also hoped that long-range weather forecasters of the future will use this historical information as an aid to their prediction methods.
GEOLOGICAL TIMETABLE
|
GLOSSARY
A
Aerosol— Condensation of gas such as sulfur dioxide into minute droplets. Aerosols develop after volcanic ash and dust are thrown into the upper atmosphere.
Alluvial fan— Fan-shaped deposit at the base of a slope caused by natural processes. Small ones are caused by rain wash, often as a result of the works of man; large ones can be caused by stream deposition in desert areas.
Alluvium— General term for sedimentary deposits formed by streams and fans due to runoff at the foot of a slope, or on a flood plain.
Arch (sea)— An opening through a headland, or any type of natural bridge along the sea coast.
B
Barrier (coast)— An elongated offshore ridge or mass, usually of sand, rising above the high-tide level, and generally extending parallel to and at some distance from the shore, and built up by the action of waves and currents. Examples include barrier beach and barrier island (bar).
Blockfall— A specific term used to describe failure of a portion of a vertical or near-vertical cliff.
Bluff-top grading— The artificial removal of the bluff-top layer which, in semiarid climates, is often more cemented by iron oxide than the underlying sediments.
Breakwater— A structure built in the sea, somewhat parallel to the shore, designed to stop ordinary waves from breaking on the enclosed area.
C
Chubasco— Spanish name for violent storms. These may reach hurricane intensity and occur during late summer and early fall along the northwest coast of Mexico.
Cobbles— A generalized term to describe well-rounded rocks along the shore and in river channels.
Concretion— A hard, compact, rounded, normally subspherical mass or aggregate of mineral matter generally formed by orderly and localized precipitation from aqueous solution.
Cretaceous— See Geological Timetable.
Crib wall— A term used here to describe a concrete or wooden engineering structure designed to stabilize a bluff face or road cut.
Crystalline rock (other than sandstone)— A rock made up of minerals in a clearly crystalline state.
Cusp
Any of a series of low, crescent-shaped mounds or ridges of beach material built by wave action and separated by smoothly curved, shallow depressions spaced at more or less regular intervals along and generally at right angles to the shoreline, varying in length across their seaward-pointing apices from less than 1 foot to approximately 300 feet.
Cyclonic storm— Windstorm moving into a low-pressure area with winds going in a counterclockwise direction in the northern hemisphere and clockwise in the southern hemisphere.
D
Dike— A term used to describe a small rock wall, often created by intrusion of volcanic rock which, after cooling, becomes more resistant than the surrounding rock and after erosion stands above it.
E
Eocene— See Geological Timetable.
F
Fault coast— A coast formed directly by faulting.
Fault scarp— A steep slope or cliff formed directly by vertical movement along a fault and representing the exposed surface of the fault before modification by erosion and weathering.
Flood control channel— An artificial channel designed to conduct excess run-off during a flood period.
Flood plain— Flat area adjacent to a river channel subject to overflow.
G
Groin system— A shore-protection structure built from the shore, usually in the breaker zone. It serves to trap littoral drift and thereby prevent erosion locally.
Groundwater erosion— The slow movement of water beneath the ground producing erosion where it leaves the ground.
Groundwater table— See Water Table.
H
Hog-back— Any ridge or sharp summit and steep slope of somewhat equal inclination on both flanks; resembling in outline the back of a hog.
J
Jetty— A seawall extending well out from the coast, beyond the breakers.
L
Laminae— Thin layers of sediment.
Landslide— A general term for downslope slippage of the land surface.
Levee— An artificial embankment, usually of random earth fill, built along the bank of a watercourse or an arm of the sea and designed to protect land from inundation or to confine streamflow to a channel.
Littoral cell— A zone along the coast where sediment is introduced largely by rivers or coastal erosion, bordered by zones where sediment is carried seaward. A definite unit of coastline in which there is a source of sand and a predominant current moving the sediment toward a zone of deposition such as a submarine canyon.
Littoral drift— The sedimentary material moved along the coast by waves and currents.
Longshore current— See Littoral Drift.
M
Marine sediments— Deposits of sediments formed in the sea.
Metamorphism— The mineralogical and structural adjustment of solid rocks to physical and chemical conditions imposed below the surface zones of weathering and cementation, and which differ from conditions under which the rocks originated.
Midden— Deposits supposedly left by ancient man.
Miocene— See Geological Timetable.
N
Noachian Deluge— Used to describe the great 1862 flood which filled the great valley of California and bankrupted the state. From the flood described in Genesis during which the patriarch Noah was said to have saved his family and representative creatures.
Nonmarine sediments— Deposits of sediments formed on the land.
P
Perigean spring tide— The tide produced when the earth and the moon are in close proximity and the moon is either full or new.
Phreatic— Said of a volcanic eruption or explosion of steam, mud, or other material that is not incandescent; it is caused by the heating and consequent expansion of groundwater due to an underlying igneous heat source.
Piezometer— Instrument used to measure the height to which groundwater would stand in a pipe at various depths below the surface.
Pleistocene— See Geological Timetable.
Pore pressure— The pressure experienced by water in the voids of a porous medium such as the pores of saturated soil.
R
Riprap— A layer of angular pieces of large resistant rock placed along the shore to prevent erosion of a structure, building, or embankment.
S
Sand bypass system— An artificial means of moving sand along a shore to form a beach.
Sea cave— A cleft or cavity in a sea cliff, excavated where wave action has enlarged natural lines of weakness in easily weathered rock; it is usually at sea level and is affected by the tides. Many are vertical by widening of a joint or fault, such as the La Jolla caves.
Sedimentary rock— Any rock resulting from the consolidation of loose sediment that has accumulated mostly in layers.
Sedimentary structure— The nature of layers in a sedimentary rock, such as folded or faulted.
Shingle— A term often used in the past to describe beach cobble deposits but more recently confined to oval, flattened rock deposits.
Solution— A process of chemical weathering by which rock material and calcareous cement is dissolved by groundwater.
Spit— A fingerlike extension of the beach.
Stack (sea)— A small, lofty, isolated, commonly steep-sided, pillarlike rocky island or mass near a cliffed shore, detached from a headland by wave erosion assisted by weathering; especially of columnar structure and roughly horizontal stratification.
Subaerial erosion— The natural processes of wearing down the land surface.
Submarine canyon— A valleylike feature of the sea floor often heading near the coast and extending down the slopes.
Surface wave— A seismic wave that travels along the surface of the earth or parallel to the earth's surface.
T
Talus— Rock fragments of any size or shape (usually coarse and angular) derived from and lying at the base of a cliff or very steep, rocky slope. Also the outward sloping and accumulated heap or mass of such loose broken rock, considered as a unit, and formed chiefly by gravitational falling, rolling, or sliding.
Tertiary— See Geological Timetable.
W
Water table— The surface between the zone of saturation and the zone of aeration; that surface of a body of unconfined groundwater at which the pressure is equal to that of the atmosphere.
Wave-cut terrace— A platform formed just below sea level by the cutting by the waves.
REFERENCES
Abbot, C. G. 1913. Do Volcanic Explosions Affect our Climate? National Geographic Magazine 24 (2):181–198.
Abbot, C. G., and F. E. Fowle. 1913. Volcanoes and Climate. Smithsonian Miscellaneous Collections 60(29):8.
Atcheson, Topeka, and Santa Fe Railway Co., 1978. Study and Report of the Del Mar Bluffs and the Santa Fe Railways Roadbed Stability at Del Mar, California. Prepared for California Coastal Commission. 130 pp.
Bada, J. L., R. A. Schroeder, and G. F. Carter. 17 May, 1974. New Evidence for the Antiquity of Man in North America Deduced from Aspartic Acid Racemization. Science 184:791–793.
Berggreen, R. 1979. Geology of the Proposed Camp Pendleton Site, San Diego County, California. In Geologic Guide of San Onofre Nuclear Generating Station and Adjacent Regions of Southern California , A. A. P. G. Guidebook no. 46, pp. A49–A62.
Brewer, W. H. 1966. Up and Down California in 1860– 1864 . 3d ed., ed. F. P. Farquhar. Berkeley and Los Angeles: University of California Press. 583 pp.
Converse, Davis and Associates. 1970. Geologic Report on the Probability of Ground Displacement of Faults in the Vicinity of the San Onofre Nuclear Power Plant Site, Units 2 and 3, San Diego County, California. Consultant's report for So. Calif. Edison Co. and San Diego Gas and Electric Co., April 30, 1970.
Dana, R. H. [1830s] 1966. Two Years Before the Mast . Reprinted in The Harvard Classics, ed. C. W. Eliot, 62d printing. New York: P. F. Collier & Son Corp. 405 pp.
Derby, G. H. 1853. Letter to Col. J. J. Albert, Chief, Topographic Engineers, San Diego, 20 November 1853. U. S. Army Engineer Archives, Washington, D. C.
Ehlig, P. L. 1977a . Geologic Report of the Area Adjacent to the San Onofre Nuclear Generating Station, Northeastern San Diego County, California. So. Calif. Edison Co. and San Diego Gas and Electric Co., October 1977.
———. 1977b . Geotechnical Studies, Northern San Diego County. Consultant's report to So. Calif. Edison Co. and San Diego Gas and Electric Co., October 1977.
Emery, K. O. 1941. Rate of Surface Retreat of Sea Cliffs Based on Dated Inscriptions. Science 93:617–618.
———. 1955. Grain Size of Marine Beach Gravels. J. Geol . 63:39–49.
———. 1960. The Sea Off Southern California: A Modern Habitat of Petroleum . New York: Wiley and Sons. 366 pp.
Emery, K. O., and G. G. Kuhn. 1980. Erosion of Rock Shores at La Jolla, California. Marine Geology 37:197–208.
———. 1982. Sea Cliffs: Their Processes, Profiles, and Classification. Geol. Soc. of Amer. Bull. 93:644–654. 8 figs.
Fischer, P. J., J. F. Webb, and E. J. Ticken. 1981. Shelf Sediment Volumes, San Diego County, California. In Geologic Investigations of the Coastal Plain , ed. P. L. Abbott and S. O'Dunn, 134–155. Prepared for San Diego Assn. of Geologists Field Trip, April 1981.
Frautschy, J. D. 1963. Letter to Gordon Oliver of Frank L. Hope and Assoc., July 1963. Scripps Institution of Oceanography. 2 pp.
Fugro, Inc. 1974. Analysis of Geologic Features at the San Onofre Nuclear Generating Station. Consultant's report for So. Calif. Edison Co.
———. 1977. Geologic Investigations of Offsets in Target Canyon, Camp Pendleton, California. Prepared for So. Calif. Edison Co. and San Diego Gas and Electric Co., October 1977.
Greene, H. G., and M. P. Kennedy. 1981. Review of Offshore Seismic Reflection Profiles in the Vicinity of the Cristianitos Fault, San Onofre, California. Unpublished U. S. Geological Survey document prepared for the Nuclear Regulatory Commission.
Greene, H. G., K. A. Bailey, S. H. Clarke, J. I. Ziony, and M. P. Kennedy. 1979. Implications of Fault Patterns of the Inner California Continental Borderland between San Pedro and San Diego. In Earthquakes and Other Perils, San Diego Region , ed. P. L. Abbott and W. J. Elliott, 21–27. Guidebook prepared for Geological Soc. of America field trip, by the San Diego Assn. of Geologists.
Greene, H. G., S. H. Clarke, and B. A. Seekins. 1980. Offshore Seismic Reflection Profiles in the Vicinity of the Cristianitos Fault, San Onofre, California. U. S. Geological Survey Open File Report no. 80–945.
Griggs, R. F., 1922. The Valley of Ten Thousand Smokes . Washington, D. C.: National Geographic Society. 340 pp.
Hales, L. Z. 1978. Coastal Processes Study of the Oceanside, California Littoral Cell . U. S. Army Corps of Engineers Misc. Paper no. H-78-8. 60 pp., 13 appendixes.
Hanna, M. A. 1926. Geology of the La Jolla Quadrangle . Bull. of the Dept. of Geological Sciences. Berkeley: University of California Press. 246 pp.
Hannan, D. L. 1975. Sea Cliff Stability West of the Marine Biology Building. Scripps Institution of Oceanography, La Jolla, California. Benton Engineering Project no. 75-9-18FG. 5 pp.
Hardy, W. E., 1966, Tornadoes During 1965. Weatherwise 19 (1):18–22.
Hayes, B. 1874. Article in the San Diego Daily Union , 19 September 1874.
Hayes, J. C. 1874. The Great Flood. [of 1821] San Diego Daily Union , under heading "Changes in San Diego River," 28 June 1874.
Humphreys, W. J. 1913. The Effect upon Atmospheric Transparency of the Eruption of Katmai Volcano. Monthly Weather Review 41:153–159.
———. 1914. The Relation between Solar Radiation Intensities and Temperature of the Air in the Northern Hemisphere in 1912–1913. Bull. Mt. Weather Observatory, Va . 6:205–220.
———. 1918. Volcanic Eruptions and Solar Radiation Intensities. Monthly Weather Review 46:355–356.
———. 1929. Physics of the Air , pp. 531–593. New York: McGraw-Hill Book Co.
Hunt, G. S., and H. G. Hawkins. 1975. Geology of the San Onofre Area and Portions of the Cristianitos Fault. In Studies of the Geology of Camp Pendleton, Western San Diego County, California , ed. Ross and Dowlen, 7–14. San Diego Assn. of Geologists Guidebook.
Huntington, E. 1914. The Climatic Factor, As Illustrated in Arid America , pp. 233–253. Carnegie Institution of Washington.
Inman, D. L. 1976. Summary Report of Man's Impact on the California Coastal Zone. Prepared for the State of California Dept. of Navigation and Ocean Development. 150 pp.
Inman, D. L., and T. K. Chamberlain. 1960. Littoral Sand Budget along the Southern California Coast. Report of the Twenty-first International Geological Congress, Copenhagen, Vol. of Abstracts , 245–246.
Kennedy, M. P. 1973. Sea Cliff Erosion at Sunset Cliffs, San Diego, California. California Geology 26:27–31.
———. 1975a. Character and Recency of Faulting, San Diego Metropolitan Area, California . California Div. of Mines and Geology Special Report no. 123. 33 pp.
———. 1975b. Geology of the San Diego Area . California Div. of Mines and Geology Bulletin 200. 56 pp.
Kimball, H. H. 1913. Bull. Mt. Weather Observatory, Va . 6:214–215.
Kuhn, G. G. and F. P. Shepard, 1979a . Accelerated Beach-Cliff Erosion Related to Unusual Storms in Southern California. California Geol . 32 (3):58–59.
———. 1979b . Coastal Erosion in San Diego County, California. In Earthquakes and Other Perils, San Diego Region , ed. P. L. Abbott and W. J. Elliott, 207–217. Guidebook prepared for Geological Soc. of America field trip, by the San Diego Assn. of Geologists, November 1979.
———. 1980. Coastal Erosion in San Diego County. In Proceedings of Coastal Zone '80 Conference , pp. 1899–1918. Amer. Soc. Civil Engineers, Hollywood, Florida, November 17–20, 1980.
———. 1981. Should Southern California Build Defenses against Violent Storms Resulting in Lowland Flooding as Discovered in Records of Past Century? Shore and Beach 49 (4):2–10.
Kuhn, G. G., E. D. Baker, and C. Campen. 1980. Greatly Accelerated Man-induced Coastal Erosion and New Sources of Beach Sand, San Onofre State Park and Camp Pendleton, Northern San Diego County, California. Shore and Beach 48 (4):9–13.
Lamb, H. H. 1972. Climate: Present, Past, and Future—Fundamentals and Climate Now . Vol. 1. London: Methuen and Co. Ltd. 613 pp.
———. 1977. Climate: Present, Past, and Future—Climatic History and the Future . Vol. 2, London: Methuen and Co. Ltd. 835 pp.
LeComte, D. 1980. International Weather in 1979. Weatherwise 33 (1):17–19.
———. 1983. World Weather 1982. Weatherwise 36 (1):14–17.
Lee, L., C. J. Pinckney, and C. Bemis. 1976. Sea Cliff Base Erosion, San Diego, California. Amer. Soc. Civil Engineers, National Water Resources Ocean Engineering Conference, April 5–8, 1976, preprint no. 2708.
Legg, M. R. and M. P. Kennedy, 1979. Faulting Offshore San Diego and Northern Baja California. In Earthquakes and Other Perils, San Diego Region , ed. P. L. Abbott and W. J. Elliott, 29–46. Guidebook prepared for Geological Soc. of America field trip, by the San Diego Assn. of Geologists, November 1979.
Leighton and Associates. 1981. Final Geotechnical Planning Report: Torrey Pines City Park. Prepared for Pekarek Group, San Diego, California, Project no. 479070-01. 16 pp.
Libby and Associates. 1978. Bluff Erosion and Structural Stability of Seascape Shores [Solana Beach, Calif.]. Unpublished report prepared for Seascape Shores Management Corp. 9 pp.
Ludlum, D. M. 1979–1980. Weatherwatch. Weatherwise 32–33.
———. 1982. Weatherwatch. Weatherwise 35 (2):96.
Marine Advisors. 1960. Design Waves for Proposed Small Craft Harbor at Oceanside, California. Prepared for U. S. Army Corps of Engineers Los Angeles Dist., Contract no. DA-04-353-CIVENG-60-37. 43 pp.
Mass, C., and S. H. Schneider. 1977. Statistical Evidence on the Influence of Sunspots and Volcanic Dust on Long-term Temperature Records. J. Atmosph. Sci. 34: 1995–2004.
Masters, P. M., and J. L. Bada. 1978. Amino Acid Racemization Dating of Bone and Shell. In Archaeological Chemistry II . Advancement in Chemistry Series no. 171, ed. G. F. Carter, 117–138. Amer. Chem. Soc.
McGlashan, H. D., and F. C. Ebert. 1918. Southern California Floods of January 1916 . U. S. Geol. Water Supply Paper no. 426. U. S. Govt. Printing Office. 80 pp., 17 plates.
Moore, G. W. 1963. Geologic Report, Bureau of Commercial Fisheries Building Site, La Jolla, California. Prepared for Moor and Taber Inc., Fullerton, California, 9 August 1963. 4 pp.
———. 1968. Geological Observations at the Fishery-Oceanography Center. Memorandum to Director, Fishery-Oceanography Center, U. S. Bureau of Commercial Fisheries, La Jolla. 6 pp.
———. 1973. National Marine Fisheries Building Landslide, La Jolla, California. In Studies on the Geology and Geologic Hazards of the Greater San Diego Area, California , ed. A. Ross and R. J. Dowlan, 65–67. Guidebook prepared for San Diego Assn. of Geologists and Assn. of Engineering Geologists field trip, May 1973.
Newton, C. T. 1960. Beach Erosion Report on Cooperative Study of San Diego County, California, Appendix IV, Phase 2. U. S. Army Corps of Engineers, Los Angeles District, Appendixes A–H.
NMC, NWS, NOAA., 10 November 1982. A Major Warm Episode in the Eastern Equatorial Pacific Ocean; A Special Climate Diagnostic Bulletin. Climate Analysis Center, Diagnostic Branch, Washington, D. C., 7 pp., 7 figs.
Phillips, D. W., and D. Aston, 1980. A Record Cold Month in North America. Weatherwise 33 (1):24–25.
Post, J. D. 1976. The Last Great Subsistence Crisis of the Western World . Baltimore: Johns Hopkins Press. 256 pp.
Pourade, R. F. 1960. The History of San Diego: The Explorers . San Diego: Union-Tribune Publishing Co. 203 pp.
———. 1964. The History of San Diego: The Glory Years . San Diego: Union-Tribune Publishing Co. 276 pp.
———. 1965. The History of San Diego: Gold in the Sun . San Diego: Union-Tribune Publishing Co. 282 pp.
PRC Toups Corp. 1979. Crest Canyon Erosion Control Study, Phase 1 report. Prepared for City of San Diego, Park and Recreation Dept. 20 pp.
Rampino, M. R., and S. Self. Historic Eruptions of Tambora (1815), Krakatoa (1883), and Agung (1963), Their Stratospheric Aerosols, and Climatic Impact . Quaternary Research 18 : 127–142.
Róse, W. I., 12 July 1983, Meetings—El Chichón Data. E.O.S. Trans. Amer. Geophysical Union 64 (28):451–452.
Saint, P. K., and R. J. Turner. 1980. Hydrogeology and Groundwater Conditions Related to Sea Cliff Stability on Self-Realization Fellowship Property, Encinitas. Unpublished report prepared for Self-Realization Fellowship. 15 pp.
San Diego Herald . 1855. 5 (1): 2, col. 4 (21 April 1855).
SCT Consultants. 1977. Report on Geotechnical Investigation Drell Residence, La Jolla, California. Unpublished report prepared for Dr. W. Drell. 14 pp.
Seymore, Richard. 1980–1982. Coastal Data Information Program . U. S. Army Corps of Engineers Monthly Report nos. 52–82.
Shaw, M. J. 1980. Artificial Sediment Transport and Structures in Coastal Southern California. Scripps Institution of Oceanography ref. no. 80–41. 109 pp.
Shepard, F. P. 1950. Longshore Current Observations in Southern California. Scripps Institution of Oceanography no. 456. U. S. Army Corps of Engineers Beach Erosion Board Technical Memo no. 13. 54 pp.
Shepard, F. P. and R. F. Dill. 1966. Submarine Canyons and Other Sea Valleys . Chicago: Rand McNally & Co. 381 pp.
Shepard, F. P., and U. S. Grant IV. 1947. Wave Erosion along the Southern California Coast. Bull. Geol. Soc. Amer . 58:919–926.
Shepard, F. P., and G. G. Kuhn. 1983. History of Sea Arches and Remnant Stacks of La Jolla, California, and Their Bearing on Similar Features Elsewhere. Marine Geology 51: 139–161.
Shepard, F. P., and H. R. Wanless. 1971. Our Changing Coastlines . New York: McGraw-Hill Book Co. 579 pp.
Shepardson Engineering Assoc. 1978. Investigation of Caisson Locations, Seascape Shores Condominiums, Solana Beach, California. Unpublished engineering geology study prepared for Seascape Shores Homeowners Assn., Project no. 710213. 2 pp.
Shumway, G., C. L. Hubbs, and J. R. Moriarty. 1961. Scripps Estates Site, San Diego, California: A La Jolla Site Dated 5460 to 7370 Years before the Present. Annals of the New York Acad. of Sci. 93:37–132.
Simkin, T., L. Siebert, L. McClelland, D. Bridge, C. Newhall, and J. H. Latter. 1981 Volcanoes of the World: A Regional Directory, Gazeteer and Chronology of Volcanism During the Last 10,000 Years . Stroudsburg, Pennsylvania: Hutchinson Ross Publishing Co. 232 pp.
Smythe, W. E. 1908. The History of San Diego, 1542–1908 . San Diego: The History Company.
Sorben, D. R., and K. L. Sherrod. 1977. Groundwater Occurrence in the Urban Environment, San Diego, California. In Geology of Southwestern San Diego County and Northwestern Baja, California , ed. G. T. Farrand, 67–74. Prepared for San Diego Assn. of Geologists.
State of California. 1967. Ground Water Occurrence and Quality, San Diego Region . 2 vols. Dept. of Water Resources Bull. 106-2. 235 pp.
Stommel, H., and E. Stommel. 1979. The Year without a Summer. Scientific American 240 (6): 176–186.
———. 1983. Volcano Weather: The Story of 1816, the Year Without a Summer . Newport, R. I.: Seven Seas Press. 177 pp.
Sumner, F. P., and J. W. Ross. 1930. Landslide Description. In Memorandum to Dr. T. W. Vaughan, S. I. O. Archives. 1 p.
TemBruggencate, J. 1983. Hurricane Iwa Hits Hawaii . Lubbock, Texas; C. F. Boone Publisher. 63 pp.
Troxell, H. C. et al. 1942. Floods of March 1938 in Southern California . U. S. Geol. Survey Water Supply Paper no. 844. 399 pp.
U. S. Army Corps of Engineers. 1976. Letter from T. L. Nishihara to D. H. R. Pain, 10 December 1976, regarding cliff and bluff retreat at the foot of Del Mar Ave., Sunset Cliffs, San Diego, California. 2 pp.
U. S. Coast and Geodetic Survey. 1889a . Descriptive report to accompany original field sheet entitled: Topography: Pacific Coast from San Onofre Creek to Horno Canon, California, Topo. Map no. T-2015. National Ocean Survey Archives, Washington, D. C. 4 pp.
———. 1889b . Descriptive report to accompany original field sheet entitled: Topography: Pacific Coast Southward from San Dieguito Valley, California, Topo. Map no. T-2014. National Ocean Survey Archives, Washington, D. C.
U. S. Congress. Senate. 33d Cong., 1st sess., S. Ex. Doc. pt. 3:111. National Archives, Washington, D. C.
U. S. Dept. of Agriculture. 1913. Monthly Weather Review [June 1912] 40 (6).
U. S. Signal Service. 1884a . Monthly Weather Review 12 (2):48–49.
———. 1884b . Monthly Weather Review 12 (6):146.
———. 1889. Monthly Weather Review 17 (10):279.
———. 1891. Monthly Weather Review 19 (8):188, 191.
Vaughan, T. W. 1932. Rate of Sea Cliff Recession on the Property of the Scripps Institution of Oceanography at La Jolla, California. Science 75: 250.
Wagner, A. J. 1980. The Circulation and Weather of 1979. Weatherwise 33 (1):4–9.
———. 1983. The Weather and Circulation of 1982. Weatherwise 36 (1):4–13.
Western Geophysical Co. of America. 1972. San Onofre Offshore Investigations. Prepared for So. Calif. Edison Co. and San Diego Gas and Electric Co., Amendment no. 11 to Preliminary Safety Analysis Report, San Onofre Nuclear Generating Station Unit no. 2 (docket #50-361) and no. 3 (docket #50-362).
Wexler, H. 1952. Volcanoes and World Climate. Scientific American 186 (4):74–80.
Woodward-Clyde Consultants. 1978. Geotechnical Evaluation of [Five] Potential Mainland California LNG Import Terminal Sites. Prepared for California Coastal Commission, 28 April 1978. 69 pp., appendixes A–L.
INDEX
A
Abbot, C., 14
Acknowledgments, VII
Aerosols, sulfur dioxide, 14 , 16 , 19
Agung:
cold wave preceding, 21 ;
floods, record tornadoes, and unusual storms following, 21
Alligator Head, collapse of arch at, 134 –135
Alluvial cliffs, 5 ;
periodic erosion of, 120 –127;
recent construction of concrete seawall along, 125 ;
renewed erosion of, 122 –127;
some unusual methods to stop erosion of, 122 –125
Anderson, Andy, 114
Arch, 10 ;
change in, 150 , 152 –153;
collapse of, 134 –135;
collapse of Cathedral Rock, 138 –139;
collapse of Windansea Rock, 139 –141;
little change in, 118 , 132
Arizona, destructive floods during February 1891 in, 34 , 36
Atcheson, Topeka and Santa Fe Company:
relocation of coastal route at Del Mar by, 102 –103, 105 ;
trains crashing to the beach during storms, 103
Averaged lowest volcanic periods, tables showing comparison with posteruptive periods and, 25
B
Bada, J., 127
Ballast Point (Punta de los Guijarros; Cobblestone Point), 155 ;
first smog in San Diego at, 155
Bandai San volcano, 22
Barrier beaches, 5 , 127 , 143
Bathtub Rock, 110 –111
Batiquitos Lagoon, artificial opening of, 4
Bear Valley, north of San Diego, record rainfall of February 1891 at, 36
Berggreen, R., 43
Big cone spruce trees, tree rings from, 12
Bird Rock, cliff collapse of, 141
Blacks Beach:
landslides along, 112 –113;
removal of talus debris by storms in December 1940 at, 112
Boomer Beach, seasonal changes at, 136 –137
Brewer, W., 31
C
California, destructive floods during February 1891 in, 34 ;
great 1862 flood in, 32
California Coastal Commission, 121
California Southern Railroad:
bankruptcy in 1884 of, 3 ;
1889 mining of cobbles at barrier across Penasquitos Lagoon by, 109 ;
surveys between 1880–1891 along, 70
Campo, east of San Diego, world record rainfall 12 August 1891 at, 36
Camp Pendleton, 5 ;
construction of military harbor at, 55
Cape Horn, comparison of severe storm with those reported along Southern California with, 29
Cardiff-by-the-Sea:
collapse of highway 101 at, 92 –93;
location of, 68 ;
1983 damage to restaurants by waves, cobbles and riprap at, 94 –95;
precarious existence of restaurant row at, 94 –95;
riprap rock scattered by waves at, 92 –93
Cardiff State Park, erosion of cliff around stairways at, 85
Carlsbad:
failure of sand to return to beach during summer of 1980 at, 62 ;
location of, 50 ;
1983 destruction of restroom facilities by waves at, 67 ;
1983 rapid beach erosion at, 66 –67;
nonmarine terrace at, 51 ;
storm drain collapse and erosion of bluffs at, 64 –65
Carlsbad Submarine Canyon, 41 ;
interception of sand by, 63
Casa Pool (Childrens Pool), La Jolla, inadequate jetty construction at, 137 ;
recent storm effects at, 137
Cathedral Rock, collapse of, 138 –139
Catholic Missions, records of, 14
Caves:
collapse of, 150 ;
deep reentry, 118 –119;
recent, 10
Caves and Sea Arches, formation and collapse of, 71 –81
Chile, El Niño along, 19 ;
abnormally warm water along, 20
China, great flood during 1982 in, 18
Christianitos Fault, near the San Onofre nuclear power plant, 43
Chubascos, windstorms largely centered along northwest Mexico called, 29
Climate change, 13
Coastal area description, 3
Coastal cliffs and canyon erosion, nature of, 44 –46
Coastal history, description of in geographical sequence, 39 –164
Cobble abrasion:
damage to buildings as a result of, 94 –95;
damage to highway by, 108 –109;
1983 erosion of bluffs at Scripps Institution of Oceanography by, 125 ;
observed enlargement and collapse by, 78 –79;
rapid erosion of sea caves by, 76 –78;
recent damage at Oceanside by, 59 –61
Cobble barrier:
description of, 109 ;
mining of, 109 ;
1983 destruction of coastal highway by, 108 –109
Cobble Beaches, 56 –57;
movement of, 59 –62, 76 –78, 94 –95
Collapse of Highway 101 at Cardiff-by-the-Sea, 92 –93
Colorado, record snowstorm of 1982 in, 19
Conclusions, 165 –168
Conclusions concerning characteristics of pre-volcanic, post-volcanic, and low-volcanic periods, 28
Concretionary rock forming a dike, 127
Construction of bluff tops, 71 –76
Converse, Davis and Associates, 43
Coronado and Imperial Beach, 156 –164;
location of, 156
Coronado Islands, U.S., 5 ;
location of, 156 ;
longshore currents of, 6 ;
history of, 157
Coroner reports, county, 10
Cottonwood Creek, Encinitas (Moonlight Beach), erosion at mouth of, 34
County tax assessor, records of, 10 , 34
Cove beaches, coarse sand derived from local sandstones as source of, 119
Crown Point, 143
Cuyamaca, record rainfall of February 1891 at, 36
D
Dana Point, 41
Dana, R., 29
Dangerous location of U.S. Fisheries and Wildlife building and Scripps IGPP building, 114 –115
Data Analysis, 24
Dead Dog Canyon, Camp Pendleton, rapid canyon cutting at, 49
Del Mar:
alteration of bluff by railroad at, 102 –103;
coastal canyon erosion and lagoon siltation at, 102 –103;
destruction of sand-filled tube on the beach at, 101 ;
extensive erosion of beach in 1978 and 1980 at, 100 –101;
glass-enclosed wading pool constructed at foot of 10th Street in, 100 –101;
iron oxide surface cementation of terrace sands at, 97 ;
location of, 97 ;
1983 storm damage along, 101 ;
1979 summer cliff failures as a result of groundwater at, 104 –105;
relocation of railroad at, 101 –102, 105 ;
replenishment of beach sand at, 101 ;
sand transport direction change at, 101
Derby, G., 147
E
Earthquakes, documentation of, 11
Earth's temperature, lowering of, 14
Eastern Pacific Ocean, abnormally warm water along, 20
Ehlig, P., 43
El Capitan Dam, 147
El Chichon:
cold wave preceding, 20 ;
eruption of Mexican volcano, 16 ;
record tornadoes following eruption of, 21
Ellen Scripps, 111
El Niños, fish fauna changes during, 20 ;
great ones following major volcanic eruptions, 20
Emery, K., IX , 10 , 12 , 57 , 127
Encinitas, California:
attempt to reprovision settlers at, 33 ;
coastal changes at, 35 ;
destruction along old Cottonwood Creek (Moonlight Beach) at, 70 ;
flooding near, 33 ;
location of, 68 ;
purchase of land at, 70 ;
record rain on 12 October 1889 at, 34 , 70 ;
stairway collapse in 1978 at, 82 –85
Erosion acceleration caused by man, 46 –49
Explosive volcanic eruptions, weather alterations from, 14 –28
F
False Bay. See Mission Bay
Fish Fauna changes due to El Niños, 20
Flood Period:
of 1884–1891, 32 –37;
of 1916, 37 –38;
1862, 31 –32
Floods, documentation of, 11 , 31 –38
Frautschy, J., 115
French Polynesia, great hurricanes of 1982 in, 19
Fugro, Inc., 43
G
Goldfish Point, arch at, 118 , 132
Great flood period of 1862, 31 –32
Great floods of nineteenth century, 31 –37
Great waves off Southern California in 1830's compared with those off Cape Horn, 29
Great windstorms of the nineteenth century, 29
Greene, G., 43
Griggs, R., 14
Groundwater table:
blockfalls caused by rise in, 72 ;
causes of rise in, 71 ;
importance of, 71 ;
landslide caused by rise in, 72 ;
rise in, 71 , 87
Gulf of Alaska, abnormally warm water along, 20
H
Hales, L., 52 , 55
Hanna, M., 115 , 121
Hannan, D., 127
Hardy, W., 21
Hatfield, C., extraordinary rainmaker, 38
Hayes, B., 109
Hayes, J., 31 , 145
Hidden Valley, old lagoon at mouth of, 117 , 126
Highway 101, alteration of drainage patterns due to installation of culverts under, 46
Honshu, Japan, great flood of 1982 in, 18
Horno Canyon, Camp Pendleton, rapid erosion at, 47
Hotel Del Coronado:
construction of, 159 ;
rapid erosion along ocean boulevard at, 159 –160;
recent construction of large condominiums south of, 156 , 161
Humphreys, W., 14
Hunt, G., 43
Huntington Beach, California, flood of 1862 at, 32
Huntington, E., 14
I
Imperial Beach, artificial nourishing of beach by dredging at, 163 ;
erosion of, 163 –164;
longshore currents of, 6
Infrequent floods of the early twentieth century, 37
Inman, D., 40 , 53 , 55 , 157 , 162 –163
Institute of Geophysics and Planetary Physics (IGPP), 115
International border between United States and Mexico, 157
Interstate highway #5, alteration of drainage patterns due to installation of culverts under, 46
J
Judge, Hayes, Benjamin, description of great cobble barrier across mouth of Penasquitos Lagoon given by, 109
Junipero Serra, San Diego founded by, 144
K
Katmai volcano:
drop in temperature, increase in storminess with arrival of dry fog follow eruption of, 22 ;
further unseasonable alternation of warm and cold periods following eruption of, 22 ;
record cold weather preceding, 22 ;
worldwide dry fog (haze) reported almost immediately following eruption of, 27 ;
year without a summer following eruption of, 22
Kauai, Hawaii, great hurricane in 1982 along, 18
Kennedy, M., 43 , 149
Kentucky, floods of 1982 in, 18
Kimball, H., 22
Krakatoa volcano:
cold and stormy period preceding eruption of, 23 ;
great floods in lower Mississippi Valley following eruption of, 24 ;
great floods in Southern California following eruption of, 24 ;
record tornadoes following eruption of, 24 ;
summer killing frost reported following eruption of, 24 ;
unusual sunsets following eruption of, 23 ;
weather conditions following, 15 , 70
L
La Jolla, 10 , 107 ;
possible solution origin of sandstone caves at, 132 ;
sea surface at, 12 , 116 –118;
wave cut terrace at, 116 –117, 131
La Jolla Beach and Tennis Club, 117
La Jolla Cove, 119 ;
concretions near, 133 , 135
La Jolla Farms area, drell landslide along, 113
La Jolla Shores, 127 –128
La Jolla submarine canyon, 128 –129
La Jolla Terrace, 143
Lamb, H., 14
La Nacion Fault, 109
Le Comte, D., 20
Lee, L., IX
Legg, M., 43
Leighton and Associates, 112
Leucadia:
cave roof collapse at, 77 ;
formation of caves at, 77 ;
location of, 68 ;
loss of stairways at, 82 –83;
rapid erosion of cliff in 1983 at, 77
Leucadia South through Solana Beach, 69 –95;
description of area along, 69
Libby and Associates, 79
Literature:
historical, 11 ;
scientific, 11
Littoral cells, in relation to submarine canyons along Southern California coast, 10
Location map:
area of Coronado and Imperial Beach shown on, 156 ;
area of Del Mar and vicinity shown on, 96 ;
area of Leucadia, Encinitas, Cardiff-by-the-Sea and Solana Beach
shown on, 62 ;
area of Ocean Beach, Sunset Cliffs, and Point Loma shown on, 148 ;
area of Pacific Beach, Mission Beach, San Diego Bay and river shown on, 142 ;
area of San Onofre State Park and Camp Pendleton shown on, 42 ;
area of Santa Margarita River south through Oceanside and Carlsbad shown on, 50 ;
area of Sorrento Valley South through North La Jolla shown on, 106 ;
area of study shown on, 1
Logs of vessels, sea storms recorded in, 11 , 14
Longshore currents, 5 , 63 , 163
Longshore transport direction, 49 , 163
Los Angeles Plains, extensive flooding in 1862 of, 31
Los Angeles River, merging in 1862 of, 32
Lower Otay Dam, San Diego, break in January 1916 of, 38
Low volcanic periods, 17 , 27
Ludlum, D., 20
M
McGlashan, H., 32 , 38 , 99
Marine advisors, 55
Marine Biology Building, Scripps Institution of Oceanography:
concrete seawall constructed in front of, 127 ;
erosion under, 127
Marine Room Restaurant, damage by storms at, 128 –129
Marine Street, La Jolla, erosion by large waves at, 141
Mass, C., 17
Masters, P., 109 , 111
Mauna Loa Observatory, observation of gases from El Chichon Volcano at, 16
Methods of study, 9
Mission Bay, 143 ;
changes in, 144 –145, 147 ;
former name "False Bay," 144 ;
former use for sea–going vessels in, 144 ;
jetties constructed at, 147
Mission Beach, 143 ;
changes in, 144
Mission San Diego de Alcala, 144
Mission Valley, San Diego:
floods of, 31 ;
flood of February 1891 in, 36 ;
great flood in 1916 at, 38
Mississippi Valley, major flood of 1982 in, 19
Moore, G., 114 –115
Mount Soledad:
fault at base of, 7 ;
Rose Canyon fault scarp continuation of, 131 –132
Multi-eruptions of the late 1880's:
curious relationships of abrupt weather changes to, 23 ;
record violent windstorms, floods, and tornadoes following, 23
N
National Marine Fisheries, 114 –115;
landslides at, 114 –115;
seaward movement of landslide related to distant earthquakes at, 115
Nature of coastal cliffs and canyon erosion, 44
Net longshore drift, showing balancing of, 49
Newport, California, damage by great tropical storm at, 29 –30
Newton, C., 44
"Noachian Deluge," great flood of 1862 called, 31 , 147
Northeastern United States, cold weather conditions following 1815 Tambora eruption reported in, 15
Northern San Diego County:
cliff stairway collapse along, 19 ;
rapid retreat along, 19 ;
sea cave formation along, 19
O
Oceanside, California, 5 , 10 , 150 ;
aerial view showing decrease of beach width south of harbor at, 54 ;
beach cobbles thrown by waves against houses at, 59 –61, 150 ;
change in direction of longshore currents at, 63 ;
collapse of beach road at, 58 –59;
construction of city harbor at, 55 ;
construction of military harbor directly north of, 55 ;
damage to houses in 1940–1941 at, 52 –53;
development and destruction of coastal wharf at, 52 ;
location of, 50 ;
loss of beaches due to harbor construction at, 55 ;
movement of cobbles along beach at, 61 ;
recreational pier at, 52 ;
subaerial erosion of cliffs at, 50 –51;
30 foot terrace at, 51 ;
wide beach at, 50 –51
Oceanside littoral cell, location of, 40 –41
Old charts, 10
Old coastal changes, 35 , 70 –71
Old land surveys, 10
Old railroad surveys, 10
Old Town (San Diego), 143 ;
flooding at, 147
P
Pacific Beach and Mission Beach, San Diego Bay and River, 143 –147
Palomar Mountain, 1884 cloudburst at, 33
Penasquitos Lagoon, 107
Peru, El Niño along, 19
Phillips, D., 20
Phreatic eruptions, major, showing comparison of six-month period preceding, 26
Point La Jolla, 3 , 5 , 29 , 114 , 117 ;
deeply penetrating caves at, 118 , 132 ;
sea arches and stacks at, 132
Point Loma, 143 , 147 , 149 , 155 ;
location of, 148
Port San Luis, sea cliff at, 8 –9, 11
Post, J., 15
Post-volcanic periods, 17
Pourade, R., 38 , 144 , 147
Punta de los Guijarros. See Ballast Point
R
Rainfall, documentation of, 11 ;
Julian, 12
Rampino, M., 14
Revelle, R., 141
Rip currents, 130 –131
Rodrequis Flood Control Dam, 163
Rodriquez Cabrillo, 144
Rose Canyon Fault Zone, 131
Rose, W., 16 –17
S
Sacramento, California, submerged in 1862 floodwaters in, 31
Sacramento Valley, California, great flood of 1862 in, 31
Saint, P., 89 –91
San Bernardino, 1884 flooding of railroad line at, 33
Sand bars, formation by rapid canyon cutting and, 48 –49
San Diego:
flood of 1884 in, 33 , 70 , 144 ;
flood of 1862 in, 32 , 144 ;
great flood of 1916 at, 38 ;
history of, 144 ;
minor flood of 20th century at, 38 ;
record rainfall at, 34
San Diego Bay, 5 , 157 , 164
San Diego County:
climate changes in, 13 ;
great storms reported along, 15 ;
record flood of, 15 ;
record rainfall in, 19 ;
record rainfall levels in, 32 –33;
report of storms in, 33 ;
warm water along, 20
San Diego County Tax Assessor records, showing changes in value between 1889–1890 during stormy period in, 34 –35, 70
San Diego Harbor:
dredging of, 159 ;
erosion and stabilization of entrance at, 159 ;
history of, 144 –146;
new channel cut in 1862 at, 32
San Diego Herald, 147
San Diego River, changes at mouth of, 144 ;
delta of, 142 –143, 147 , 149 ;
El Capitan Dam constructed on, 147 ;
flood of 1884, 1889, and 1891 on, 144 ;
flood of 1862 on, 31 –32, 144 ;
jetties constructed at mouth of, 147 –149
San Diego Union, flood of 1884 reported in, 109 ;
report of cloudburst in, 33
San Diegueno Indians, 109
San Dieguito River Flood Plain, 98 –100;
dams located above, 98 –99;
Del Mar Race Track located on, 98 –99;
1938 flood along, 99 ;
1980 flood along, 98 –99
Sand return failure to beaches during summer 1980, 63 –67
Sandstone caves, possible solution origin of, 132
San Francisco, 31
San Gabriel River, merging in 1862 of, 32
San Joaquin Valley, California, great flood of 1862 in, 31
San Luis Rey River, Oceanside, 51 ;
cobbles derived from floods of, 55 ;
Lake Henshaw dam along, 52
San Onofre, 5 ;
debris fans at, 46 ;
formation of sand bars at, 49 ;
1941 landslide at, 44 –45;
1978 landslide at, 45 ;
nuclear power plant at, 41 ;
rapid canyon cutting at, 47 –48;
state park at, 41 ;
unusual formation of beach during winter 1983 at, 48
San Onofre and Camp Pendleton area, 41 –49;
location of, 42
Santa Ana River, merging in 1862 of, 32
Santa Barbara Basin, varves of, 12
Santa Barbara, California, great coastal flood of 1862 at, 31
Santa Catalina Island, 33
Santa Margarita Ranch, Oceanside, extremely heavy rainfall at, 33
Santa Margarita River, Oceanside, 51
Santa Margarita River South through Oceanside and Carlsbad, 51 –67
Scripps Institution of Oceanography, 5 , 112 , 114 , 129 ;
alluvial cliffs near, 121 –127;
erosion of rock platform between 1940–1979 north of, 130 –131;
Institute of Geophysics and Planetary Physics at, 115 ;
precarious location of Marine Biology Building at, 126 –127;
unprotected section of cliff at, 125
Scripps submarine canyon, 128 –129
SCT Consultants, 113
Sea Cave, 5 , 10
Self Realization Fellowship, Encinitas:
collapse of temple at, 86 –87;
erosion history of, 87 –91;
groundwater level rise at, 87 ;
1980 landslide as a result of grading the bluff at, 90 –91;
1978 landslide at, 88 –89;
sheet plastic placed on bluff face to slow erosion at, 91 ;
subsurface groundwater movement at, 90
Seymore, R., 49
Shaw, M., 55 , 159
Shepardson Engineering Associates, 79
Shumway, G., 127
Siberia:
1979 record cold before Soufriere in, 20 ;
warm weather following Tambora in, 15
Signal Hill, California, flood of 1862 at, 32
Silver Strand Littoral Cell, 157 , 162 ;
accretion area along, 157 ;
location of, 6 , 162 ;
source of sediment along, 157
Simkin, T., 20 –21
Smithsonian Institution, 24
Solana Beach:
damage to stairway at, 85 ;
development and collapse of an arch in a few days at, 80 –81;
location of, 68 ;
possible solution origin of sandstone caves at, 132 ;
stairway that survived 1983 storms at, 84
Solana Beach (South):
caves of, 10 ;
construction along bluff top at, 73 ;
construction and collapse of crib wall at, 73 –74;
construction of concrete seawall at, 73 , 75 ;
enlargement and collapse of caves at, 78 , 79 ;
erosion of cliff base at, 73 ;
previously unrecognized ancient river channel at, 73 ;
solution origin of subsurface cave in sandstone at, 79 ;
subsurface cavern directly inland of the cliff at, 79 ;
tunnels in sea cliff at, 79
Soledad Mountain, 149 . See also Mount Soledad
Sorben, D., 71 ;
relation of over irrigation to groundwater indicated by, 71 , 166
Sorrento Valley, 3 , 107 ;
1884 flood and landslides in, 109 ;
history of the lower reaches of, 109 ;
1938 flood in,
109 ;
partial destruction of road by cobbles during storms of 1983 at, 108 –109;
possible structural control of, 109 ;
recent development in, 109 ;
San Diegueno Indian occupation around, 109
Sorrento Valley South through North La Jolla, high cliff of, 107 –116
Soufriere Volcano:
abundance of tornadoes in United States following eruption of, 20 ;
cold wave preceding, 20 ;
1979 eruption of, 20 ;
record rains in France and England following, 20 ;
terrible drought following eruption of, 20
Southern California:
changes in river mouths in, 144 ;
cold June in, 18 ;
flood of 1938 in, 52 ;
great flood of 1862 in, 31 ;
great flood of February 1891 in, 36 ;
storms of 1940–1941 along, 52 ;
unusual storms during winters of 1884, 1886, 1889, 1890, 1891 in, 32 –33;
weather changes along, 15 ;
windstorms along, 29
Southern hemisphere, terrible drought in, 20
Spanish Bight, 159
Stairways to beach, loss of, 82 –85
State of California:
bankruptcy in 1862 of, 31 ;
Department of Water Resources, 99
Stommel, H., 15
Submarine canyons off La Jolla:
relation to breakers along the shore by, 128 –131;
rip currents related to heads of, 130 –131
Sumner, F., 112
Sunset Cliffs, 149 ;
recent rapid erosion of, 150 –154;
slumping of cliff edge at, 150 , 154
Sunset Cliffs and Point Loma, 149 –155
Sweetwater Dam, San Diego, break in January 1916 of, 37 –38; See also Hatfield, C.
T
Tambora Volcano, cold weather conditions following, 15
Target Canyon, Camp Pendleton, 43
Tennessee, floods in, 18
Terraces:
low rock, 10 ;
termination of, 51 ;
tide pools and concretions of, 10
Tijuana, Mexico, recent erosion of beach at, 162 –163
Tijuana River, 157 ;
spit produced by, 157
Tijuana River Basins:
dams constructed along, 163 ;
effects of, 163
Torrey Pines City Beach, landslides along, 112 . See also Blacks Beach
Torrey Pines State Preserve, 111 ;
landslides along, 110 –111
Torrey Pine tree, unreliable ring in, 13
Trade winds, reversal of, 19
Tree rings, 12 –14
U
Upper part of Mississippi Valley, great flood in, 18
U.S. Army Corps of Engineers:
study by 44, 150 ;
wave study for, 55
U.S. Army Signal Corps, monthly weather review of, 10 , 15 , 36
U.S. Army Signal Service, weather records of, 16 , 24 , 70
U.S. Coast and Geodetic Survey;
charts of, 10 , 147 ;
coastal mapping by, 70 , 111 ;
description by, 51 ;
mapping in 1889 by, 34 ;
studies by, 44
U.S. Congress, 144
U.S. Department of Agriculture, weather records of, 16 , 22
U.S. Weather Bureau:
scientists of, 14 ;
weather records of, 16
V
Varves, Santa Barbara Basin, 12
Vaughan, T., 115 , 121
Ventura, California, destruction by flood in 1862 of, 31
Volcanic activity, documentation of, 11
Volcanic gases, 14
W
Wagner, A., 19 , 20
Walter Munk, 115
Wave cut terrace, 131
Weather changes preceding eruptions, 17
West Coast of South America, great floods along, 19
West Coast of United States, heavy rains along, 18 , 31 ;
windstorms along, 18
Western Geophysical Company of America, 43
Wexler, H., 14
Wide beach, formerly used as major highway for horse-drawn vehicles to Los Angeles on, 50 –51
Windansea Beach:
collapse of arch at, 139 –141;
recent sea cliff retreat near, 141 ;
seasonal sand changes at, 141
Windstorms, documentation of, 11
Woods Hole Oceanographic Institution, scientists from, 15
Woodward-Clyde Consultants, 43
Y
Yuma, Colorado, river flood twenty miles wide in late February 1891 at, 36
Z
Zuniga Jetty:
construction of, 159 ;
currents near, 163
Zuniga Jetty and the building of the Hotel Del Coronado, 159 –161
Zuniga Shoal, 157 , 163
Preferred Citation: Kuhn, Gerald G., and Francis P. Shepard Sea Cliffs, Beaches, and Coastal Valleys of San Diego County: Some Amazing Histories and Some Horrifying Implications. Berkeley: University of California Press, c1984 1984. http://ark.cdlib.org/ark:/13030/ft0h4nb01z/