The Indian Ocean
The Water Masses of the Indian Ocean. Oceanographically, the southern limit of the Indian Ocean can be placed in the region of the Subtropical Convergence, according to which definition the Indian Ocean extends to approximately lat. 40°S. The ocean is closed toward the north and all the water masses in the upper layers are therefore such as are characteristic of the middle latitudes and the equatorial regions. No subpolar water mass enters the Indian Ocean. A considerable number of oceanographic stations have recently been occupied in the equatorial areas of the Indian Ocean by the Dana, Snellius, and John Murray Expeditions, but as yet most of the data from the two latter are not available. The Discovery expeditions have occupied many stations along the African east coast and off South Africa, and a few to the south and southwest of Australia, but no accurate observations are available from the entire central and southern part of the Indian Ocean except a few from the Planet Expedition in 1906. Any discussion of the types of water in the Indian Ocean must therefore be of a preliminary character and the classification given here will have to be subject to future corrections.
Within the surface waters the temperature increases rapidly toward the north from the Subtropical Convergence and, in the equatorial regions, it is uniformly high during the greater part of the year, between 25° and 29°. In August lower temperatures, down to 22°, are found along the southeast coast of Arabia and the east coast of Africa as far south as to the Equator, in consequence of the upwelling under the influence of the prevailing southwest monsoon. In February lower temperatures are similarly found in the Gulf of Oman and the Bay of Bengal in consequence of the effect of the northwest monsoon. The salinity of the surface waters shows, to the west of Australia, the common subtropical maximum, and in the equatorial and northern regions is subject to considerable annual variations which are related to the changing monsoons and the annual variation in the precipitation (see chart VI).
At subsurface depths three larger water masses can be shown to exist, the Indian Ocean Central Water and the Indian Ocean Equatorial Water, both of which extend to moderate depths, and the deep water, present below a depth of roughly 2000 m. Transition types are found and, furthermore, two types of water spread at mid-depths, the Antarctic Intermediate Water and the Red Sea Water.
In the inset map in fig. 189 are shown the approximate regions in which the Central Water mass and the Equatorial Water mass are found. Within the area of the Central Water mass seven widely separated stations have been selected, as indicated in the figure. The temperature-salinity relation at these stations is shown in fig. 189 (left), from which it is evident that nearly all the observed temperatures and salinities fall on a straight line between the points T = 8°, S = 34.60‰, and T = 15°, S = 35.50 ‰. A remarkable agreement exists between such widely separated stations as Discovery 427 off Port Elizabeth in South Africa and B.A.E. 75 (Howard, 1940) to the southwest of Australia, and between the latter station and Dana station 3938 to the northwest of Madagascar. The deeper values from Dana station 3938 deviate, however, showing higher salinities that indicate presence of Red Sea water. Traces of this water are also found at Dana station 3960 to the south of Madagascar. The southern limit of the Central Water mass coincides with the approximate location of the Subtropical Convergence. In the region of the convergence the surface temperature and salinity vary rapidly with latitude, and the horizontal T-S relation in that region in certain seasons agrees very well with the vertical T-S relation between depths of approximately 100 m and 800 m within the Central Water mass. It is therefore probable that this water mass has been formed by sinking’ at the Subtropical Convergence. The northern limit of the Central Water mass cannot be determined, owing to lack of observations.
The Equatorial Water of the Indian Ocean is not so well-defined as the Central Water, but at most stations to the north of the Equator a considerable
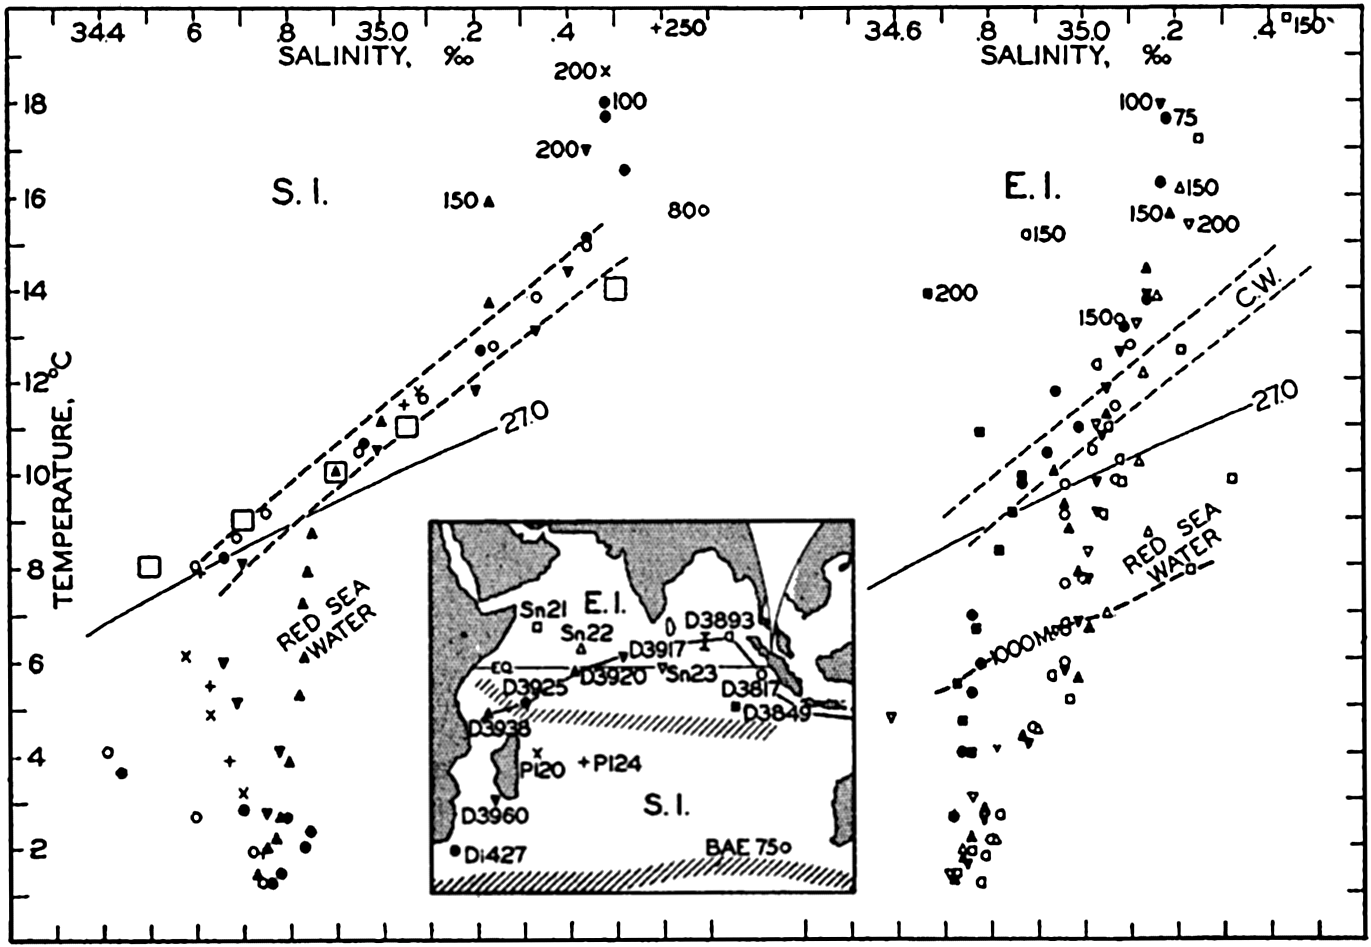
Temperature-salinity relations in the Indian Ocean. The depths of the shallowest values are indicated. Large squares represent winter surface values in the region of the subtropical convergence. Inset map shows locations of stations used and boundaries of water masses. Abbreviations: Sn, Snellius; D, Dana; Di, Discovery; P, Planet; BAE, B.A.N.Z. Expedition; E.I., Equatorial Indian Ocean; S.I.. South Indian Ocean.
[Full Size]
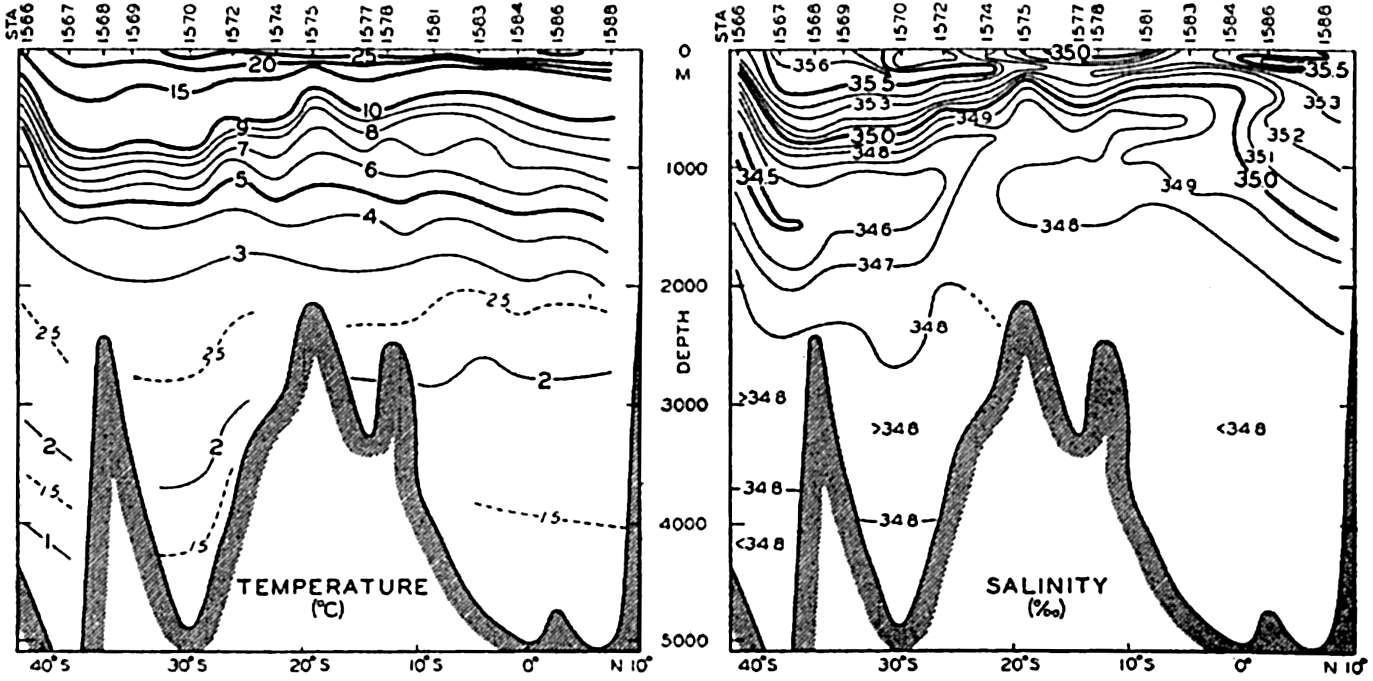
The spreading of the Red Sea water in the Indian Ocean is probably similar to that of the Mediterranean water in the Atlantic Ocean, but owing to lack of data it is impossible to carry out a detailed analysis comparable to that of the Mediterranean component made by Wüst (1935). Repeated observations at the same stations in the Gulf of Aden have given very different salinity values, a condition which strongly indicates that the outflow is intermittent. A seasonal variation in the outflow appears to be well established, but great year-to-year differences may also occur and such fluctuations complicate the conditions at greater distances. The best idea of the spreading of the Red Sea water is obtained from a Discovery section parallel to the African east coast, the location of which is shown in the inset map, fig. 192 (p. 697). The distributions of temperature, salinity, and oxygen in this section have been discussed by Clowes and Deacon (1935), from whose paper fig. 190 and fig. 192 have been reproduced. Figure 190 shows the Red Sea water penetrating as a tongue of water of high salinity, which sinks from a depth of about 500 m at station 1588 in lat. 8°N (see fig. 192) to a depth of about 1250 m south of lat. 20°S between southern Madagascar and the mainland. This water has a low oxygen content, as is evident from fig. 192. Clowes and Deacon draw attention to the fact that the oxygen distribution indicates a further penetration of the Red Sea water to the south, such that the last traces of this water may possibly be present in lat. 40°S.
The Discovery section off the African east coast is the only longituibeal section that can be constructed in the Indian Ocean by means of redinall
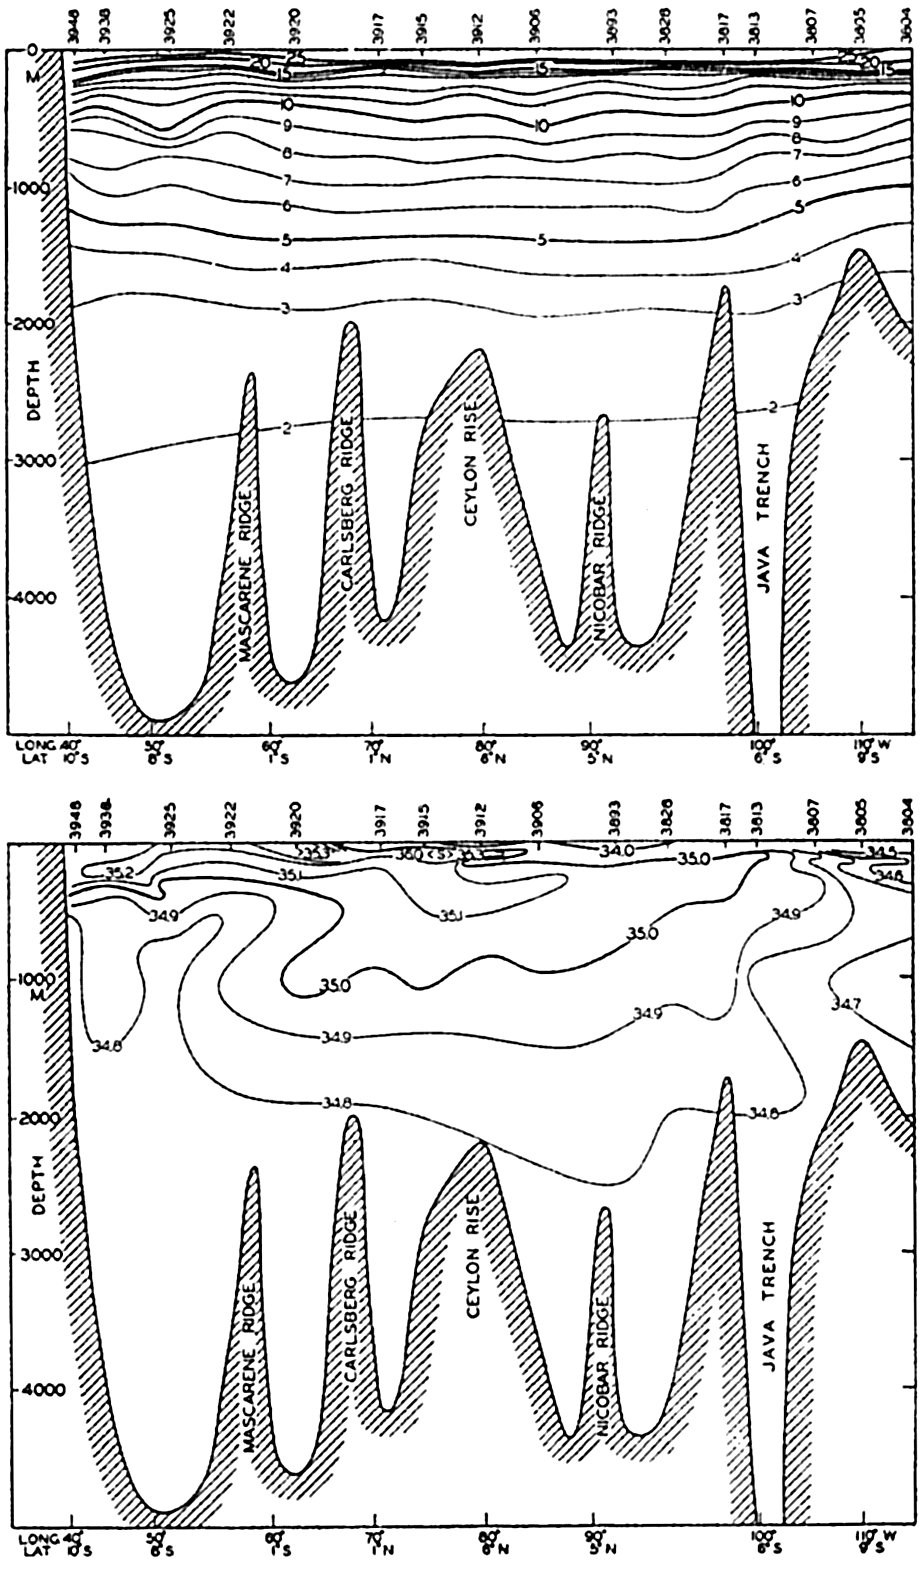
An approximately east-west section in the equatorial regions has been constructed by means of Dana observations, using stations along line I in fig. 189. The section follows the coasts of Java and Sumatra, crosses the Bay of Bengal, and runs in a south-southeasterly direction from Ceylon to Cape Delgado on the coast of east Africa in lat. 10°S, lying to
The surface salinity is below 35.00 ‰ except to the west of long. 70°E, but a subsurface salinity maximum is present over a large part of the section, the maximum being found near the upper limit of the sharp thermocline, as was the case in the Atlantic Ocean. In the Indian Ocean this high-salinity surface water appears to come from the Arabian Sea.
Below the salinity maximum the salinity gradually decreases with increasing depth, until the nearly constant value for the deep water of about 34.76‰ is reached between depths of 2500 and 3000 m; but to the right in the section, low-salinity water is present that probably comes from the Pacific Ocean where water of similar characteristics is found (p. 707). The Red Sea water is not very conspicuous. To the extreme left it is shown by the downward bend of the 34.8 isohaline and by the greater distance between the 8° and 7° isotherms.
In the middle part of the section the equatorial water is present, the bulk of which has a temperature below 10° and a salinity less than 35.10‰. This water probably contains some admixture of Red Sea water but mainly it is formed and maintained by slow processes of mixing between the high-salinity water from the Arabian Sea and the deep water; the origin of the latter will be discussed when dealing with the deep-water circulation of the oceans.
The Currents of the Indian Ocean. In the southern part of the Indian Ocean a great anticyclonic system of currents appears to prevail, comparable to the corresponding systems of the South and North Atlantic Ocean except that it is subjected to greater annual variations. Between South Africa and Australia the current is directed in general from west to east. In the southern summer the current bends north before reaching the Australian Continent and is joined by a current which flows from the Pacific to the Indian Ocean to the south of Australia. In winter the current appears to reach to Australia and in part to continue towards the Pacific along the Australian south coast. To the north of 20°S the South Equatorial Current flows from east to west, reaching its greatest velocity
In both seasons of the year part of the South Equatorial Current turns south along the east coast of Africa, feeding the strong Agulhas Stream. To the south of lat. 30°S the Agulhas Stream is a well-defined and narrow current which extends to a distance from the coast of less than 100 km. As is to be expected in a flow towards the south in the Southern Hemisphere, the coldest water is found inshore and the sea surface rises when departing from the coast. Off Port Elizabeth the rise amounts to about 29 cm in a distance of about 110 km (Dietrich, 1936). To the south of South Africa the greater volume of the waters of the Agulhas Stream bends sharply to the south and then toward the east, thus returning to the Indian Ocean by joining the flow from South Africa toward Australia across the southern part of that ocean, but a small portion of the Agulhas Stream water appears to continue into the Atlantic Ocean (Dietrich, 1935). Owing to the reversal of the direction of the main current to the south of Africa, numerous eddies develop, resulting in a highly complicated system of surface currents which probably is subjected to considerable variations during the year and variations from one year to another.
To the north of lat. 10°S the surface currents of the Indian Ocean, which are probably nearly identical with the currents above the tropical discontinuity surface, vary greatly from winter to summer owing to the different character of the prevailing winds. During February and March when the northwest monsoon prevails, the North Equatorial Current is well developed and an Equatorial Countercurrent is present with its axis in approximately 7°S. Along the African east coast between the Gulf of Aden and lat. 5°S the current is directed towards the south. In August–September when the southwest monsoon blows, the North Equatorial Current disappears and is replaced by the Monsoon Current, which flows from west to east. Along the coast of east Africa the current is directed north from lat. 10°S, water of the Equatorial Current crosses the Equator, and considerable upwelling takes place off the Somali coast. The Equatorial Countercurrent does not appear to be present in this season.
At present nothing is known as to the motion of the water below the tropical discontinuity in the northern part of the Indian Ocean. The character of the water, together with the very low oxygen values which are found to the north of the Equator, indicates that no strong currents exist and that only a sluggish flow takes place.
In the southern part of the Indian Ocean the Antarctic Intermediate Water probably flows north, but the flow must be less well-defined than the corresponding flow in the South Atlantic Ocean, because in the Indian Ocean the Antarctic Intermediate Water loses its typical characteristics on a shorter distance from the Antarctic Convergence (Sverdrup, 1940). The probable flow of the deep water will be discussed later on.
The data from the Indian Ocean are too scanty to permit many quantitative calculations as to the amount of water carried by the different branches of the current. The only reliable figure which is available is found in Dietrich's study of the Agulhas Stream, which transports a little more than 20 million m3/sec. A transport map similar to the one for the North Atlantic Ocean cannot be constructed.
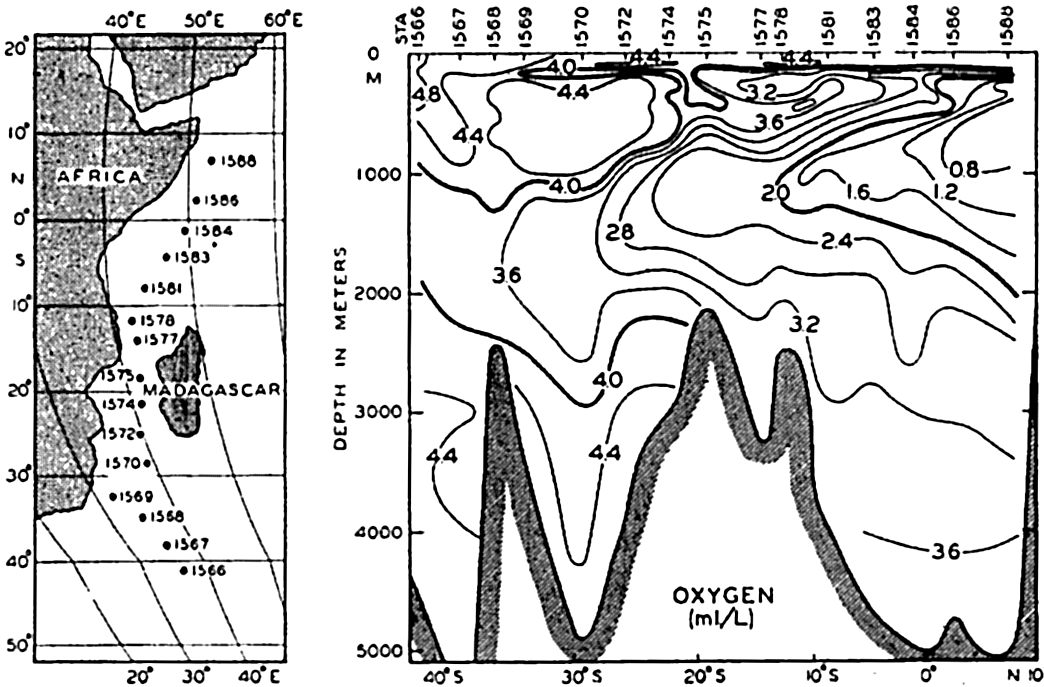
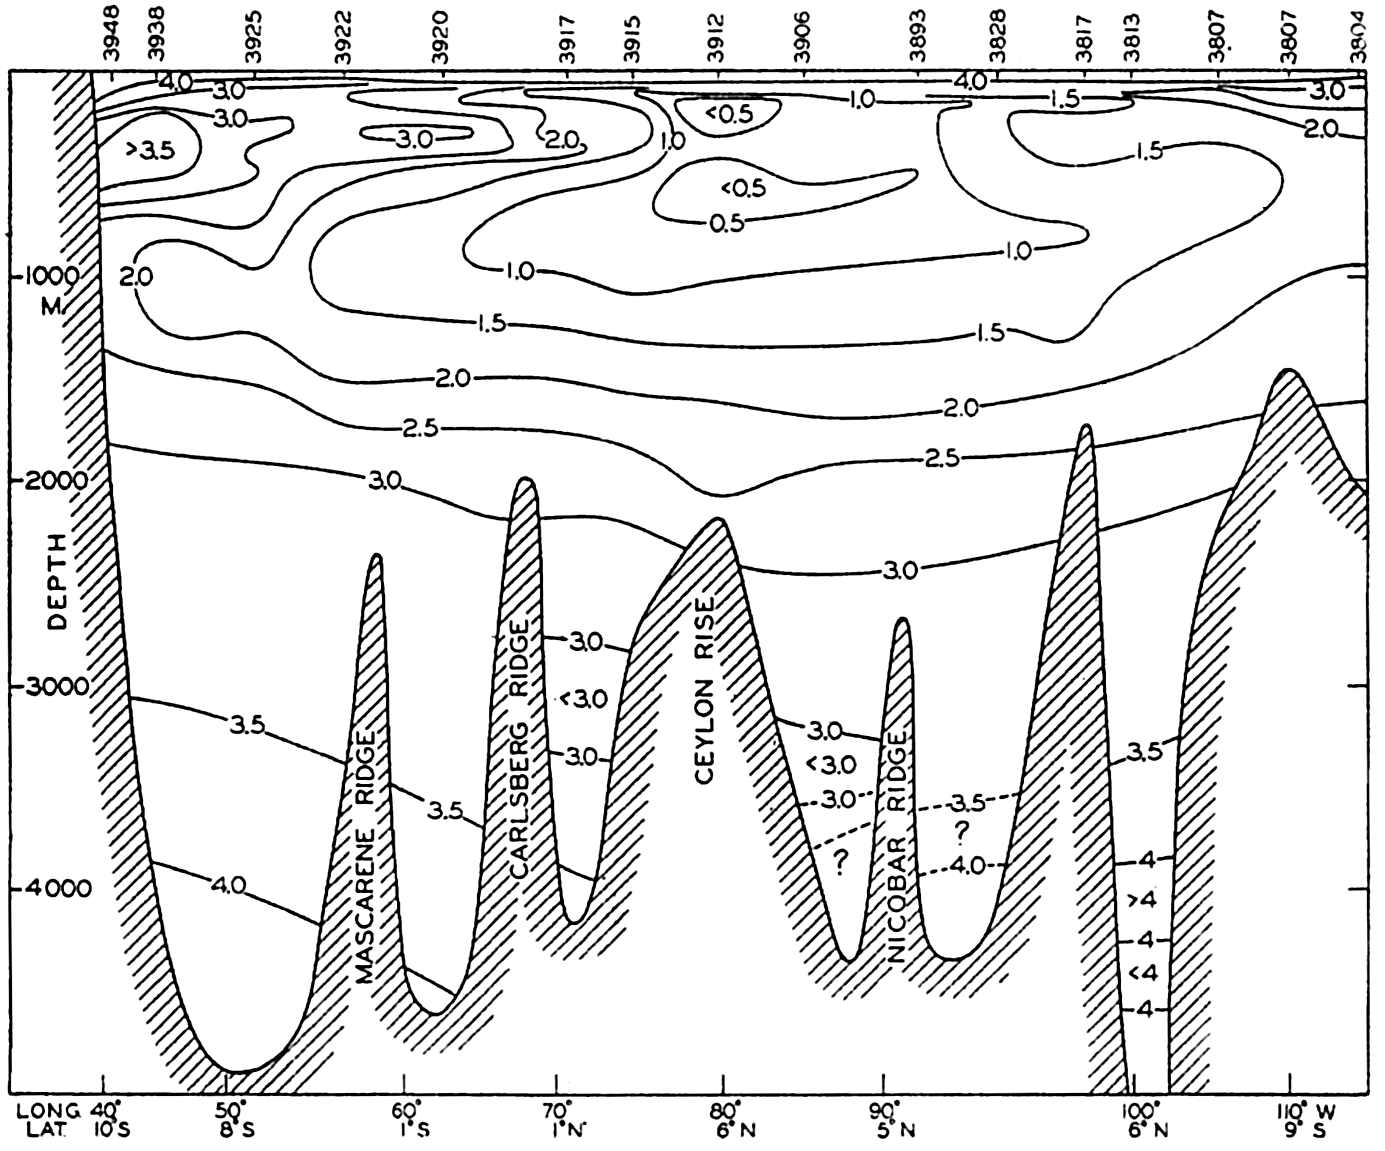
Distribution of oxygen (ml/L) in a vertical section along the east coast of Africa. Location of section shown on map. (After Clowes and Deacon.)
[Full Size]
Oxygen Distribution. The distribution of oxygen in the Indian Ocean is not known in detail, but some of the characteristic features can be seen from the Discovery and Dana sections in figs. 192 and 193. According to the Discovery section along the African east coast the oxygen content of the Indian Ocean decreases from the south toward the Equator. The Red Sea water is characterized by low oxygen content, but the content increases in the direction in which the Red Sea water spreads, probably due to mixing with the over- and underlying water masses. The Antarctic Intermediate Water is relatively high in oxygen and the same statement applies to the deep water, in which values ranging from 4.4 to 3.6 ml/L are observed. To the north of 20°S an intermediate minimum of oxygen is present at a depth of approximately 200 m. According to the Dana section the oxygen content of the tropical waters
