Interactive Steering of Supercomputer Calculations
Henry Fuchs
Henry Fuchs is the Federico Gil Professor of Computer Science and Adjunct Professor of Radiation Oncology at the University of North Carolina at Chapel Hill. His current research interests are high-performance graphics hardware, three-dimensional medical imaging, and head-mounted display and virtual environments. Dr. Fuchs is one of the principal investigators on the VIST Anet program, which is one of five gigabit network testbed projects supported by NSF and the Defense Advanced Research Projects Agency. He has been an associate editor of the Association for Computing Machinery (ACM) Transactions on Graphics (1983–88) and has chaired many conferences, including ACM's SIGGRAPH '81 (technical program chair), the 1985 Chapel Hill Conference on Advanced Research in VLSI, the 1986 Chapel Hill Workshop on Interactive 3D Graphics, and the 1990 NATO Advanced Research Workshop on 3D Imaging in Medicine (with cochairs Karl Heinz Höhne and Stephen M. Pizer). He serves on various advisory committees, including NSF's Division of Microelectronic Information Processing Systems and the ShoGraphics Technical Advisory Board.
I will discuss the aspect of the future computing environment that has to do with interactive visualization. What I mean by interactive visualization is that you can control what is happening on the supercomputer and
see the results, all in an interactive loop. For instance, your Macintosh could be connected to a CRAY Y-MP, and you could have interactive visualization.
I am going to tell you about one particular application that we are pursuing in the VISTAnet project and give you some idea of where we hope to make some progress. Perhaps we could generalize so that some of the lessons we learned might be applicable to other projects.
A lot of interactive visualization has to do with getting more graphics power and seeing more than just what is on the 19-inch CRT, so I am going to emphasize that aspect of it. The VISTAnet project is pursuing, as its first application, radiation therapy treatment planning. The only way to do that right is to do some applications that you cannot do now but that you might be able to do if you had a fast enough connection.
Let us say that the treatment involves a cancer patient with a tumor. Medical practitioners decide that the way to treat the tumor is by hitting it with sufficient radiation to kill it, but they hope that there will be sufficiently low radiation to the rest of the patient's body so that it will not kill the patient. This, then, becomes an interesting computer-aided design problem that does not always have a solution. Because of the complicated anatomical structures in the human body and the erratic manner in which many tumors grow, it is almost impossible to know if there is a particular set of places where you could put radiation beams so that you can kill the tumor and not kill the patient.
This is not just an optimization problem in which you get the best answer; even the best answer may not be good enough. We are talking about the kind of problem where the window of opportunity may be 10 per cent or so. That is, if you go 10 per cent over, you may kill the patient or have very serious consequences; if you go 10 per cent under, you may not cure the patient.
Now, of course, the standard thing to do is to hit the tumor with multiple beams and then hope that at the tumor region you get lethal doses and at other places you do not get lethal doses. This is how radiation treatment is done in two dimensions (Figure 1) everywhere in the world. But, of course, the body is three dimensional, and you could aim the beams from a three-dimensional standpoint. That would give you a whole lot of places where you could aim the beam and get better treatment plans.
The problem is that if you have all these degrees of freedom, you do not know exactly where to start. Thus, the standard thing that people do is to go to protocols in which they know that for a certain kind of tumor in a certain place, they will treat it with a certain kind of beam placement.
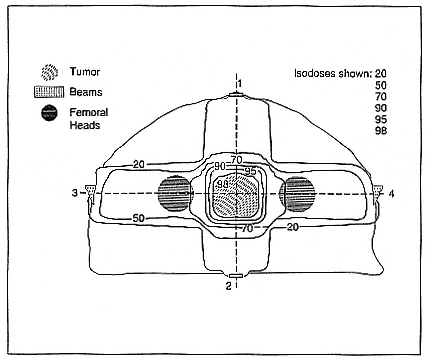
Figure 1.
Two-dimensional treatment planning (courtesy of Rosenman & Chaney).
Then they look at these plots on different levels and make minor corrections when they see that there is some healthy tissue that should not get that much radiation. Because it takes a half hour to two hours on the highest-performance workstation to get a dose distribution, the typical way that this is done is that the physicist and the therapist talk about things, and then they do one particular plan and iterate a few times through over a couple of days until they are satisfied with the outcome. What we hope is, if you could do this iteration on a second-by-second basis for an hour or two hours, you could get dramatically better plans than you can with current systems.
Now I would like to discuss what kinds of visualizations people are dealing with in medical graphics. Through these graphics you could see the place where the tumor is. In digital surgery you can cut into the body, and you do have to cut into it to see what is going on inside. We hope this kind of cutting is also going to be done interactively. There are a number of different things that you have to see, all at the same time, and that you have to work with, all at the same time. When you move the beam, you
have to see the new dose, and you have to compare that against the anatomy and against the tumor volume because certain kinds of tissue are more sensitive to radiation than others. A lot of patients are repeat patients, so you know that if you have treated the patient a year and a half before, certain regions are significantly more sensitive to repeat doses than they were before.
Figure 2 shows the relationship that VIST Anet plays in medical visualization. It has the CRAY Y-MP at the North Carolina Supercomputing Center, located at the Microelectronics Center for North Carolina (MCNC); Pixel-Planes 5 at the University of North Carolina (UNC), Chapel Hill; and the medical workstation, which will be at the UNC Medical School initially but which we hope to extend to Duke University and elsewhere. We work with the fastest workstations that we can get. When the patient is diagnosed, he/she gets scanned in the CT scanner and may also get other tests like magnetic resonance imaging. Then the patient can go home and return to the facility in a week. Treatment may go on for a month, perhaps twice a week. We hope at the end of six weeks that, when we do another scan, the tumor volume is reduced.
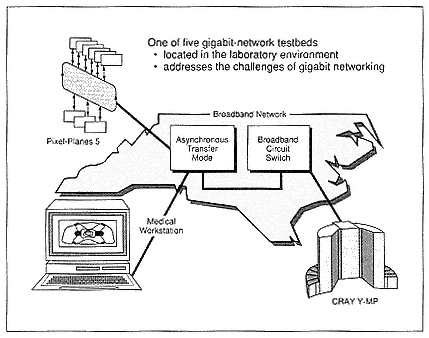
Figure 2.
VIST Anet and medical networking.
The bottleneck right now in this type of treatment is the graphics because even the most powerful graphics machines cannot do those kinds of calculations and imaging at interactive rates. The problem is at the frame buffer. The way that the fastest machines currently operate is that they take the frame buffer, divide it into a large number of small frame buffers that are interleaved (the large number might be anywhere from 16 to 80), and then assign a different processing element to each one of those in an interleaved fashion so that, as you can see in Figure 3, processor A gets every fourth pixel on every fourth scan line. When a primitive comes down the pipeline, then most or all of the processors get to work at it. Figure 3 shows the kind of layout that you get when some of the video memory is assigned to each one of the processing elements and then combined together to form the video display.
There is a limit to this. The limit comes, not surprisingly, when you start getting more and more processors and smaller and smaller amounts of video RAM, and when the memory bandwidth, like in all systems, finally gets to you (Figure 4).
Figure 5 shows one of our systems that in many ways is simpler than a general-purpose one because lots of the graphics operations are totally
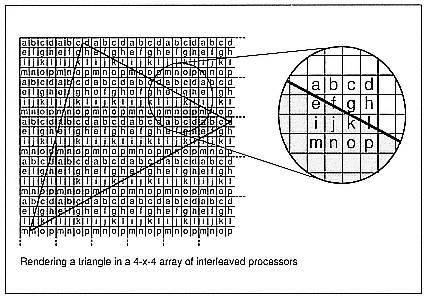
Figure 3.
Layout of processing elements that eventually combines to form a video display.
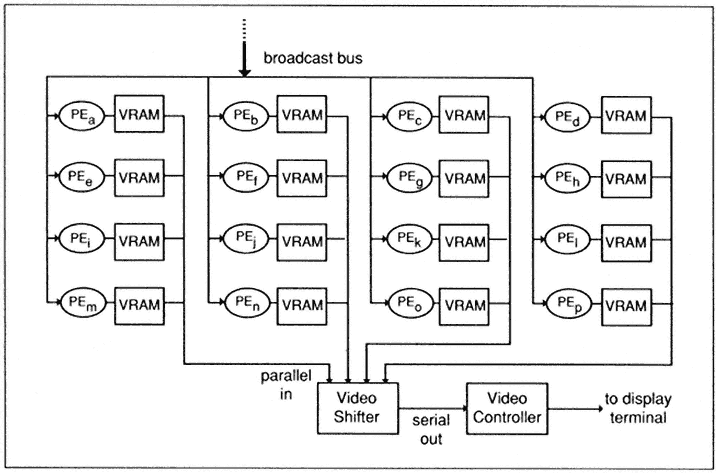
Figure 4.
Interleaved image memory system.
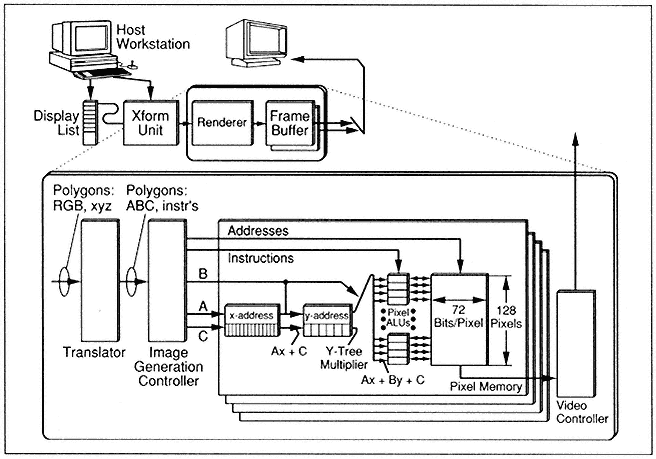
Figure 5.
Layout of pixel systems.
local. That is, you do the same thing at every pixel, and you do not care what is done at the neighboring pixel.
At UNC we have been working on varieties of Pixel-Planes systems, and we are on the fifth generation. We build memory chips in which every pixel gets its own little processor. It turns out that if all you do is put a processor at every pixel, you cannot have a big enough processor to make it meaningful to get anything done. We factor out as much arithmetic as possible into a hardware linear or quadratic expression tree; in this manner we get linear and quadratic expressions essentially for free. It very fortuitously happens that almost all the rendering algorithms can be expressed as polynomials in screen space (Figure 6). Our systems basically consist of memory chips for frame buffers, and they do almost all the rendering with a pixel processor for every pixel and a global-linear and quadratic-expression evaluation. If you make these chips so that the addressing on the memory chip can change, then you could take each one, a cluster of these memory chips, and make them essentially like virtual memory so that you can assign them to different parts of the frame buffer at different times.
The ring network runs at 160 megahertz, with many boards that are general-purpose 860-based systems. Virtual pixel processors can be
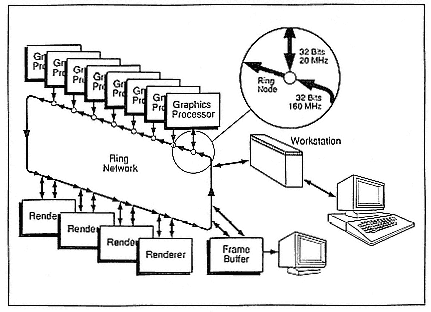
Figure 6.
Pixel-Planes 5 overview.
assigned to any place on the screen. In fact, if you want to do parametric-space calculations, they work just as well in parametric space as in x,y space. Whenever you are finished, you can do block moves from the renderers to the frame buffer. In fact, some of the algorithms that people are developing use these renderers for front-end machines and use the graphics processors for the back.
It turns out that the visualization problem is a lot more than just having a fast graphics engine. If you want to see all these things at the same time well enough to be able to interact with them on a detailed basis, then you need to have a lot better perception capability than you can get with current workstation displays. A 19-inch vacuum tube is not adequate because of the complexity of cues that humans get to perceive three dimensions in the world. The solution would be to bring all human perception capabilities to bear on the problem, such as obscuration, stereopsis, kinetic depth effect, head-motion parallax, spatial memory, and so on. Our current graphics machines give us very few of these cues. The machines basically only give us obscuration. That is, we can see when something is in front and where there are other things that are in back, although we do not see the things that are in back.
It will take essentially all of our human perception capabilities to produce a sufficiently powerful visualizer to be able to work with complex, three-dimensional systems. I believe the only candidate in sight is Ivan Sutherland's pioneering work on head-mounted displays, which are currently in vogue. They are called virtual-reality systems. Basically, these are systems in which the display is on your head, your head is trapped, and you perceive some object in front of you. As you walk around, you see what is in front of you, and you can walk literally around it.
In the head-mounted display, you wear little TVs with a small tracking system to track head and hand movements. If you are looking around a room, and in the middle of the room you see molecular models, you can reach out with your three-dimensional cursor, grab the models, and move them around. The molecular-modeling work is a long-time project of Fred Brooks and is supported by the National Institutes of Health.
If eventually you want to be able to have this three-dimensional constellation in front of you because you want to see not simply obscuration, stereopsis, head-motion parallax, and so on, there is a lot more work that needs to be done, not just in image generation but in good tracking of the head and hand. You need to have something in which you can have a wide field of view and a high-resolution display.
Several kinds of tracking might become possible with the three-dimensional technology, such as mechanical, ultrasonic, inertial, magnetic, and optical. For instance, in ultrasound examinations, images could be superimposed inside the patient, and as the transducer is moved about the patient, the data are remembered so that you sweep out a three-dimensional volume of data and actually see that data image (Figure 7). Then you could do a procedure in which you could see what you were doing rather than going in blindly.
Another application we can imagine is one in which your work on an engine and the head-mounted display overlay would have three-dimensional pointers rather than two-dimensional pointers, which would give you information about the path along which an item is to be removed
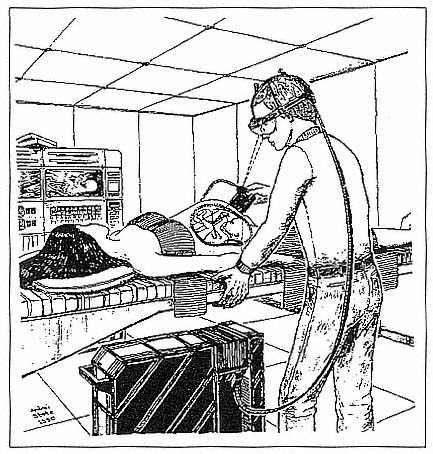
Figure 7.
Three-dimensional data imaging for medical applications.
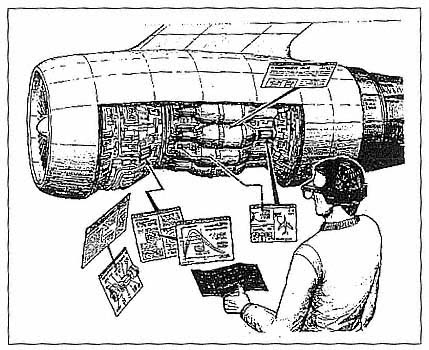
Figure 8.
Three-dimensional data imaging for engineering and mechanical applications.
(Figure 8). One could imagine further applications in reconnaissance, in which information is merged from a number of different sources, or in architectural previewing, that is, viewing in three dimensions, and perhaps making changes for a building before it is actually constructed (Figure 9).
In summary, the message I have for you is that you want to think about computing environments, not just from the standpoint of program development but also of program needs. Computing environments will be heterogeneous and must include, for many applications, a very strong visualization component. Interactive visualization needs a whole lot more power than it has right now to benefit from enhanced three-dimensional perception technology.
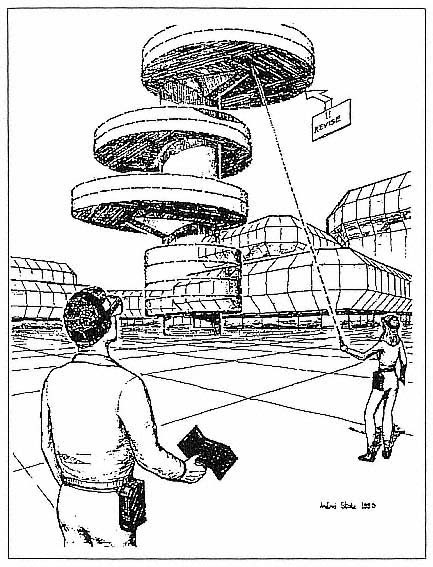
Figure 9
Three-dimensional imaging for construction applications.