SEVEN
An Economic Evaluation of the Costs and Benefits of Diablo Canyon
Alan J. Cox and Richard J. Gilbert
I. INTRODUCTION
Diablo Canyon is a 2,190-megawatt (MW) two-unit nuclear generating station located on the central coast of California and owned by Pacific Gas and Electric Company. Construction of the plant began in 1966 with units 1 and 2 scheduled for completion in 1972 and 1974. The original total cost was anticipated to be about $1 billion (1985 dollars). In 1971, as the first unit was nearing completion, Shell Oil announced the existence of a major geologic fault that ran as close as three miles to the reactor site. Evidence that the fault had the potential to generate earthquakes of greater magnitude than those that the plant had been designed for induced the Nuclear Regulatory Commission to revoke PG&E's operating license pending redesign of the plant. The Three Mile Island accident resulted in further redesign requirements. As these changes were being implemented, mistakes were made in drawing up designs and plans for construction, mistakes that were finally uncovered in 1981, when redesign was thought to be close to completion. Total cost, including allowance for funds used during construction (AFUDC), was projected to be $2.4 billion at that time. The final book cost, by the time mistakes had been corrected and the plant brought on-line, was more than double that amount.
With a book cost at completion of $5.67 billion, the Diablo Canyon nuclear power plant is one of the most expensive projects, if not the most expensive project, ever undertaken in the state of California. This chapter describes an analysis of the costs and benefits of Diablo Canyon.
We are grateful to Ed Kahn, Duncan Wyse, Ross Jennings, and Brian Newton for helpful comments. They are not responsible for any of the conclusions expressed in this chapter.
From a purely economic perspective, most of the costs of units 1 and 2 of Diablo Canyon are sunk, and any comparison with other electric power alternatives should consider only the plant's present and future costs· However, noting the importance of total costs in regulatory proceedings, this chapter examines the costs and benefits of Diablo Canyon from 1985 and from earlier dates, acting as if it were possible to go back in time. The main question asked is whether the costs of Diablo Canyon could have been justified by the savings in expenditures on other sources of power made possible from the electricity produced by the plant.
The first section of the chapter poses this question from the approximate date at which unit I of the plant was completed. The total costs of Diablo Canyon units 1 and 2 are compared with the costs of electricity generated with oil and gas. In the second section of the chapter, the analysis is undertaken from an earlier date, chosen somewhat arbitrarily to be 1978. The question asked there is: Given the expectations that were current in 1978 regarding the costs and benefits of building a plant to displace fossil fuels, did it make economic sense to build the plant?
In both sections, no distinction is made between costs that are sunk and costs that can be recovered if Diablo Canyon is replaced by alternative sources of power. But any conclusion regarding the relative costs of Diablo Canyon must be tempered by the reality of those costs that are sunk and therefore must be paid whatever course of action is pursued. The third section looks specifically at the problem of sunk cost. In this section we compute the levelized cost of Diablo Canyon for each year of its construction, omitting all capital costs that have already been invested in the plant. (The assumption is that all incurred capital expenditures are not recoverable.)
By 1985 nearly all of the $5.67 billion (in nominal dollars) spent on Diablo Canyon units 1 and 2 was sunk. Omitting these costs, Diablo Canyon is clearly more economical than oil and gas and probably undercuts any alternative source of power for which costs have not been sunk.[1] A different question, which again requires the luxury of hindsight, asks whether, during the recent history of the construction of Diablo Canyon, it would have been economically efficient to abandon the plant. The question is whether the levelized costs of Diablo Canyon, omitting sunk costs, exceeded the costs of alternative sources of power.
These assessments require assumptions about expectations of future costs. The assumption used in this paper is that the actual incurred costs
of Diablo Canyon could have been anticipated. Although this implies remarkable clairvoyance, it provides a reasonable bound on the value of the plant during the course of its construction.
A conclusion of this study is that even if the cost overruns for Diablo Canyon had been anticipated, at no time after 1974 was it economically efficient to abandon the plant given the base case forecast for oil and gas prices. Even with oil and gas prices corresponding to levels in 1986, the latest abandonment date is about 1981.[2] More optimistic expectations about the total costs of Diablo Canyon would only strengthen the conclusion that some point between 1974 and 1981 was the latest date at which the plant could have been abandoned for economic reasons based on the value of fuel displaced. The conclusion is strengthened still further given the prevailing prices for fuel oil in world markets at that time.
The abandonment criterion used here is a comparison of levelized nonsunk costs. This criterion ignores the financial conflicts between stockholders and customers that arise from utility regulation. For example, stockholders may not be reimbursed for investments that are sunk in abandoned plants, which may make management reluctant to abandon a project. Customer revenues have to cover all utility costs without distinguishing between those costs that are sunk and those that are not. Thus customers may want to abandon a plant even if abandonment is not economically efficient when sunk costs are taken into account.[3] Put another way, the conclusions about the abandonment decision for Diablo Canyon in this paper address the collective interest of stockholders, customers, and taxpayers, but the conclusions may not be consistent with the individual interests of any party.
The analysis in this paper does not deal with the complexities of electric utility ratemaking. The intention of this analysis is to include in the cost of the plant only those items that represent actual expenditures on scarce economic resources. Items such as taxes, which represent money transfers from one party to another, are excluded. As a consequence, the computations do not comply with tax or accounting conventions undertaken in typical regulatory proceedings.
The magnitude of the benefits from the Diablo Canyon plant is uncertain. Our study indicates that under fuel price assumptions used as the base case for this analysis, the total nominal cost of the project exceeds the value of the oil and gas displaced by the operation of Diablo by about 15%. However, the replacement cost of the nuclear facility estimated in
constant dollars is more than 30% greater than these oil and gas savings. When the project costs and benefits are viewed from dates before completion of units 1 and 2, the project's forecasted benefits exceed total incurred and forecasted costs. Most important, by 1974 the anticipated costs, in constant dollars, of finishing and operating the Diablo Canyon plant (excluding sunk costs) were lower than the base case forecasted costs of operating fossil-fuel-fired alternatives. Even if oil and gas prices are much lower than our base case assumptions and the actual costs of Diablo Canyon were fully anticipated, it was not economically efficient to abandon the plant later than early 1981. Thus by no later than 1981 the sunk costs of Diablo Canyon were large enough, relative to total costs, to justify continuing the project until its 1985-1986 completion date.
II. COSTS AND BENEFITS OF DIABLO IN 1985
Calculating the Costs of Diablo Canyon
Table 7.1 reports various estimates of the costs of units 1 and 2 of the Diablo Canyon plant as of January 1, 1985.[4] The first two rows report the construction costs of both units in absolute terms and in dollars per kilowatt of capacity. These are expenses reported by PG&E to the California Public Utility Commission (CPUC) excluding taxes and with no adjustment to account for inflation during the construction period. Taxes are excluded because they represent a transfer of revenue from one party to another and our focus is on the economic resource costs of the project.
The economic cost of Diablo Canyon includes the foregone interest on capital that is invested in the construction of the plant. Because this money could have been invested elsewhere, the foregone income is a cost of construction. A regulatory approach to estimating the cost of foregone income is allowance for funds used during construction. AFUDC credits the utility with an estimate of the interest cost of debt and the return on equity used in construction. This credit accumulates in an AFUDC account, which, under traditional rate of return regulation, is added to the capital expenditures to determine the plant's contribution to the rate base when the plant is operational.
The plant's contribution to the rate base, Rt , accumulates according to:
Rt +1 = (I + xt ) (Rt + It ) | (7.1) |
where xt is the AFUDC rate and It is the plant investment in year t.[5] Under traditional rate-of-return regulation with AFUDC accounting, the utility receives no actual earnings on Rt until the plant is operational.[6] If the plant is completed in year T and no costs are disallowed, the contribution to the rate base is Rr .
The AFUDC account in year t, A t , is the difference between Rt and cumulative construction expenditures up to date t, Kt For Diablo Canyon, projected totals corresponding to a 1986 completion date are
R1986 = $5.67 billion
K1986 =
It = $3.71 billion
and
A1986 = R1986 - K 1986 = $1.96 billion
AFUDC alone accounts for about 35% of the total book cost of the plant.
These figures are in nominal dollars and do not accurately reflect the true replacement cost of the plant. To estimate the replacement cost of Diablo Canyon, we first converted the construction cost to 1985 dollars by dividing annual construction costs by the GNP price index (normalized to 1985). This gives a construction cost in 1985 dollars of $5.03 billion.
The conversion of AFUDC earnings to constant 1985 dollars is more complicated. AFUDC is a payment for foregone interest and, as such, includes compensation both for the real cost of capital and for anticipated inflation over the construction period. Thus any calculation of the "replacement AFUDC" would depend on the time path of replacement investment and the cost of capital over the construction period.
A "replacement AFUDC" can be calculated in 1985 dollars by converting actual investment expenditures to 1985 dollars and applying a real (no inflation) cost of capital to expenditures over the actual construction period. This is very similar to what is actually done in AFUDC accounting, except that actual AFUDC expenditures are in nominal (rather than constant) dollars, and the AFUDC rate corresponds to the nominal (rather than real) cost of capital.
Suppose that the operation date T is the base year for measuring the replacement value of the plant. An investment of Ir t in year- T dollars makes a contribution to the rate base in year T equal to (the superscript r denotes real quantities)
| (7.2) |
where xrv is the AFUDC rate in year t used for the replacement value calculation.
The constant-dollar investment Irt is related to the nominal investment I t by
Irt = | (7.3) |
where it is the rate of change of the cost index in year t . Combining equations (7.2) and (7.3) gives
d RrT = | (7.4) |
In nominal dollars, the contribution of It to the (nominal) rate base in year T is
It | (7.5) |
The contributions in equations (7.4) and (7.5) are equal, to a first-order approximation, if xt = x rt + it in every year. In other words, if the nominal AFUDC rate equals the real rate plus the inflation rate for capital investment, the two methods for calculating the rate base differ only by terms of the order i t xrt The replacement cost calculation yields the higher value, but the difference shrinks if the rate base is compounded over shorter time periods and disappears for continuous compounding.[7]
In evaluating whether the AFUDC account correctly compensated investors for the opportunity cost of capital, the answer hinges only on the relation between x t and xrt + i t If they are equal, then to a first-order approximation
KT + AT = K rT + ArT | (7.6) |
Using equation (7.6), the reported values for KT and A T ,and the calculated value for KrT gives (in billions of 1985 dollars)
ArT = 3.71 + 1.96 - 5.03 = 0.64
The real compensation for funds used to finance the construction of Diablo Canyon totals about $640 million when a replacement value is calculated in 1985 dollars.
Figure 7.1 shows values of A rT and RrT that would be calculated with reported investment expenditures converted to 1985 dollars using the GNP deflator and using the indicated real cost of capital for xrt in every year. An AFUDC compensation of $640 million in 1985 dollars corresponds to a real AFUDC rate of about 1.75%/year.
Table 7.2 shows AFUDC rates for Diablo Canyon imputed from PG&E reports in nominal and real terms (using the GNP deflator). The AFUDC rate that justly compensates investors for the use of their funds is equal to their real after-tax cost of capital. This may be approximated by the weighted average of the before-tax cost of debt (because debt is deductible against earnings) and the after-tax cost of equity capital, with the weights corresponding to the firm's debt-equity ratio. The real weighted average cost of capital (WACC) after taxes is shown in column 3 of Table 7.2. This exceeded the real AFUDC rate in every year. Investors were not compensated for foregone interest until after 1968.[8] Since that time, the real AFUDC rate varied from a low of-2.84% in 1974 to a high of + 4.89% in 1984. Over the same period, PG&E's WACC varied from a low of 0.62% in 1975 to a high of 8.84% in 1985, with a geometric mean of 3.8% over the period 1966-1984. The average annual rate, weighted by the total investment in each year, was 5.75%.
The lower AFUDC rates can be rationalized by appealing to traditional regulatory practice with its lower risk for utility investors relative to the manufacturing sector. Recent events have upset this historical relationship. Nonetheless, it is our view that the implicit real AFUDC rate of 1.75% was not adequate compensation for foregone interest, and a figure of 3.0-6.0% would have been more appropriate. A value of 4.75% gives real AFUDC earnings of about $1.5 billion, in 1985 dollars.[9] Adding this to the replacement value of capital investment ($5.4 billion, 1985 dollars) gives a total replacement value of the plant equal to about
$6.9 billion in 1985 dollars. The nominal dollar cost of constructing the plant is $2.3 billion.
Comparisons of the costs of the Diablo Canyon plant with other nuclear power plants can be misleading because the available cost data are in nominal dollars and therefore include the toll of inflation over the construction periods. With this important caveat in mind, a simple comparison of the numbers in Table 7.1 with data available for other nuclear generating stations indicates that the costs of Diablo Canyon are about average for reactors coming on line in the mid-1980s. Komanoff (1984) reports, for instance, that the average construction and AFUI)C costs for 34 nuclear projects he sampled is $3,123/kW in nominal dollars, over $500/kW (nominal dollars) greater than Diablo. The sample included 14 multireactor projects that are generally less expensive (per kilowatt) to build. For multiunit plants, the average nominal cost including AFUDC drops to approximately $2,240/kW, about $350/kW (nominal dollars) less than PG&E's costs for Diablo Canyon.
After removing the AFUDC component for each plant and converting all expenditures to constant dollars, Komanoff reports the average construction cost for all 34 plants to be $2,428/kW in constant 1985 dollars.[10] Our estimate of the equivalent figure for Diablo Canyon is $2,295/kW. The Komanoff paper does not give enough information to estimate the average constant-dollar cost for multiunit plants excluding AFUDC, but his data show that the average would be in the range of $1,400/kW-$1,650/kW. The constant-dollar construction cost of Diablo is appreciably larger than the multireactor national average: 39 to 63% larger, depending on where the national average actually lies. Yet the nominal cost of Diablo, including AFUDC, is only 15% larger than the multireactor national average. Thus compared with national averages, Diablo Canyon is relatively expensive in terms of construction expenditures but relatively cheap in terms of AFUDC. It seems that the extremely low real rates used to compute AFUDC earnings make Diablo appear, on a book-value basis, to have been bought at a fairly reasonable cost. The cost saving is only illusory, because the low AFUDC rates mean that much of the interest costs of Diablo Canyon were paid by utility investors without adequate compensation.
Comparison of Costs and Benefits
To make comparisons of costs of electricity from Diablo and other sources available or potentially available to PG&E, consistent estimates
of the levelized cost of electricity must be made and compared with the value of displaced electricity that would have been produced by an alternative generating technology. Realistic alternatives to nuclear power include fossil fuels (coal, oil, gas), and the more exotic technologies of solar, wind, and renewable resources. Hydropower and geothermal are sufficiently limited in supply to make them unavailable as replacement sources of energy. Conservation also has been proposed as an energy source: the cost of investments required to reduce demand, or the cost of foregone consumption, are measures of the cost of making energy available through the conservation option.
In this time period, oil and/or natural gas (henceforth gas) is the energy source used in the PG&E system with the highest operating cost (which includes the cost of fuel, labor, and wear and tear on equipment). Given the current configuration of the PG&E electric power system, most of the power produced by Diablo Canyon will displace gas, and hence the value of this production is the cost of gas fuel and the operating costs of the gas-fired capacity. One can argue whether different supply planning decisions and/or different approaches to load management might have created a situation in which the marginal energy source for the system would be something other than gas. In addition, with the benefit of hindsight, the power from Diablo Canyon might have been produced with different technologies; perhaps coal or wind.
This chapter takes the existing PG&E system as a given and measures the value of energy displaced by Diablo Canyon based on the cost of existing power from displaced facilities. Specifically, we estimate the energy benefits of the Diablo system on the basis of payments made by PG&E to small power producers for electric energy. Diablo Canyon also will displace generating capacity that would have been necessary in the absence of the Diablo capacity. We use the cost of a new gas-fired steam turbine plant as a measure of the cost of future displaced electric power capacity.
Oil and gas are proven technologies with relatively short lead times. Whether these energy sources are cheaper than alternatives such as coal, solar, or conservation is a subject of heated debate. Nonetheless, taking oil or gas as the alternative energy source provides an upper bound on the value of electricity produced by Diablo Canyon.
The assumptions contained in the base case are presented in Table 7.3. The most important of these are that the real discount rate is 10%; the expected real rate of increase in the price of oil and gas is zero until 1988 and 3%/year thereafter; the average heat rate of plants that are displaced by Diablo is 11,300 Btu/kWh; and Diablo Canyon achieves a capacity utilization rate of 65%.
Our basecase heat rate (the rate at which the heat content of fuel is converted to electric energy) is based on estimates provided by the
CPUC. These estimates are made to establish the price that PG&E must pay small power producers for electric energy. Before Diablo came on line the annual average heat rate for marginal plants was 12,427 Btu/ kWh. After both reactors came on line the annual average is estimated to be 10,356 Btu/kWh. The figure that we use for the heat rate in our base case is an average of the pre- and post-Diablo heat rates, used in computing payments to small power producers. These heat rates are actually lower than the heat rates of the plants displaced by Diablo Canyon (Pacific Gas and Electric, 1984a).[11]
The fuel cost assumed for a gas plant is $19/barrel of oil equivalent (BOE). This is the CPUC's estimate (California Public Utilities Commission, 1985, p. 22) of the incremental cost of natural gas plus delivery cost in 1985. The actual cost of gas delivered to PG&E's plants in early 1985 was $31.32/barrel of oil equivalent (in January according to Federal Energy Regulatory Commission [FERC] filings), falling to $27.27/barrel of oil equivalent in August. Establishing an appropriate price for the alternative fossil fuel is complicated by the fact that the CPUC has mandated (through its G-55 rate) that PG&E must charge itself a premium rate for natural gas used to produce electricity. The base case of $19/barrel of oil equivalent attempts to correct for this premium, which is effectively a transfer between electricity and gas ratepayers.
Capital savings due to fossil fuel plants not required as a result of Diablo are also included. Lost Capacity is made up by the addition of 1,900 MW of capacity that is assumed to have been constructed in 1983 and one 300-MW plant brought on-line in 2004. The addition of the first of these plants is justified by the capacity shortage experienced by the utility in 1983-1984.[12]
The levelized cost of electricity is computed by dividing the total cost of the project by the lifetime production of electricity, discounted to the present. The total cost includes the construction and AFUDC earnings of the project charged as a single lump-sum payment at the end of the construction period. In addition, operating and maintenance costs are
calculated over the life of the project and discounted back to the first day of 1985. The same computations are made for the gas-burning alternative. For the purposes of the results reported in Table 7.4, the capital cost of Diablo is the reported value in nominal dollars.
Estimates of levelized costs are made on the basis of a variety of assumptions as indicated in Table 7.4. The results suggest that, based on reported nominal costs of Diablo Canyon and base case projections of oil and gas prices, the nuclear plant falls short of paying for itself as measured by the value of oil and gas displaced over its useful life. In the base case, the levelized value of displaced oil and gas is 6.79¢/kWh, whereas power from Diablo Canyon has a levelized cost of 7.75¢/kWh.
Of course, these results are sensitive to assumptions such as projected oil and gas prices, the choice of the discount rate, Diablo Canyon's capacity utilization rates, and the heat rate in fossil fuel plants that are displaced by Diablo Canyon.[13] If gas prices are projected to increase by 6%/ year, electricity from Diablo Canyon will be cheaper over the life of the plant. However, a 6% increase in gas prices is not sufficient to push the benefits of the project above its costs when the benefits of future price increases are discounted at 12%. In addition, a cost of gas of $24/barrel oil equivalent (escalated at the base case rate) would also result in Diablo Canyon paying for itself in terms of displaced oil and gas. This price is significant because it approximates the cost of gas to PG&E in 1985. In all cases, the assumption of no real increase in the cost of gas results in a shortfall in the net benefits of the nuclear project.
Table 7.5 shows the sensitivity of the results to changes in the assumed heat rate under the base case assumptions. The heat rates indicated in Table 7.5 are, in declining order, PG&E's average heat rate from marginal plants before Diablo Canyon came on-line, our base case rate, PG&E's average gas-fired heat rate after both units of Diablo came online, and the heat rate of PG&E's most efficient gas-fired unit operating at its most efficient level of production (Pacific Gas and Electric, 1984a). Even at the highest rate cited, the cost of electricity from the nuclear plant is 0.49¢/kWh above the cost of the gas alternative when other parameters are at their base case values. Lower assumed heat rates merely reduce the measured benefits further.[14]
The cost of Diablo Canyon in the above analysis consists of the nominal dollar reports of the construction costs and of the payments into the AFUDC account. To compare the economic costs that would have been incurred had Diablo not been built with the economic costs of Diablo, it
is necessary to convert the nominal dollar costs of the nuclear project to constant dollars. We recalculated the cost of Diablo by adding to the 1985 dollar cost an AFUDC earning estimated with a real allowed rate of 4.75%. This raises the 1985 dollar cost of Diablo to $6.9 billion. The resulting levelized costs, under a limited set of assumptions, are presented in Table 7.6.
A comparison between Tables 7.4 and 7.6 reveals that, once these corrections are made, the costs of Diablo Canyon substantially exceed the estimate of the avoided costs of oil and gas under base case assumptions. The 8.83¢/kWh estimate for the cost of electricity from Diablo is 30% greater than the cost of gas-fired electricity. Even if the cost of oil and gas increases at 6%/year from 1988, the avoided costs will not justify the investment in Diablo Canyon.[15]
Avoided cost is the basis of the regulatory procedure that was implemented by the CPUC to determine the earnings that PG&E is allowed on its investment in Diablo Canyon (California Public Utilities Commission, 1985). Under this scheme the utility is allowed to collect revenues as if it were operating the generating stations that were displaced by the nuclear plant.
PG&E already purchases electricity from small power producers at a price that is based on its (short-run) avoided cost. In the first quarter of 1985, before the first unit of Diablo Canyon came on-line, the purchase price for electricity averaged 7.2¢/kWh, with a peak price of 8.6¢/kWh. At that time PG&E announced that it would pay, during the next quarter, an average of 6.3¢/kWh if Diablo Canyon did not come on line and 5.6¢/kWh if it did, with peak prices being 7.4 and 6.4¢/kWh, respectively (Pacific Gas and Electric, 1985, Table E). The computed prices are biased upward in that they include the G-55 gas price surcharge but are biased downward by their exclusion of a capacity price. Payments made in the winter months also tend to be higher. The PG&E purchase prices again indicate that the benefits of Diablo Canyon fall short of its book value when measured against payments that the utility would have to make in the absence of the project.
The results presented in Tables 7.4 and 7.5 indicate the avoided costs that would be applied to Diablo Canyon under our assumptions. In general, the results indicate that payment to PG&E on the basis of avoided cost should allow the company revenues that would fall about 15% short of the total nominal cost of the nuclear plant. The CPUC (1985) report also provides estimates of annual revenue that PG&E would be allowed
to collect under an avoided-cost scheme. We have incorporated the CPUC assumed cost of gas of about $19/barrel of oil equivalent in our base case. Under the CPUC assumptions this price declines substantially until 1990 but increases at a high rate in the 1990s. Overall, their forecasted gas prices are equivalent to ours when discounted and averaged over the life of the plant. However, the CPUC assumptions differ from ours in a few notable areas. The CPUC heat rates for gas plants[16] average about 9,500 Btu/kWh. Capacity credits, on the other hand, are based on the cost of cheap, but inefficient, gas turbine capacity, whereas ours are based on the cost of steam-driven generators. Finally, the CPUC assumes a 60% capacity factor. The total effect of these differences in assumptions results in a CPUC estimate of the avoided cost of Diablo Canyon being about two-thirds of our base case estimate. In fact, their estimated total payment (on a levelized basis) is about 3.8¢/kWh, about 56% of ours. This includes a payment for energy savings that implies a levelized cost of fuel of $14.20/barrel of oil equivalent, reflecting the considerable amounts of geothermal, other nuclear, and purchased energy that the CPUC estimates will be displaced by Diablo Canyon.
At a 10% real discount rate, the present value of payments to PG&E for the avoided cost of electricity displaced by the project is $4.13 billion under the CPUC scenario. Subtracting the nuclear plant's operating costs allows about $1.7 billion to pay for the capital invested, leaving $4.0 billion of the book value of the plant to be paid by stockholders and taxpayers (through tax deductions of losses). Of this, between $1 billion and $1.5 billion will be borne by PG&E's stockholders, depending on the tax regime during the plant's life. Under our base case assumption, the total cost will exceed total benefits by about $1 billion with about a quarter to a half billion of that paid by stockholders. In the next section we analyze whether such a shifting of the costs of Diablo Canyon from ratepayers would be justified on the basis of expected costs and benefits rather than on the basis of what actually transpired.
III. DIABLO CANYON VIEWED FROM 1978
Our base case results indicate that the costs of the Diablo Canyon nuclear plant exceed its benefits by a significant amount. PG&E's shareholders would be better off had the plant not been built even if the book value of the plant is recovered. Customers may be better off if only the book value is recovered and oil and gas prices rise considerably. These results are not surprising, considering the huge cost overruns, long delays, and considerable softening of oil and gas prices.
Would such a result have seemed likely in the late 1970s when it became apparent that Diablo Canyon would not operate on time and on budget? The question here is whether predictions of future oil and gas prices that were commonplace in the late 1970s justified further construction on the nuclear project, given the realized costs.
This question was examined by estimating levelized costs of electricity generated by both Diablo Canyon and a fossil fuel alternative, always discounting back to 1978 but allowing the nuclear project to come on-line in 1979, 1981, 1983, or 1985. The costs of Diablo Canyon are evaluated as replacement costs in constant dollars rather than the nominal dollars reported by PG&E, with AFUDC estimated on the basis of a 5% real rate of return. This clearly raises the measured cost of electricity from the nuclear plant.
One set of results is presented in Figure 7.2. The line labeled Cost 1 represents the levelized replacement cost of electricity from Diablo had it come on-line in the year indicated and had no further expenditures been necessary after the on-line date. The cost of the plant is assumed to be equal to the replacement cost of what had actually been spent on Diablo by that year measured in constant dollars, including the estimated AFUDC.
The levelized costs of electricity represented by Cost 2 is equal to Cost 1 plus the replacement cost of the additional investment that was actually made to complete the project after the year in which the project is assumed to come on-line. This additional amount does not include AFUDC. For instance, had the first unit come on-line in 1981, the levelized cost of electricity from Diablo would include all the expenditures that were made in the years 1981-1986 but none of the AFUDC earned in those years. Cost 2 is an approximation of what the real cost of Diablo Canyon could have been if the plant had been completed on an earlier time schedule. Some proportion of the distance between Cost 1 and Cost 2 could be thought of as an indication of the costs due to changes in the design of the project made since 1978.
The line labeled "average cost of oil and gas" is the forecasted levelized cost of electricity from a fossil fuel facility, including the capital costs necessary to replace Diablo Canyon. To be fully consistent with a view from 1978, some additional investment in capacity would have been made, as forecasts of the demand for electricity were much higher than the ones on which the previous simulations were based. The prices used for oil are those that were used in a California Energy Commission (CEC) report (1979). Thus the forecast of oil and gas prices corresponds to expectations held in about 1978. The average heat rate of the plants that are assumed to be displaced is 11,300 Btu/kWh.
The forecasts of the cost of oil by the CEC in 1979 reflect the relatively modest prices experienced before the 1978 increase, but they did predict sustained increases at a high rate toward the late 1980s. The predicted high prices account for the increasing per-kilowatthour benefits of the project. Given the high real increases predicted for oil prices in the CEC report, the levelized cost of electricity from Diablo Canyon is less than the cost of displaced oil and gas for every year of completion.
The scenario described by the CEC was commonly held in the late 1970s, with the forecasters of high prices finding considerable comfort in events of the Persian Gulf. Had the CEC scenario been borne out by events up to the present and/or should prices return to the predicted trajectory, the investment in Diablo Canyon would have been justified by the benefits in oil and gas savings.
The situation is considerably changed if predictions for the cost of oil are more in line with the experience of the last few years, as can be seen by examining Figure 7.3. Here the levelized cost of electricity displaced by Diablo Canyon is estimated on the basis of actual prices for oil to 1985, our base case forecast of $19/barrel of oil equivalent in 1986, and 3 percent real growth of gas prices after 1988. In this case the discounted present-value cost of electricity from Diablo rises above the discounted benefits between mid-1980 and 1983, depending on which cost estimate is used for the final cost of Diablo Canyon.
This does not imply that, from a societal point of view, PG&E should have abandoned the plant in 1977, because this calculation fails to separate sunk costs from the total costs of Diablo Canyon.
The traditional process of rate-of-return regulation for public utilities creates a divergence between the interests of private parties in the continuation of investment in new plant and the societal consequences of the investment (see Chao, Peck, and Gilbert, 1984, and Zimmerman, 1985). The societal value of continued investment depends only on the benefits and costs of expenditures that are not yet sunk. A utility must finance all expenditures but is compensated, under traditional regulatory practice, only for plant that is entered into the rate base, which typically requires that the plant be completed and operational. Thus utility shareholders have a financial interest in seeing construction projects through to completion. In contrast, ratepayers may prefer to cancel a construction project if cheaper power is available from another source. The difficulty with this comparison is that the private costs to ratepayers include sunk costs, while the social comparison between alternative sources of power should include only those costs that are not sunk. Total costs are minimized by abandoning an unfinished project in favor of an alternative source of power only if the cost of the alternative is less, excluding all sunk costs associated with the unfinished project and the alternative.
If a plant is completed, sunk costs become a source of revenue for shareholders and a cost of service for ratepayers. Peter (the ratepayer) pays Paul (the stockholder). The total payment cancels and thus the total (societal) value of continuing investment should not depend on sunk costs. The divergence between private and societal considerations can be increased with changing expectations about the value of the completed plant. In the late 1970s, when fuel prices were increasing, the projected value of the Diablo Canyon plant reflected the high projected cost of oil and gas. Based on initial construction estimates, Diablo Canyon offered a high return relative to the projected value of displaced oil- and gas-fired generation. This can be seen by comparing Cost 1 (the initial cost estimate for Diablo) in Figure 7.2 to the average cost of oil- and gas-fired generation displaced, based on 1070 energy price projections by the CEC (California Energy Commission, 1979).[17]
As construction difficulties with the Diablo Canyon plant mounted, it became apparent by the mid-1080s that the final cost of the project would be closer to that indicated by Cost 2 in Figures 7.2 and 7.3. Figure 7.2 shows that Diablo Canyon is arguably cheaper then the value of displaced oil and gas if energy prices corresponded to the CEC projections. Of course, energy prices fell sharply during the 1980s. When the Diablo Canyon plant was nearing its completion date, the relevant cost of oil-and gas-fired generation displaced was as shown in Figure 7.3. Under actual construction costs corresponding to Cost 2, the total cost of the Diablo plant, including sunk costs, exceeded the cost of displaced oil and gas as early as 1980. Because ratepayers have to shoulder the total cost of the plant, once it becomes apparent that total construction costs will exceed the value of displaced oil and gas, ratepayers would be better off by calling for immediate abandonment of the plant with a total disallowance of all Diablo Canyon expenditures, and then turning to new construction of an oil- or gas-fired alternative. As we shall argue below, this does not mean that abandonment of Diablo Canyon, as implied by Figure 7.3, is the alternative that minimizes the cost of producing power.
IV. THE ECONOMIC IMPACT OF SUNK COSTS
Most of the $5.67 billion spent on Diablo Canyon could not be recovered if the plant were abandoned. They are sunk costs and therefore economically lost. The social calculus governing the relative economic efficiency of Diablo Canyon versus other generation alternatives should consider only those costs that are not sunk. Costs that are sunk cannot be saved by any course of action. Sunk costs must be borne whether or not the
plant is used or replaced by another. Hence they are best forgotten when considering the costs and benefits of competing alternatives. Abandoning Diablo Canyon could change the party that bears the sunk cost. For example, ratepayers might avoid some part of the Diablo Canyon sunk costs by refusing to allow the plant to be included in the rate base. But the sunk costs still would have to be paid, and their amount would be unaffected by the abandonment decision.
Given that most of Diablo Canyon's cost are sunk, it is not economically efficient to abandon the plant and replace it with an alternative source of power. For example, at the end of 1984, about $5 billion, or 88% of Diablo's nominal capital costs, were paid. Assuming that these costs are not recoverable, the levelized costs of Diablo that were not sunk at the end of 1984 were 3.91¢/kWh in 1984 dollars. This compares with oil and gas costs of 6.79¢/kWh in the base case and 5.59¢/kWh in the low oil and gas cost scenario.
Of course the 3.91¢/kWh figure ignores past expenditures that contribute almost 5¢/kWh to the total generating costs of Diablo Canyon when costs are based on replacement value. But these costs have been paid and cannot be recovered. They will continue to be a cost to society whatever policy choice is made and however that policy shifts the accounting responsibility for the costs of Diablo Canyon. They have become, in effect, part of the earth.
By 1984 the operating and capital costs of Diablo Canyon that were not sunk had become so small that the continued operation of the plant clearly dominated the cost of switching to oil and gas as alternative sources of power. Moving backward in time, one may ask at what date (if ever) did the costs of Diablo Canyon that were not sunk exceed the costs of electricity generated with oil and gas. As always, the answer depends on assumptions. The assumptions here are as follows:
1. At each point in time it was possible to forecast the actual future expenditures on Diablo Canyon.
2. For every year under consideration, future expenditures and AFUDC earnings (at 5%) on those expenditures are discounted back to that year using the base case assumptions for the discount rate. Electricity production is also discounted back to that year.
3. Operating and maintenance costs are as in the base case.
4. Oil and gas costs correspond to either the base case or a low scenario of $14/barrel in 1986 rising at a 3% rate and a lower heat rate of 10,300 Btu/kWh.
Assumption (1) is not intended to imply that the actual costs of Diablo Canyon were perfectly anticipated. Rather, this assumption is a useful one for analyzing the economic costs and benefits of the plants if the
events that occurred could have been predicted. Assumption (2) permits the use of each year in the history of Diablo Canyon as the reference year for evaluating costs and benefits. It allows us to turn back the hands of time and consider the Diablo investment decision during each year in the history of the plant. Assumptions (3) and (4) are the same used elsewhere in this study.
Assuming that benefits and costs were predictable masks an important dynamic element. Discussions as to whether to abandon the nuclear plant in the past would have to have been based on information available at that time. For instance, even our base case assumptions on oil prices would have been considered wildly optimistic in the late 1970s. Oil prices were much higher, and few would have predicted the potential impact of cogeneration on electricity supply and on marginal heat rates.[18]
The results, expressed in levelized, nonsunk costs, are shown in Figure 7.4. The two horizontal lines represent the levelized cost of electricity from gas-fired plants. The higher of the two is the result of base case assumptions. The lower line replaces the basecase fuel cost with gas at $14/barrel of oil equivalent and the base case heat rate assumption with 10,300 Btu/kWh. The levelized values of electricity from the gas alternative remain constant over the period because, although the costs are discounted by a smaller factor as we move closer to the startup date, the electricity production is being discounted by exactly the same declining factor.
The levelized cost of producing electricity from Diablo Canyon declines every year, however, because we are only considering the remaining investment and the AFUDC to be paid on that investment.[19] Diablo's declining nonsunk costs are represented by the downward sloping line in Figure 7.4. The points at which this line falls below the horizontal line represent the last time it made economic sense to abandon the plant. For our base case assumption this occurred during 1974. Figure 7.4 indicates that even with the lower heat rate and price for gas, an abandonment decision based on the net value of displaced oil and gas would have to occur before 1981.
It would seem unlikely that depressed oil and gas prices of the late 1980s could be credibly maintained as an economic argument to abandon the Diablo Canyon plant in the mid-1970s to very early 1980s, when expectations of ever-increasing costs of oil and gas were commonplace. The jagged line labeled "actual oil prices" gives some indication of the
state of then-current information. It shows the cost of electricity generated from oil sold at the average cost of heavy oil delivered to U.S. electric utilities (Energy Daily, June 13, 1985). The costs are estimated assuming that the real cost of fuel was projected to rise by 1%/year. This projection is clearly too low for the period of oil price controls between 1973 and 1981. Most forecasters were also watching world oil prices as an indicator of long-term oil prices. The assumed heat rate is 10,300 Btu/kWh.
Given these oil price projections it seems clear that continuing to build the plant was the social welfare-optimizing decision after the early 1970s, even if the final cost of the plant was known. Of course, the non-sunk Costs were always thought to be much lower than those indicated by the downward sloping line of Figure 7.4.
It is appropriate to discuss the history of the Diablo Canyon project in the context of Figure 7.4. The discovery of the location of the Hosgri fault close to the Diablo Canyon site was published in 1971 and was brought to PG&E's attention over a year later. By that time the utility had spent over $300 million (nominal dollars) on the plant and had been allowed to earn $40 million in AFUDC. Almost four years were spent debating the likely size of an earthquake that Diablo Canyon might have to withstand. Finally, in May 1976 the Nuclear Regulatory Commission (NRC) ordered a redesign of the plant. By that time the expenditure on the plant, including AFUDC earnings, had risen to almost a billion dollars.
It has been estimated that the cost to redesign the plant to the new NRC specification was $600 million (California Public Utilities Commission, 1987). However, before the plant came on-line new changes were ordered as a result of the Three Mile Island accident. These changes were estimated to cost $400 million. At the same time domestic costs for fuel oil were climbing rapidly. The low costs to finish the plant clearly indicate that, on a nonsunk cost basis, it was appropriate to complete the plant.
The last major milestone in the history of Diablo Canyon before completion occurred in late 1981 with the discovery of a major construction error, the "mirror image" problem. This discovery led to the uncovering of a large number of other errors. By that time a total of $2 billion had been spent. The final cost of the plant was becoming clearer, and the availability of alternative nonutility-owned sources of supply was better understood. At the same time world prices for oil were peaking at well over $30 a barrel. If low heat rates and the collapse of oil prices could have been confidently predicted, abandonment might have been appropriate. But as shown in Figure 7.4, in 1981 these nonsunk costs were
quite comparable to the value of displaced oil- and gas-fired generation at the low fossil fuel cost, and therefore abandonment of the Diablo Canyon plant in 1981 would have been a very close call.[20]
V. CONCLUSION
Estimates of the costs and benefits of Diablo Canyon indicate that the projected benefits of the project fall short of its costs when those costs are evaluated on the basis of either the plant's book or replacement value. The value of displaced electricity, assuming oil and gas prices that seemed reasonable when the plant first came on-line, exceed the book value of the plant. The benefits of the project will improve substantially if PG&E can maintain a high rate of utilization of the plant, if oil prices increase, or if unanticipated increases in electricity demand drive up the heat rate of marginal plants.
The net benefits of Diablo Canyon plummet when the projected value of displaced energy is compared with the replacement cost of capital invested in the plant. The replacement value of the plant is about $6.9 billion in 1985 dollars. The replacement value of construction expenditures is $5.03 billion in 1985 dollars, compared with a book value of $3.71 billion. Although our estimate of the replacement AFUDC is about the same as the reported AFUDC for Diablo Canyon, the latter is in nominal dollars and the implied compensation rate for foregone interest is less than the opportunity cost of capital. In real terms, the implied AFUDC rate for Diablo Canyon has averaged only about 1.75%/ year. This suggests that (all else equal) a substantial portion of the costs of Diablo Canyon have been underwritten by the shareholders of PG&E through inadequate compensation for foregone interest.
The dismal outlook for the net benefits of Diablo Canyon is a product of recent low oil and gas prices and the high opportunity cost of funds during the project's long construction period. Using forecasts of oil and gas prices developed in 1978 (after the 1973-1974 oil embargo but before the revolution in Iran), the benefits of Diablo Canyon exceed its replacement cost (and a fortiori exceed the anticipated replacement cost of the plant).
One can pose the question of whether at any time during the construction of Diablo Canyon it was economically rational to abandon the plant. If all of the cost overruns and the fluctuating oil prices could have
been predicted, the plant should never have been started. But information about both the high cost of the plant and its uncertain benefits developed over many years, and during this time more and more of the plant's total capital costs were irrevocably expended. Our analysis shows that, taking these sunk costs into account, by early 1074 the projected economic benefits outweighed the future costs of the plant using our base case assumptions, even if the large cost overruns could have been perfectly anticipated. Thus by 1074 purely economic considerations justified continued investment in Diablo Canyon. At gas prices of $14/barrel of oil equivalent and assuming an average incremental heat rate lower than our base case assumption, such a decline would have to have been anticipated by early 1081 to justify abandoning the plant on economic grounds.
REFERENCES
California Energy Commission (1979). Energy Futures for California: Two Scenarios, 1978-2000 . P102-79-016. Sacramento.
California Energy Commission (1985). The 1985 Electricity Report: Affordable Electricity in an Uncertain World . Sacramento.
California Public Utilities Commission (1985). "Diablo Canyon Nuclear Plant Value-Based Pricing Proposal."
California Public Utilities Commission (1987). "Review of the Costs of PG&E's Diablo Canyon Nuclear Power Plant Project and Recommendations on the Amount of Costs Reasonable for PG&E to Recover From its Customers." San Francisco, Public Staff Division.
Chao, H. P., R. Gilbert, and S. Peck (1984). "Customer and Investor Evaluations of Power Technologies: Conflicts and Common Grounds," Public Utilities Fortnightly , Vol. 113, No. 9, pp. 36-41.
Cox, A. J. (1978). "An Economic Evaluation of the Use of Wood Wastes to Generate Heat and Electricity at Pulp and Paper Mills in British Columbia." Vancouver: University of British Columbia, Resources Paper No. 20.
Helliwell, J. F., and A. J. Cox (1979). "Electricity Pricing and Electricity Supply: The Influence of Utility Pricing on Electricity production by Pulp and Paper Mills." Resources and Energy , Vol. 2, pp. 51-74.
Komanoff, C. (1984). "Assessing the High Costs of New Nuclear Power Plants." Public Utilities Fortnightly , Vol. 114, No. 8, pp. 33-38.
Pacific Gas and Electric Company (1984a). "Common Forecasting Methodology—V, Electric Supply Plan Forms," 1984-2004. Revised Submission.
Pacific Gas and Electric Company (1984b). Prepared testimony of Stephen P Reynolds.
Pacific Gas and Electric Company (1985). "Cogeneration and Small Power Production Quarterly Report," First Quarter, 1985.
Palmer, R. E., and R. R. Bum (1984). "Updating of Decommissioning Cost Estimates." In Transactions of the American Nuclear Society , Vol. 46, pp. 561-562.
Thermo Electron Corporation (1976). "A Study of Inplant Electrical Power Generation in the Chemical, Petroleum Refining and Paper and Pulp Industries." Washington, D.C.: Federal Energy Administration.
Zimmerman, M. (1985). "Regulatory Treatment of Abandoned Property: Incentive Effects and Policy Issues." Working Paper of the Graduate School of Business Administration. East Lansing: University of Michigan.
TABLE 7.1 | ||
Cost ($ in billions) | Cost/kW ($/kW) | |
Construction Costs Only | 3.71 | 1,696 |
Allowance for Funds Used During Construction | 1.96 | 895 |
Total Cost | 5.67 | 2,591 |
a NOTE: Dollar amounts in nominal dollars. | ||
TABLE 7.2 | |||
Year | Calculated AFUDC Rate | Real AFUDC Rate | PG&E's |
1966 | 0.00 | -2.82 | 5.30 |
1967 | 0.00 | -2.91 | 4.77 |
1968 | 0.00 | -3.94 | 4.26 |
1969 | 4.44 | -0.54 | 3.81 |
1970 | 5.84 | 0.61 | 3.47 |
1971 | 5.65 | 0.81 | 3.48 |
1972 | 6.09 | 2.01 | 4.36 |
1973 | 6.00 | 0.00 | 3.58 |
1974 | 6.29 | -2.84 | 1.50 |
1975 | 6.87 | -2.04 | 0.62 |
1976 | 6.34 | 0.51 | 4.34 |
1977 | 7.07 | 0.73 | 3.70 |
1978 | 8.06 | 0.24 | 2.90 |
1979 | 8.19 | - 1.20 | 2.16 |
1980 | 8.72 | -0.99 | 2.62 |
1981 | 9.42 | -0.08 | 4.28 |
1982 | 9.89 | 3.28 | 5.16 |
1983 | 9.19 | 4.68 | 6.27 |
1984 | 9.08 | 4.89 | 7.03 |
1985 | 4.88 | 3.27 | 8.84 |
ABLE 7.3 | |
Real Discount Rate: | 10% |
Real Rate of Increase in Cost of Fossil Fuels | |
1985-1988: | 0.0%/year |
After 1988: | 3.0%/year |
Average Heat Rate of Fossil Fuel Plants Displaced | 11,300 Btu/kWh |
Annual Real Increase in Operating and Maintenance | |
Costs of a Plant | 1.5%/year |
Operating Cost of Diablo | |
Fuel: | 1.4¢/kWh |
Nonfuel variable and fixed: | 0.8¢/kWh |
Decommissioning Cost of Diablob | $164,000/MW |
Cost of Gas-Fired Plant | $820/kW |
Operating Cost of Oil and Gas Plant | |
Fuel: | $19.00/BOEc |
Nonfuel variable and fixed: | 0.4¢/kWh |
Capacity Utilization Rate for Diablo Canyon Units 1 and 2: | |
1st year | 40% |
2nd year | 55% |
3rd-25th years | 65% |
26th-27th years | 60% |
28th-29th years | 55% |
Last year | 50% |
a NOTES: Currency units are in 1984 dollars and cents. | |
TABLE 7.4 | |
Levelized Cost | |
Base Case | |
Diablo Average Capital Cost (including AFUDC) | 5.43 |
Diablo Average Total Cost | 7.75 |
Value of Oil and Gas Saved | 5.17 |
Including Capital Savings | 6.79 |
Base Case With No Real Increase in Oil and Gas Prices | |
Oil and Gas Savings, Including Capital Savings | 5.82 |
Base Case With 6%/Year Real Increase in Oil and Gas Prices | |
Oil and Gas Savings, Including Capital Savings | 8.26 |
Base Case With $14/BOE Gas | |
Oil and Gas Savings, Including Capital Savings | 5.59 |
Base Case With $24/BOE Gas | |
Oil and Gas Savings, Including Capital Savings | 7.99 |
Base Case, Discounting at 8.5% | |
Diablo Average Capital Cost | 4.73 |
Diablo Average Total Cost | 7.06 |
Value of Oil and Gas Saved | 5.28 |
Including Capital Savings | 6.68 |
With 6%/Year Real Increase in Fossil Fuel Prices | |
Value of Oil and Gas Saved | 6.94 |
Including Capital Savings | 8.34 |
Base Case, Discounting at 12% | |
Diablo Average Capital Cost | 6.44 |
Diablo Average Total Cost | 8.74 |
Value of Oil and Gas Saved | 5.05 |
Including Capital Savings | 6.97 |
With 6%/Year Real Increase in Fossil Fuel Prices | |
Value of Oil and Gas Saved | 6.30 |
Including Capital Savings | 8.22 |
With 0%/Year Real Increase in Fossil Fuel Prices | |
Value of Oil and Gas Saved | 4.21 |
Including Capital Savings | 6.13 |
TABLE 7.5 | |
Base Case With Average Heat Rate of Oil and Gas Alternatives Assumed To Be: | Levelized Cost (1985 ¢/kWh) |
12,400 Btu/kWh | 7.26 |
11,300 Btu/kWh | 6.79 |
10,300 Btu/kWh | 6.38 |
9,400 Btu/kWh | 6.00 |
TABLE 7.6 | |
Levelized Cost (1985 ¢/kWh) | |
Base Case | |
Diablo Average Capital Cost | 6.51 |
Diablo Average Total Cost | 8.83 |
Base Case, Discounting at 12% | |
Diablo Average Capital Cost | 7.72 |
Diablo Average Total Cost | 10.02 |
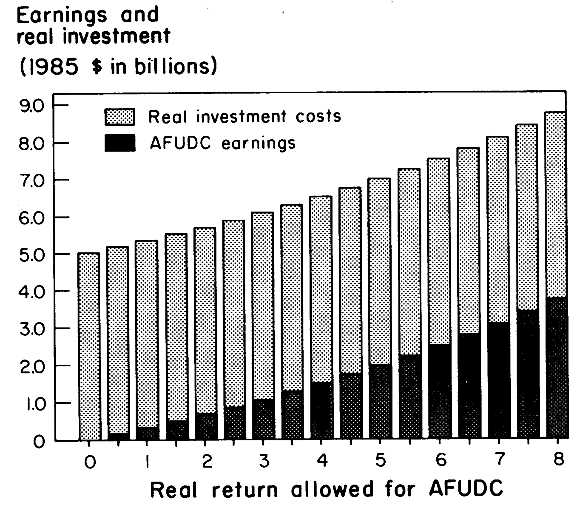
7.1. Replacement cost of Diablo Canyon.
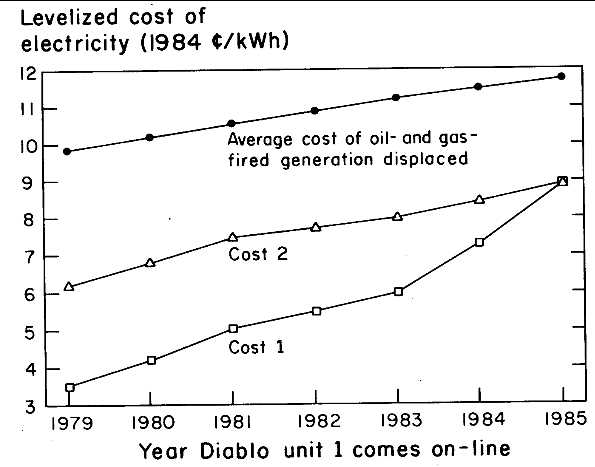
7.2. Effect of delay from 1978: comparison with the cost of displaced fossil-fired generation at CEC-forecasted average oil prices (California Energy Commission, 1979). An average heat rate of 11,300 Btu/kWh is assumed for the plants displaced.
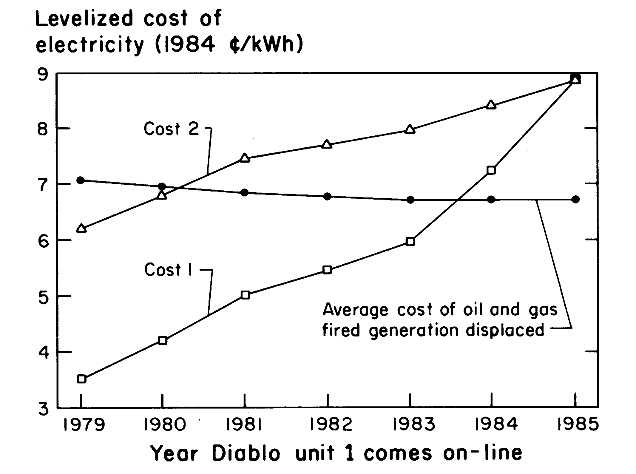
7.3. Effect of delay from 1978: comparison with the cost of displaced fossil-fired generation at actual oil prices. An average heat rate of 11,300 Btu/kWh is assumed for the plants displaced.
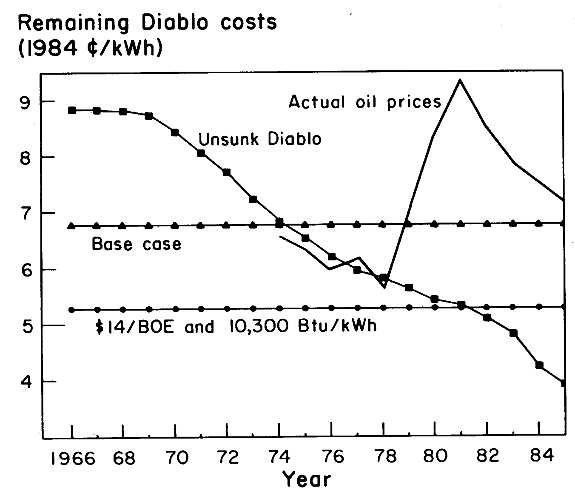
7.4. Levelized cost of electricity excluding Diablo's sunk cost. The curve labeled "actual oil prices" is the cost of electricity produced from heavy oil at the average price delivered to U.S. electric utilities and a heat rate of 10,300 Btu/kWh.