Nine—
Sexual Selection and Growth in Male Northern Elephant Seals
Walter L. Clinton
ABSTRACT. I studied the interactions between body size, growth, and life history in male northern elephant seals, Mirounga angustirostris , by constructing a growth curve and comparing the characteristics of growth to the pattern of male life history. The aim of this study was to determine the relationship between growth rate and age-specific male mortality rates. Four related exponential functions and a two-component logistic function were fitted to age-length data by nonlinear least squares regression. The two-component logistic curve fit the age and length data better than the best fitting exponential curve, the Richards function; however, both functions indicated a peak in growth rate around 3 to 5 years of age. Growth rates were high from 2 to 6 years of age, with relative growth rates of about 10% per year. Standard length of males increased each year of life until 9 years of age, and measurements of actual yearly growth indicated that after physical maturity, males stopped growing.
The peak in growth rate around 3 to 5 years of age and the end of growth by 9 years of age were related to important characteristics in the life history of males. The growth spurt may be associated with delayed maturity and a consequence of sexual selection for large body size. The timing of the growth spurt coincided with the lowest age-specific mortality rates over the life span of males and with the ages when increased growth rate was matched by longer periods of foraging at sea. Thus, the ages when males were exposed to the survival disadvantages of high growth rates were actually a period of low mortality. The high mortality among males occurred at 9 to 10 years of age after growth has ended and appeared to be associated with competition for mates.
Growth rates and body size are correlated with life history parameters such as age at maturity and age-specific fertility (Calder 1984). Where sexual selection has produced sexual dimorphism with males larger in size, male life history characteristics have also changed: males mature more slowly than females, delay breeding to older ages, and die at a higher age-specific
rate (Trivers 1985). To study the interactions between body size, growth, and life history, I collected data on size and age of male northern elephant seals, M. angustirostris , and constructed a growth curve to compare the characteristics of growth with those of male life history (Clinton 1990; Clinton and Le Boeuf 1993).
Modifications of pinniped male growth patterns due to sexual selection have been analyzed mainly by comparison with the growth pattern of females (Laws 1953; Scheffer and Wilke 1953; Carrick, Csordas, and Ingham 1962; Bryden 1972; Innes, Stewart, and Lavigne 1981). These studies show that males undergo an adolescent growth spurt, a type of pattern that was first described in humans (Bogin 1988; Harrison et al. 1988). In southern elephant seals, M. leonina , growth curves differ early between the sexes (Carrick, Csordas, and Ingham 1962). Males are larger than females after 1 year of age, and from 2 to 4 years of age, males grow at a faster rate than females. Growth curves indicate the female growth rate steadily decreases after 1 year of age. After a period of decreasing growth rate, the males' growth rate increased at 6 to 7 years of age, which is one to two years after puberty. This growth pattern in pinniped males was also found in northern fur seals, Callorhinus ursinus , in which the growth rate accelerated one to two years after puberty (Scheffer and Wilke 1953).
In polygynous species in which males are larger than females, the high male growth rates seen near puberty may be associated with increased male mortality rates (Ralls, Brownell, and Ballou 1980). The aim of this study was to determine the relationship between growth rate and age-specific male mortality in northern elephant seals. First, I review male life history to establish the age-specific pattern of male mortality; second, I present the growth curve for males; and finally, to consider whether increased growth rate is associated with increased mortality, I examine the concurrence between increased growth rate and changes in age-specific male mortality.
Review of Male Life History
The life history of male northern elephant seals has been strongly shaped by sexual selection (Le Boeuf and Reiter 1988; Clinton 1990; Clinton and Le Boeuf 1993). Compared to females, males delay the age of first breeding and live shorter lives. Most important, male reproductive success depends on the ability to compete for matings. Males that obtain the most matings presumably incur the greater risks and expend more energy during breeding competition (Deutsch, Haley, and Le Boeuf 1990); thus, increases in male reproductive success should be associated with decreased survival and decreased future mating success.
The life table indicates the key periods during the life of males and reveals the effects of sexual selection (table 9.1) (Clinton 1990; Clinton and
| ||||||||||||||||||||||||||||||||||||||||||||||||||||||||||||||||||||||||||||||||||||||||||||||||||||||||||||
Le Boeuf 1993). Males reached phenotypic maturity and began to mate at ages ranging from 5 to 10 years, with a mean age of 8 years. Male fecundity increased until 12 years of age, which is very late in the short fourteen-year male life span. After an initial decrease over the first four years of life, male mortality rates increased steadily from 5 to 10 years of age, a period that included the ages when males are growing in size and developing their secondary sexual characteristics. But at 11 to 12 years of age mortality rates dropped, even though fecundity continued to increase.
The second drop in mortality rates produced a characteristic "hump" in the middle of the age-specific mortality curve. Two factors possibly contributing to this increased mortality are relatively young and inexperienced males entering reproductive competition and nutritional stress due to high male growth rates (Ralls, Brownell, and Ballou 1980). Male elephant seals fast during the breeding season, and the length of the fast increases sharply at 6 years of age (fig. 9.1). Part of the increase in male mortality may be attributed to young males increasing the length of their breeding haul-out and changing its timing so that it overlaps with the period of female estrus.
In male northern elephant seals, reproduction early in life is costly in terms of survival and contributes to the increase in mortality in males from 6 to 8 years of age. A phenotypic cost of mating is shown by the negative relationship between current mating success and future mating success at these ages (table 9.2) Males that mated at 7 to 8 years of age had poor
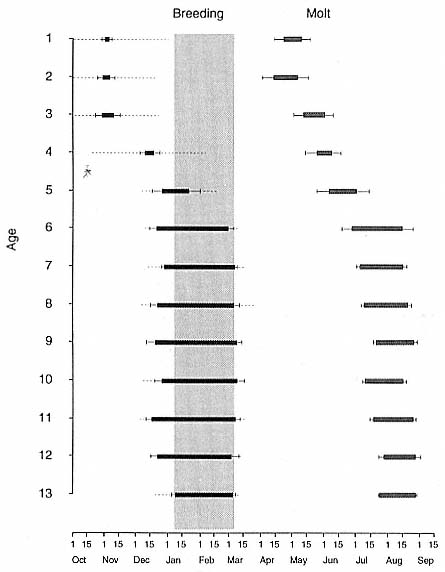
Fig. 9.1
The annual cycle of males from 1 to 13 years of age. The black and gray bars show
the dates and duration of mean haul-out periods for the breeding season and molt
season. The broad gray band indicates the period when females are in estrus.
The error bars are the standard deviation of the haul-out duration, and the dashed
lines indicate the standard deviation of the arrival and departure dates (when these
exceeded the standard deviation of the haul-out duration).
| ||||||||||||||||||||||||||||||||||||||||
prospects because their mortality was higher during the year after breeding compared to males who did not mate (Clinton and Le Boeuf 1993). At 9 years of age, the relationship between current mating and future mating success diminished, then shifted to a positive but not significant relationship at the ages when mortality rates decreased. The cost of mating was evident during the ages when males were not yet phenotypically mature, and high male growth rates before maturity may have contributed further to the increased mortality rate. To determine the growth rate of males, I collected length data from a cross section of males from weaning to 14 years of age.
Methods of Measuring Length and Growth
Measuring the Length of Male Elephant Seals in the Field
From 1983 to 1988, serial nose-to-tail length measurements of 117 known-age males and 103 tagged males of unknown age were obtained at Año Nuevo, California, during the fall haul-out or winter breeding season (Clinton 1990). Tagged males were measured each season they were present whenever this was possible. Individual seals were measured more than once in a season so that measurement error could be assessed. Attempts to obtain multiple measurements focused primarily on known-age males. Altogether, 437 length measurements were obtained in the field.
Male seals were measured with a tape measure when lying at rest with a straight body posture on flat sand or gravel. Straight line measurements from nose to tail were taken as males lay on their bellies or sides. Body position (lying on belly or side) and body posture (straight or tail curved) were recorded. According to the American Society of Mammalogist's (1967) definition of standard length for seals, the males ought to have been measured
while lying on their backs. This was not possible with unrestrained seals, and males on their sides usually appeared to have the same general posture as an animal on its back, so measurements of individuals in both positions, lying on the belly and lying on the side, were obtained to measure the effect of body position on the length measurement.
Field measurements were adjusted to a set of standard conditions that were equivalent to the measurement of length that would have been obtained if a seal was on its side. Based on multiple measurements in different positions, males measured while lying on their bellies had 4.7 cm added to their length to compensate for the slight decrease in length obtained due to this body position. These adjusted standard lengths are simply referred to as standard lengths in the text.
Means and standard errors of standard length, growth rate, and relative growth rate were calculated for individual males grouped by age. Actual yearly growth of individual males was measured by subtraction of consecutive standard lengths for each seal measured in consecutive seasons, and relative growth was calculated by dividing annual growth by the initial standard length. Based on repeated measurements of individuals during the same season, I estimated the error of length measurements to be ±10.8 cm, which is 2 to 3% of a male's length (Clinton 1990); the magnitude of measurement error limited the accuracy of measured yearly growth for individual males, especially as growth rates neared zero.
To increase the sample size for males at older ages, 14 tagged adult males, 10 to 13 years old, were included in the cross-sectional data. These males were tagged as subadults and could be aged to within ±1 year based on the developmental categories that each seal was assigned as they returned to Año Nuevo each season (Le Boeuf 1974; Clinton 1990; Clinton and Le Boeuf 1993).
Exponential Growth Curves
A family of four exponential functions—the Richards, the logistic, the Gompertz, and the Brody curves (table 9.3)—were fitted to these data to estimate the parameters of the growth curve (Brody 1945; Richards 1959; Fitzhugh 1975). These functions are commonly used because their parameters have useful biological interpretations (Richards 1959). The equations are written so that length (L) is a function of age, but since these curves are based on the idea that growth rate depends on an organism's current size, growth and relative growth are functions of length. The important features of the male growth pattern, such as the changes in growth rate with age, the age of highest growth rate, and the age when growth ends, were obtained from the parameters of the function that best fitted the data. The important parameters are m, k, and A because my objectives are to describe the growth pattern of male seals to adult size (which is related to m
|

and k) and to estimate when growth ends (which is related to A). The value of m determines the shape of the curve and the size (or age) when growth rate is maximal. If m > 0 the age-length curve will be sigmoid, and the growth rate will have a maximum at some age after the beginning of the curve. The value of k determines the inhibition of growth as age increases; basically, if m, b, and A are constant, larger k values mean larger size at given ages during the period of growth, faster growth at young ages, and a faster approach to asymptotic size. Because b is a time scaling factor, its value is not biologically significant.
A sigmoidal curve describes growth in most birds and mammals. This growth pattern is usually modeled with the Richards curve, or two of the special cases of this curve—the logistic and the Gompertz curves (Richards 1959; Case 1978; O'Connor 1984; Sibly and Calow 1986). The Richards equation is a four-parameter function that encompasses the three-parameter functions, since each of the other curves can be derived by setting m to specific values: m = 2 for the logistic, and m ® 1 for the Gompertz. Where growth decreases steadily after birth, the best fit will be obtained when m = 0, which is the Brody function. Each of these functions has a different shape mainly because each has a different point of inflection, which is the length (or age) at which growth rate is highest.
Multicomponent functions based on the logistic function have been used widely in recent longitudinal studies of growth curves that featured growth
spurts (Bock et al. 1973; Koops 1986). The change in growth rate is modeled by an additional set of parameters that begin to contribute to the shape of the growth curve at the transition between stages in a multicomponent function. In this study, the cross-sectional data for male M. angustirostris were fitted to a two-component function consisting of the sum of two logistic functions:
The first part of this equation governs growth early in life, and the second part begins to contribute to size later in life. The parameters d1 and d2 are the ages of the maximum growth rate for the first and second components; these parameters also eliminate the scaling parameter b from the function. For the cross-sectional data in this study, maximum growth in the first phase was assumed to occur near birth when pups are nursing from their mothers, so d1 was set to zero initially before estimating the other parameters.
The exponential growth functions were fitted to the cross-sectional age-length data by nonlinear least squares regression using the SAS NLIN procedure (SAS Institute 1985). All standard length measurements obtained for aged males were included in the data set. Strictly speaking, the data were mixed cross-sectional–longitudinal since some individuals were measured at more than one age (Fitzhugh 1975). Although data for these seals violated the least squares assumption that the observations are independent, the estimates of age-specific size and growth rate are usually improved by collecting mixed data instead of obtaining purely cross-sectional data (Tanner 1951).
Growth of Male Northern Elephant Seals
Standard length of males increased each year of life until 9 years of age. Table 9.4 shows the age distribution of males measured and the descriptive statistics for standard length, growth, and relative growth. Yearly growth rates were high from 2 to 6 years of age, and the relative growth rates indicate males increased their linear size by adding about 10% per year to their length until growth slowed at 7 years of age. But changes in growth rate in young males are not reflected in these data since 2- to 5-year-old males were difficult to measure in consecutive seasons, which limited the sample sizes for growth at each age to one to two males. The curves fitted to the length and age data had larger samples for these ages, and the growth rates of young males could be calculated from the parameters of the age-length curve.
To determine the exponential function that best described the rela-
| ||||||||||||||||||||||||||||||||||||||||||||||||||||||||||||||||||||||||||||||||||||||||||||||||||||||
tionship between age and standard length, the four related exponential curves were fitted to the cross-sectional age and length data by nonlinear least squares regression. Since the variances in standard length of males at each age were not equal (Bartlett's test: B = 23.951, df = 13, p < .05), the data for each age were weighted by the inverse of the standard deviation of length at that age. The Richards function with an m value close to 3 was the best fitting function of the exponential family of curves (table 9.5). The next best exponential function was the logistic curve, where m = 2, and 3 parameters are estimated by least squares rather than 4 parameters. A likelihood ratio test (Gallant 1987) of the Richards function versus the logistic function indicated the Richards function was a better fit of the data (L = 3.393, P(L) = P[F1,171 ] = 0.933, P is the likelihood that the full model is a better fit).
The two-component logistic curve fitted the age and length relationship of the cross-sectional data better than the Richards function according to several criteria. The two-component logistic curve had a higher R-square value (table 9.5). Although a reliable F test evaluating the significance of the difference between the fit of these two curves is not available, a pseudo-F test (variance ratio) indicates an improved fit of the two-component logistic curve versus the Richards function (F1,171 = 18.233). The plot of cross-sectional data with the two-component curve showed that this curve closely
| ||||||||||||||||||||||||||||||||||||||||||||||||||||||||||||||||||
Fig. 9.2
The two-component logistic growth curve plotted with the
cross-sectional data for male age and standard length.
followed the data (fig. 9.2). In comparison with the yearly growth data that were collected, the two-component logistic function was closer to measured growth rates among young males, and both functions were good predictors of growth after 5 years of age. Since the growth rate predictions of the functions differed most at these younger ages, the better fit of the two-component logistic curve indicates that it was a better model of male growth during the ages of high growth rates.
At 9 years of age, both exponential functions for the age and length curves were within 95% of asymptotic size, and the instantaneous yearly growth rate was about

to approach the zero growth rate, but male seals appear to stop growing by 9 years of age (table 9.4). Measurements of yearly growth indicated that 7 years of age was the last year of significant measurable growth (H0 : µ = 0,


Life History and Growth
The Richards and the two-component logistic growth curves both showed two important features of the growth pattern for male northern elephant seals, which were the peak in growth rate around 3 to 5 years of age and the end of growth after 8 years of age. These two characteristics in the growth pattern relate to the life history of males in this species. First, increased growth rates of males near puberty have been found in other polygynous seals and in anthropoid primates in which males are larger than females in size, males mature and reproduce later in life than females, and the mating systems are polygynous. This suggests that particular modifications in the growth patterns, such as a growth spurt near puberty, may be associated with sexual selection for large body size in males and that the acceleration in growth rate around puberty may be connected to delayed maturity. Second, growth in length ends when maturity is reached at 8 to 10 years of age and males make the transition to the ages of successful social competition for mates (Clinton 1990; Clinton and Le Boeuf 1993).
High growth rates around puberty were first noted in domesticated animals and in humans by S. Brody (1945). He suggested that the postnatal growth rate increased until puberty and then decreased, producing a sigmoidal growth curve such as the Richards curve. Except for the primate growth models with an adolescent growth spurt, the commonly used growth models have been simple exponential functions with a sigmoidal shape; primate growth models have required multicomponent functions to account for the more complicated pattern of growth featured by some primates (van Wagenen and Catchpole 1956; Bock et al. 1973; Froehlich, Thorington, and Otis 1981; Glassman et al. 1984). In some pinniped species (Laws 1953;
Fig. 9.3
The male growth curve versus the age-specific male mortality curve (modified
from Clinton and Le Boeuf 1993), showing that there is no direct relationship
between growth rate and mortality rate.
Scheffer and Wilke 1953; Carrick, Csordas, and Ingham 1962; Bryden 1972), the male growth pattern also features a growth spurt, and in this study of M. angustirostris , a two-component logistic growth function yielded the best model of male growth. In a recent reanalysis of growth studies in pikas, mice, and rabbits, W. J. Koops (1986) found that the multicomponent logistic functions provided a "nearly perfect" fit to longitudinal growth data that had originally been modeled with simple exponential functions. This raises the question, if growth patterns in mammals are better modeled with more complex functions, then why have simple exponential functions provided realistic and reliable models for so many studies? Koops suggests that part of the reason is the difficulty in collecting the data needed to distinguish the number of growth phases. Also, the simple exponential functions have fitted growth data well enough to model growth in species other than those with large, obvious growth spurts. In pinnipeds, where large size is strongly favored, selection for high growth rates in males appears to have accentuated the differences between growth phases by increasing the rates at the peak periods of growth during later stages of growth.
At 4 years of age, the timing of the growth spurt in northern elephant
seals coincided with the age when age-specific mortality rates were at their lowest over the life span of males (fig. 9.3). The high growth rate during the growth spurt does not appear to affect survival of males. Instead, the relationship between the life history of males and growth rates indicates that high growth rates occur when the energetic costs of growth may be at their lowest. Growth rates are very high during nursing, when the pup is provided milk with a very high energy content by the mother (Ortiz, Costa, and Le Boeuf 1978). The high growth rates from 3 to 5 years of age coincide with the period in the annual cycle of males that has short periods of fasting onshore during the fall and, conversely, longer periods of foraging at sea. By the ages when males begin to fast for long periods during the breeding season, the growth rate has diminished. Thus, increased growth rates coincided with periods when the increased energetic costs of higher growth rates were more likely to be matched by increased feeding rates. This result is surprising, since higher growth rates have been reasonably assumed to be a costly disadvantage of large male size, which is thought to be favored by sexual selection and opposed by increased mortality. Such an effect is not likely in northern elephant seals. The period when males ought to be most exposed to the survival disadvantages of high growth rates is in fact a period of low mortality, and the level of natural selection is at a low point during this period. Instead, the highest mortality among males occurs at the ages after growth has ended. Selection mostly takes place on males that have attained full size. Thus, the size attained during growth would be the character potentially affected by selection rather than the growth rate.
References
American Society of Mammalogists. 1967. Standard measurements of seals. Journal of Mammalogy 48: 459–462.
Bock, R. D., H. Wainer, A. Petersen, D. Thissen, J. Murray, and A. Roche. 1973. A parameterization for individual human growth curves. Human Biology 45: 63–80.
Bogin, B. 1988. Patterns of Human Growth . Cambridge: Cambridge University Press.
Brody, S. 1945. Bioenergetics and Growth . New York: Hafner Publishing Company. Reprinted 1968.
Bryden, M. M. 1972. Growth and development of marine mammals. In Functional Anatomy of Marine Mammals , ed. R. J. Harrison, 1–79. London: Academic Press.
Calder, W. A., III. 1984. Size, Function, and Life-History . Cambridge: Harvard University Press.
Carrick, R., S. E. Csordas, and S. E. Ingham. 1962. Studies on the southern elephant seal, Mirounga leonina (L.). IV. Breeding and development. CSIRO Wildlife Research 7: 161–197.
Case, T. J. 1978. On the evolution and adaptive significance of postnatal growth rates in the terrestrial vertebrates. Quarterly Review of Biology 53: 243–282.
Clinton, W. L. 1990. Sexual selection and life history of male northern elephant seals. Ph.D. dissertation, University of California, Santa Cruz.
Clinton, W. L., and B. J. Le Boeuf. 1993. Sexual selection's effects on male life history and the pattern of male mortality. Ecology 74: 1884–1892.
Deutsch, C. J., M. P. Haley, and B. J. Le Boeuf. 1990. Reproductive effort of male northern elephant seals: Estimates from mass loss. Canadian Journal of Zoology 68: 2580–2593.
Fitzhugh, Jr., H. A. 1975. Analysis of growth curves and strategies for altering their shape. Journal of Animal Science 42: 1036–1051.
Froehlich, J. W., R. W. Thorington, Jr., and J. S. Otis. 1981. The demography of howler monkeys (Alouatta palliata ) on Barro Colorado Island, Panama. International Journal of Primatology 2: 207–236.
Gallant, A. R. 1987. Nonlinear Statistical Models . New York: John Wiley and Sons.
Glassman, D. M., A. M. Coelho, Jr., K. D. Carey, and C. A. Bramblett. 1984. Weight growth in savannah baboons: A longitudinal study from birth to adulthood. Growth 48: 425–433.
Harrison, G. A., J. M. Tanner, D. R. Pilbeam, and P. T. Baker. 1988. Human Biology 3d ed. Oxford: Oxford University Press.
Innes, S., R. E. A. Stewart, and D. M. Lavigne. 1981. Growth in Northwest Atlantic harp seals, Phoca groelandica. Journal of Zoology, London 194: 11–24.
Koops, W. J. 1986. Multiphasic growth curve analysis. Growth 50: 169–177.
Laws, R. M. 1953. The elephant seal (Mirounga leonina , Linn.). I. Growth and age. Falkland Islands Dependencies Survey, Scientific Reports 8: 1–62.
Le Boeuf, B. J. 1974. Male-male competition and reproductive success in elephant seals. American Zoologist 14: 163–174.
Le Boeuf, B. J., and J. Reiter. 1988. Lifetime reproductive success in northern elephant seals. In Reproductive Success , ed. T. H. Clutton-Brock, 344–362. Chicago: University of Chicago Press.
O'Connor, R. J. 1984. The Growth and Development of Birds . Chichester: John Wiley and Sons.
Ortiz, C. L., D. Costa, and B. J. Le Boeuf. 1978. Water and energy flux in elephant seal pups fasting under natural conditions. Physiological Zoology 51: 166–178.
Ralls, K., R. L. Brownell, and J. Ballou. 1980. Differential mortality by sex and age in mammals, with specific reference to the sperm whale. Report of the International Whaling Commission Special Issue 2: 233–243.
Richards, F. J. 1959. A flexible growth function for empirical use. Journal of Experimental Botany 10: 290–300.
SAS Institute. 1985. SAS User's Guide: Statistics . Ver. 5. Cary, N.C.: SAS Institute.
Scheffer, V. B., and F. Wilke. 1953. Relative growth in the northern fur seal. Growth 17: 129–145.
Sibly, R. M., and P. Calow. 1986. Physiological Ecology of Animals . Oxford: Blackwell Scientific Publications.
Tanner, J. M. 1951. Some notes on the reporting of growth data. Human Biology 23: 93.
Trivers, R. L. 1985. Social Evolution . Menlo Park, Calif.: Benjamin/Cummings Publishing Company.
van Wagenen, G., and H. R. Catchpole. 1956. Physical growth of the rhesus monkey (Macaca mulatta). American Journal of Physical Anthropology 14: 245–273.