Birth Order and SAT Scores, or Sibsize and SAT Scores?
Since the publication in 1976 of an article by Robert Zajonc, "Family Configuration and Intelligence," the topic of birth order and cognitive ability has achieved renewed prominence. In that article, Zajonc used data on birth order as a proxy for information on spacing or birth interval, because, according to his confluence model (already discussed in chapter 4), he believes that short birth intervals decrease the intellectual environment in the family. This decrease in intellectual environment with short birth intervals occurs, according to Zajonc, because as infants are born (with an intellectual level of zero), they reduce the overall intellectual equation in the family. Close spacing implies a high proportion of infant and childlike abilities in the family in relation to the abilities of adults and older children. Zajonc (1976) emphatically denies that birth order per se is an important variable, it is only influential insofar as it is accompanied by close spacing.
In itself birth order is not an important variable. The model predicts that its effects are mediated entirely by the age spacing between siblings. . . . Hence, with large enough age gaps between siblings (allowing sufficient time for the earlier born to mature), the negative effects of birth order can be nullified and even reversed. (p. 227)
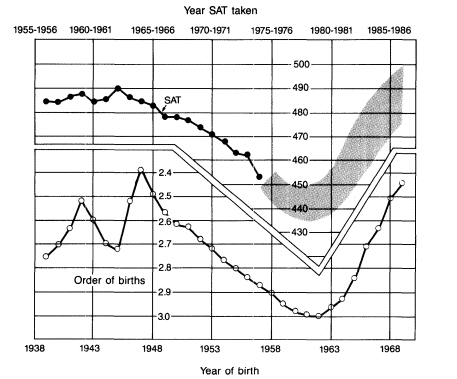
Using average birth order by year for the United States, Zajonc reasoned (on the basis of the confluence model) that one could predict the SAT scores in the United States and account for their decline, as well as project a future rise. The average annual birth order is simply an average of the distribution of annual births according to whether they are first births, second births, third births, and so on. In the 1976 article, Zajonc predicted, on the basis of what he felt was a past association of SAT scores and average birth order, that the scores would rise after about 1980, since average birth orders were declining. The figure from Zajonc's 1976

Figure 5.6.
Average Order of Live Births in the United States, 1939 to 1969, and
Average SAT Scores for the First Eighteen Cohorts. Future SAT averages
are predicted to lie within the shaded area. Data from Zajonc (1976).
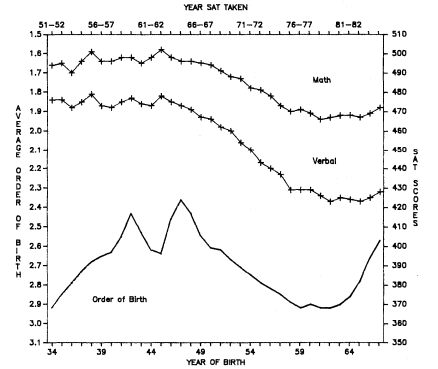
article is reproduced here as figure 5.6. In figure 5.7 we have extended the data on average birth order and SAT scores backward in time to the year of the first published scores, and forward in time to the scores for 1985. We also show the verbal and math scores separately.
When this entire range of SAT scores and average birth orders is presented, it is evident that average annual birth order is not as felicitous a predictor of SAT scores as it appeared to be in the incomplete figure presented by Zajonc. For example, although the SATs are at a high point in the early 1950s, the average birth order was as high among these test takers (those born 17 to 18 years

Figure 5.7.
Average Order of Live Births in the United States 1934–1967, and Verbal and
Mathematics SAT Scores 1951–1952 through 1984–1985. SAT scores are from
Eckland (1982) and personal communication with the College Entrance Examination
Board. Order of birth data are derived from National Center for Health Statistics
(1950) and each respective year 1948–1968 (Vital Statistics Natality Volumes).
previously in 1934) as it was for test takers born in the early 1960s. This means that the average birth order was identical for the birth years of the SAT takers who were at both the high and the low points of the SAT scores.
Why does average annual birth order work so poorly as a predictor of SAT scores? At least two factors are operating. One concerns problems with average annual birth order as an indicator, and the other is differential selection bias among the SAT takers.
To understand why average annual birth order is a poor indicator, one must first be clear about why Zajonc (1976) believes it is a good proxy for birth-spacing.
High values of average order of births for a given year indicate that children born that year have on the average more older siblings and come from larger families . . . [average order of births] combines two important factors of intellectual development, family size and birth rank. (p. 232)
Implicit in his reasoning is that, on average, large families involve closer spacing. But, is average order of annual births a good indicator of either family size or spacing? The answer regarding family size is, of course, negative because although being of a higher birth order must mean that one comes from a large family (as Zajonc recognized), the converse is not true—being from a lower birth order in any given year tells us nothing about the individual's sibsize. Any number of children can be born after the first or the second, and so forth. Nor, assuming one knows family size, could one predict spacing from that knowledge because, as we have discussed already, although larger families inevitably constrain shorter spacing, on average, than smaller families, small families may be spaced closely out of parental choice, as has been true in the recent fertility experience of the United States.
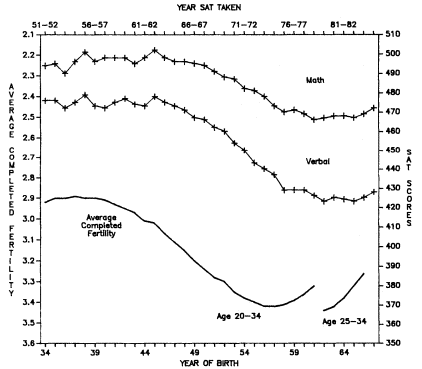
However, if one believes (as we do) that family size is important for ability because of the dilution of parents' resources (as well, perhaps, because of a heavy representation of very young "intelligences" in large families, as Zajonc assumes), then one can obtain an accurate direct measure of the average family size of women who gave birth in each of the years in question (these are the birth years for 17-year-olds taking the SAT between 1952 and 1985). This is possible because, in each of the years, we know that the women giving birth had to be in the reproductive ages and, hence, we can date their birth cohorts and use the cohort fertility tables for the United States to read off the completed family size of women who were having children in those years. In actual practice, since most births (approximately three-quarters) in each year occurred to women age 20–34, we can use the completed family size data for those age groups in each year. The data, plotted in figure 5.8, thus represent the completed family size of women age 20–24, 25–29, and 30–34 in each year of birth of the SAT takers (1934, 1935, 1936, etc.) averaged into one curve (for women 20 to 34). An additional curve has been computed for more recent years in which information for 20- to 25-year-old mothers was not available. These

Figure 5.8.
Average Completed Fertility (at Age 40–44) of American Mothers Who Were Age
20–34 or 25–34 in the Year of Birth of the Test Takers, and Verbal and Mathematics
SAT Scores 1951–1952 through 1984–1985. SAT scores are from Eckland (1982) and
personal communication with the College Entrance Examination Board. Fertility data
are derived from Heuser (1976) and National Center for Health Statistics (1980).
curves involve weighting the completed fertility for each age group of women according to the group's importance as a contributor to the reproduction of that year.
It is evident from figure 5.8 that there is a close correspondence between the completed family size of the women who gave birth in each of the years 1934 through 1966 and the SAT scores of the youngsters born in those years. In particular, the family-size curve conforms rather well to the verbal SAT scores. However, for the most recent dates, family size goes down more sharply and sooner than the SAT scores rise. This difference may result from differen-

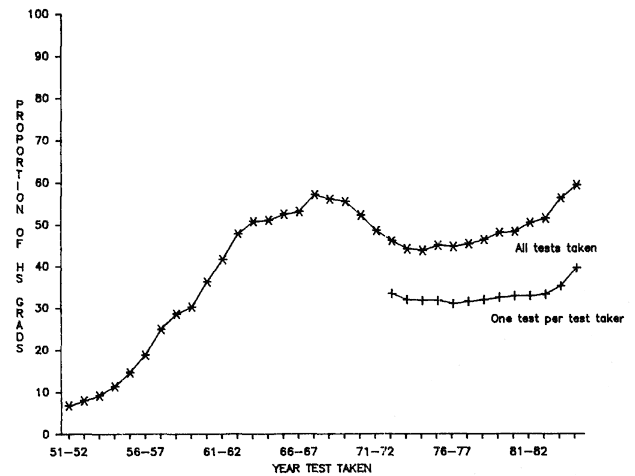
Figure 5.9.
Percentage of High School Graduates Who Took SATs in Each of
the Years 1951–1952 through 1984–1985. (The complete series is based on
all SATs taken in a given year regardless of grade level of the test taker,
or whether test takers repeated the test in that year. These data are from
a personal communication with the Educational Testing Service. The
series from 1971–1972 onward is based on only one test per student.
These data are from Educational Testing Service [1984] and personal
communication with the CEEB. Data on high school graduates are
from Plisko and Stern [1985].)
tial selection bias among the SAT test takers, to be discussed in a moment. At this point, we may simply emphasize that an understanding of the inverse relation of the SAT scores and the family size of the test takers does not require a resort to data on birth order.
Although the family size and SAT curves are tantalizingly congruent over much of the period in question, one should be skeptical about overinterpreting this apparent association. SAT takers have been a highly variable percentage of high school graduates over the years as may be seen from figure 5.9. Prior to 1971, we have no direct information on the socioeconomic biases involved and none concerning family-size selection over time. Indirect analysis, using
1960 Project Talent data and 1972 National Longitudinal Survey data, has suggested that the socioeconomic backgrounds of the test takers declined during the 1960s so that SES compositional effects on the SAT declines during that period appear clear (Eckland 1982). Some SES compositional effects appear to have continued during the 1970s, but these are not sufficient to explain the poor results after 1973. It is possible, therefore, that family size (itself correlated with SES) may be implicated. When we bear in mind, however, that high school graduates are themselves selected by sibsize, the further selection among high school graduates of SAT takers makes it remarkable (perhaps too remarkable!) that the family size/SAT curves conform as well as they do. Rather than overstating the importance of this congruence, we would caution that widespread interest in the causes of variability in SAT scores should lead to the acquisition of actual information on the socioeconomic background and family sizes of the SAT takers.