The Role of Riparian Vegetation in Channel Bank Stability
Carmel River, California[1]
G. Mathias Kondolf and Robert R. Curry[2]
Abstract.—A narrow channel with well-vegetated banks developed on the lower 15 km. of the Carmel River by 1939, and by 1960 this condition had extended to the entire lower 24 km. of river channel. Noticeable die-off of riparian trees near water supply wells began in the 1960s and intensified during the 1976–1977 drought. Substantial bank erosion occurred during the winters of 1978 and 1980 along reaches which had suffered loss of bank-stabilizing riparian trees.
Setting
The Carmel River, Monterey County, drains a 660-sq. km. (255-sq. mi.) basin. Rising in the rugged Santa Lucia Mountains and passing through the 24-km. (15-mi.) long alluvial Carmel Valley, it ultimately discharges into the Pacific Ocean near Carmel, Monterey County (fig. 1 and 2). This alluvial reach is sub-divided by a bedrock constriction and narrowing of the valley (the "Narrows") into a lower 16-km. (10-mi.) reach (the "Lower Carmel"), and a middle 8-km. (5-mi.) reach (the "Middle Carmel"), with "Upper Carmel" indicating the segment above San Clemente Dam (fig. 3). Average annual rainfall ranges from 1,040 mm. (41 in.) in the mountainous headwaters to 430 mm. (17 in.) in the lower valley. While the upper river is perennial, the lower river is intermittent, with flows typically from December through June. Near the river mouth, average discharge is 2.7 cms (97 cfs), and the bankfull discharge (here, the 2.4-year flow) is 79.2 cms (2,800 cfs).
Figure l.
Vicinity map of the Carmel River basin
(US Army Corps of Engineers 1967).
Two water supply dams, the Los Padres and San Clemente dams (fig. 2), together impound about 3,000 acre-feet (AF). The Carmel basin supplies most of the water for the Monterey Peninsula cities of Monterey, Pacific Grove, Seaside, and Carmel. As these areas have grown, demand for water has risen substantially. To meet demand over the past two decades, California-American Water Company (Cal-Am), a private utility, has drawn increasingly upon water supply wells in the alluvium along the Lower and Middle Carmel. Of the total 13,000 AF exported from the basin in 1980, 9,000 AF was diverted from reservoirs, and 4,100 AF was extracted from streamside wells.
In the late 1960s, residents began complaining that vegetation was dying off near the wells in the region near Robinson Canyon Road (Lee 1974). The Carmel Valley Property Owners Association hired a forestry consultant to study the vegetation problem; he concluded that lowered water tables near the wells had killed the vegeta-
[1] Paper presented at the California Riparian Systems Conference. [University of California, Davis, September 17–19, 1981].
[2] G. Mathias Kondolf is in the Department of Geography and Environmental Engineering, Johns Hopkins University, Baltimore, Maryland. Robert R. Curry is a member of the Board of Environmental Studies, University of California, Santa Cruz, Calif.
Figure 2.
General map of the Carmel River basin (US Army Corps of Engineers 1967).
tion (Zinke 1971). Cal-Am hired another consultant; he acknowledged that lowered water tables near the wells affected vegetation, but stated that the effect was simply to accelerate the "natural succession" of plants (Stone 1971).
The drought of 1976–1977 imposed additional demand on streamside wells. The die-off of mesic riparian plants was significant between Schulte and Robinson Canyon roads and above the Narrows—two areas of substantial groundwater withdrawal. The high flows of 1978 and 1980 resulted in severe bank erosion, primarily in areas where bank-stabilizing vegetation had been affected.
River History
River course and pattern changes were documented by comparing maps of the Carmel River from 1858 to 1945 and aerial photos of the river from 1939 to 1980.
Changes in Course
Historical changes in the Carmel River from Garland Ranch to the mouth are plotted in figures 4 and 5. The 1858 and 1882 channels were determined from boundary surveys. The 1911 course appears on the Monterey 15' USDI Geological Survey topographic map (quad) of 1913 (based on surveys in 1911–12), and the 1945 course is taken
Figure 3.
Location map, Middle and Lower Carmel River (base from Monterey, Seaside, and Carmel Valley 7.5' quads).
from the Monterey and Seaside 7.5' quads of 1947 (based on aerial photography in 1945). The 1947 maps were photorevised in 1968, but the only mapped revision in the river's course was downstream of Garland Ranch, where a northward bend of the river was eliminated by highway construction.
Comparison of these maps reveals nine localities where lateral channel migrations of 250–500 m. (820–1,640 ft.) occurred during the 87 years between 1858 and 1945. Except for the change near Garland Ranch Park, since the survey of 1911–1912, changes in course have been modest, generally less than 0.2 km. These migrations were gradual changes from 1911 to 1945, unlike the dramatic shifts that were wrought by floods in the preceding years. This is consistent with the observation that most major shifts take place during large floods. No floods comparable to the 1911 event occurred between that year and 1945, nor have they since.
Figures 4 and 5 show changes in the channel reach from San Clemente Dam downstream to Las Garzas Creek. The 1917 channel is plotted from the Jamesburg 15' quad of 1918 (from surveys in 1917). The 1954 course is from the Carmel Valley 7.5' quad of 1956 (compiled from 1954 aerial photography). The lack of dramatic changes comparable to those seen downvalley may be attributed to: 1) the lack of record prior to the 1860 and 1911 floods; and 2) bedrock confinement along much of this reach.
Flood History
The earliest flood on record along the Carmel River was the great statewide deluge of 1862. While no records exist to document the exact magnitude of this flood, it was severe enough to induce the few valley residents to move to higher ground.[3] Most of the great changes in channel course visible between the 1858 and 1882 channels in Rancho Canada de la Segunda probably occurred during this flood.
The next great flood occurred in 1911. An account in the "Monterey Cypress" of 11 March 1911 reported that Fannie Meadows and Roy Martin lost 10 acres and a pear orchard due to lateral migration of the river. Their adjacent properties extended downstream from the present Schulte Road to Meadows Road. The channel shift that consumed their land can be seen by comparing the river course of 1858 with that of 1911 (fig. 4).
[3] Roy Meadows. Personal communication of family history.
Figure 4.
Course changes of the Carmel River, Garland Ranch to mouth.
Figure 5.
Course changes of the Carmel River channel,
San Clemente Dam to Las Garzas Creek. Key:
dashed—1917 channel from 1918 edition
Jamesburg 15' quad; solid—1954 channel,
from 1956 edition Carmel Valley 7.5' quad.
The flood of 1911 was a big flood indeed. Before it was swept away, a staff gauge at the site of the San Clemente Dam indicated a discharge of 480 cms (17,000 cfs). The peak flow has been estimated at 708 cms (25,000 cfs). In 1914 another major flood occurred, but this one was far less destructive. It is not known whether this flood was significantly smaller than the 1911 event, or if it simply caused less disruption because it flowed through a channel pre-adjusted to the large 1911 flow.
No comparable floods occurred in the following decades. The absence of large floods, together with the drop in sediment load resulting from construction of the San Clemente Dam in 1921, served to permit channel narrowing, increased sinuosity, and bed degradation.
Changes in Sinuosity and Gradient
Sinuosity, defined as the ratio of stream channel length to valley length, was computed for several sequential channels. From 1911 to 1945, the reach of river from Garland Ranch to the mouth increased in sinuosity from 1.11 to 1.18. The reach from Sleepy Hollow to Las Garzas Creek experienced an overall increase in sinuosity of 1.05 to 1.09 from 1917 to 1954. Map slopes computed for the 1911 and 1945 channels from Garland Ranch to the mouth show a decrease from 0.0034 in 1911 to 0.0029 in 1945. The overall increase in sinuosity and decrease in gradient suggest that the Carmel River stabilized in the aftermath of the 1911 flood.
Changes in Channel Pattern and Form
Channel pattern (pattern in plan view, e.g., meandering, braided) and form (cross sectional shape, e.g., narrow, wide) of the Lower and Middle Carmel River have changed dramatically since the last major flood and construction of the dams. No doubt, the entire Lower and Middle Carmel were strongly modified by the 1911 and 1914 floods. The resulting channel is probably well represented by the historical photos (ca. 1918) from the Slevin Collection (University of California, Berkeley). These photos of the
river, at and downstream of the Narrows (fig. 6 and 7), show a wide, sandy channel, reflecting the recent passage of a major flood.
By 1939, the Lower Carmel had developed a narrower, more sinuous channel while the Middle Carmel retained much of its braided character, as evidenced by aerial photography of 1939. Figure 7 shows the area pictured in figure 6 as it subsequently appeared in the 1930s. By this time, a riparian forest had developed along virtually all of the Lower Carmel River, narrowing the channel. Aerial photographs taken in 1965 show further development of vegetation and narrowing of the channel.
This change in channel pattern occurred concurrently with the increase in sinuosity and decrease in gradient apparent by 1945. Together, they indicate that the Lower Carmel had adjusted to the absence of major floods and the cut-off of 60% of its previous sediment load (based on drainage area upstream of San Clemente Dam). These adjustments included channel narrowing with encroaching vegetation, an increase in sinuosity, and reduction of gradient through incision.
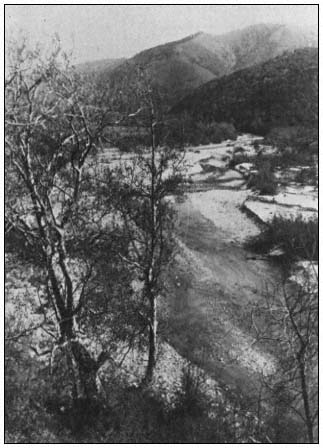
Figure 6.
Carmel River channel, 1918, viewed from right bank
upstream from location of present Robinson Canyon
Road bridge, looking upstream. (Slevin Collection,
Bancroft Library, University of California, Berkeley.)
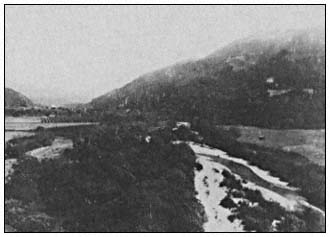
Figure 7.
Carmel River channel, 1930s, viewed from right bank
upstream from location of present Robinson Canyon
Road bridge. View upstream. Contrast this with figure 6,
essentially the same view, taken in 1918. (Pat Hathaway
Photograph Collection, Pacific Grove, California.)
Similar adjustments have been documented in other rivers in response to the absence of floods or the construction of upstream dams (Leopold etal . 1964).
By 1939, the Lower Carmel had incised about 4 m. into deposits of the 1911 flood, leaving a 4 m. terrace. Some of this incision is visible when figures 6 and 7 are compared. The flat surface of sand and gravel to the right of the river in figure 6 is the 1911 channel floor. By 1918 (when figure 6 was taken), the channel had cut down about 2 m., and willows had begun to invade the low terrace. By the 1930s (when figure 7 was taken), the channel had incised about 4 m. The 1911 channel floor appears as the terrace in figure 7, with a farmed field and small building on it. This 1911 terrace can be confidently traced along much of the Lower Carmel on the basis of morphology and historic changes in course. Figure 8 shows the 1911 terrace (Qt1) and higher terraces. There is evidence that Qt2A may be the 1862 flood terrace, but otherwise the higher terraces are of unknown age.
Above the Narrows along the Middle Carmel, similar adjustments took place, but they occurred later. The aerial photos taken in 1939 show the scars of numerous anastamosing channels in the Middle Carmel. By 1971, most of these scars no longer appeared, as exemplified by the reach from Boronda Road to Robles del Rio (fig. 9). Accompanying this change in pattern was degradation of the bed. Sequential cross sections show 1.5 m. (5 ft.) of degradation under the Boronda Road bridge from 1946 to 1980.
By the 1960s, most of the Lower and Middle Carmel had developed a narrow, sinuous, well-vegetated course. It bears repeating that these
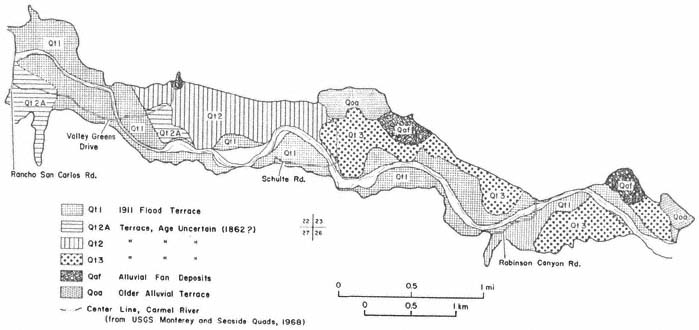
Figure 8.
1911 flood terrace and other Quaternary deposits of the Carmel River, from the Narrows to Rancho San Carlos Road.
(Based on reconnaissance-level study of aerial photographs, historic ground photographs, and historic changes in course.)
Figure 9.
Pattern changes, Middle Carmel River, from Boronda Road to Esquiline Road at Robles Del Rio.
(Data from aerial photographs of 1939 and 1971, Map Library, University of California, Santa Cruz.)
conditions developed only in the absence of major floods and, further, may have depended upon a cut-off of upstream sediment by the dams.
Additionally, before their suppression by European settlers, fires occurred regularly in the upper Carmel basin, periodically leading to vastly greater sediment yields. The accumulation of sediment in the Los Padres Reservoir after the Marble-Cone fire of 1977 was dramatic. The capacity of this reservoir decreased from 3,200 AF upon closure in 1947 to 2,600 AF in 1977, a loss of storage of 600 AF in 20 years. Consequent to the Marble-Cone fire and the high flows in the ensuing winter, the reservoir's capacity decreased to 2,040 AF by the end of 1978. Thus, in one year the reservoir lost 560 AF of storage.[4] This post-fire sedimentation rate was nearly 20 times greater than the pre-fire rate.
Prior to dam construction, all this sediment passed through to the Middle and Lower Carmel. It is probable that a wide, sandy channel would have developed in order to transport these high sediment loads. However, it is notable that the sediment contributed by the recent bank erosion has passed through the lowermost reaches of the Carmel (Valley Greens Drive downstream) without destabilizing that narrow channel. The stability of this lowermost reach may be due, in part, to the automobile bodies and riprap emplaced within the banks or to the extensive irrigating of streamside golf courses. Without these stabilizing influences, the channel might have widened in response to the higher load. Alternatively, such a narrow channel in its natural state, protected only by bank vegetation, may be able to pass these high loads without disruption of its existing geometry. In this latter case, the observed changes in channel pattern, form, gradient, and sinuosity may best be ascribed to recovery from the major floods of 1911 and 1914.
Recent Bank Erosion
Peak discharges over the winters of 1978 and 1980 were 208 cms (7,360 cfs) and 168 cms (5,920 cfs) respectively. These flows resulted in massive bank erosion along parts of the Middle and Lower Carmel. Most severely affected was the region upstream of Schulte Road Bridge. Here the channel at bankfull discharge (defined as the flow with a recurrence interval of 2.4 years on an annual maximum series) increased in width from 13 m. (43 ft.) to 35 m. (115 ft.) in two years. This increased the width: depth ratio from 15 to 113. Aerial photographs show the changing aspect of this reach from 1939 to 1980. In 1939 and 1965, a narrow channel fringed by dense riparian vegetation is visible (fig. 10a and b). The 1977 photo indicates no obvious change in the channel, but does show a marked thinning of streamside trees (fig. 10c). The 1980 photo exhibits a major widening of the channel, most of which occurred during one storm in the winter of 1980 (fig. 10d).
Throughout the Middle and Lower Carmel, the river banks are composed of unconsolidated sands and gravels, which lack cohesive strength in the absence of binding vegetation. These banks offered no resistance to lateral erosion. A comparison of surveys and aerial photographs of 1965 and 1980 from Schulte Bridge upstream 0.6 km. (0.4 mi.) indicates that 100,000 cu. m. of bank material was consumed by the river, mostly during the winter of 1980. The resulting channel is wide and floored by sand and gravel (fig. 11).
The die-off of bank vegetation and consequent lateral erosion appear to be coincident with lowering of water tables below the root zone of trees. Downstream of Valley Greens Drive, where no producing wells were located, the riparian vegetation remained largely unaffected during the drought of 1976–77. The channel there remained stable during both the 1978 and 1980 winters. A plot of water table elevations for the drought, i.e., drawdown (October 1977), and post-drought, fully recharged conditions (April 1978) shows far less drawdown in this lowermost reach of the Carmel (fig. 12). Figure 12 shows that along much of the Middle and Lower Carmel the water table was drawn down about 10 m. This is generally considerd to be below the root zone of riparian willows (Zinke 1971). The depression of the water table upstream of Schulte Road is due to the drawdown created by wells in the highly permeable alluvium of the Carmel Valley. While the drought of 1976–1977 certainly exacerbated the drawdown problem, the drought alone cannot explain the fact that severe drawdown, vegetation die-off, and subsequent bank erosion affected certain areas only.
Erosion Mitigation
Individual efforts to control bank erosion along the Carmel range widely in cost and effectiveness. Riprap has been used with mixed results. Among the materials used for riprap on the Carmel are ornamental dolomite, concrete blocks, and rubble from Cannery Row. Gabions and pervious fences with rock fill have been used successfully. Some landowners are attempting to establish willows on their eroding banks, but many of these seedlings are not adequately irrigated and die. One of the most popular revetment strategies is emplacement of automobile bodies in the eroding banks (fig. 13). The individual bank protection efforts thus far are uncoordinated and may, in some cases, have deleterious downstream effects. The government agency charged with managing the area's water resources, the Monterey Peninsula Water Management District, is now considering an integrated management plan for the Carmel River.
[4] B. Buel. 1981. Monterey Peninsula Water Management District. Personal communication.
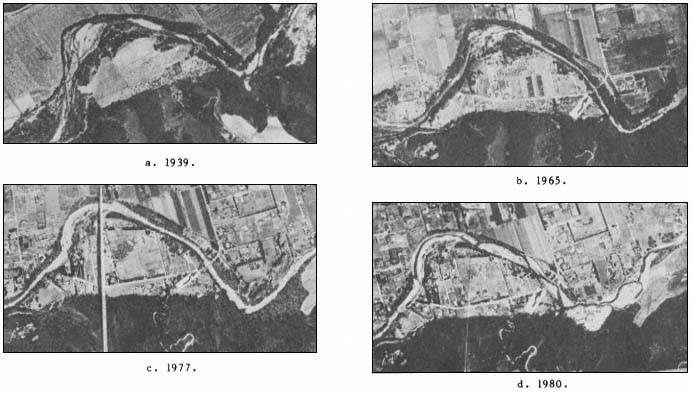
Figure 10.
Aerial photographs of the Carmel River near Schulte Road bridge. Arrows point to bridge.
(Aerial photograph collection, Monterey County Flood Control, Salinas.)
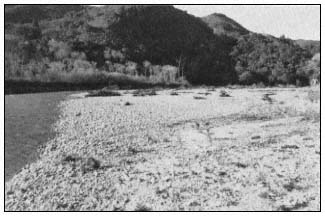
Figure 11.
Channel of the Carmel River upstream of Schulte Road bridge,
November 1980. View downstream from about 0.5 km (0.3 mi.)
upstream of bridge (photograph by the authors).
Redesigning the Carmel River
The "river-training" experience of New Zealand engineers provides a possible model for restoring unstable reaches of the Carmel (Nevins 1967). Their procedure is to determine "design geometries" from stable reaches of a river and to reengineer unstable reaches to these design geometries. Cross-sectional geometry, sinuosity, and gradient of the stable reaches are duplicated as closely as possible in the unstable reaches. Initially, bank protection works are used to stabilize the banks and willows are planted; once fully established, the willows are expected to become the principal bank-stabilizing agent. The reengineered channels in New Zealand have remained stable in all but very high flows. If large discharges disrupt the design channels, these reaches can be reengineered to design specifications at a lower cost than the initial work (ibid .).
For the Carmel River, the stable reaches downstream of the disturbed reaches can serve as design geometries. In figure 14, cross sections are plotted for an eroded reach upstream of
Figure 12.
Water table elevations, drought and recharged conditions.
(Date from Monterey County Flood Control well level records.)
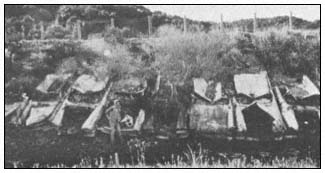
Figure 13.
Automobile bodies used as bank revetment, downstream
of Meadows Road (photograph by the authors).
Schulte Road (section 37) and for a stable reach about 1.5 km. (1 mi.) downstream (section 45). No tributaries enter between these sections, so discharge remains essentially constant. Yet the present-day geometries are vastly different. Surveys by the US Army Corps of Engineers in 1965 (US Army Corps of Engineers 1967) indicate that the reach encompassing section 37 was characterized by a geometry closely resembling that of the present-day section 45. Thus, a design-stable geometry for section 37 could be drawn largely from the existing geometry at section 45. Certain corrections would have to be made for difference in gradient, sinuosity, and bed material size between these reaches. Fortunately, many of these parameters are well documented for the stable, pre-disturbance Carmel River.
The success of a river-training program depends, in part, on a favorable flow regime in the years following channel redesign. A major flood (e.g., a 20- to 30-year event) in the first few years following the redesign may take out the new banks before they have been stabilized by vegetation. A catastrophic flood (e.g., a 75- to 100-year event) will probably carve a new channel for itself regardless of how well vegetated the existing banks might be (Nevins 1967). Applying these concepts to the Carmel, we might expect that a flow comparable to the 1980 event within the first five-to-ten years following channel redesign could take out the design banks. A flow comparable to the 1911 flow could take out the design banks whether vegetated or not.
Summary
The lower 24-km. (15-mi.) reach of the Carmel River is alluviated and is divided by a bedrock constriction into a lower 16-km. (10-mi.) reach and a middle 8-km. (5-mi.) reach. This alluvial reach of the river has experienced major changes in channel course, pattern, and form over the past 130 years. Major floods in 1862 and 1911 changed the river's course by up to 500 m. (1,640 ft.). After 1914, the absence of severe floods, coupled with dam construction upstream, led to a change from a wide, braided channel to a narrow, more sinuous channel. Accompanying this change was a decrease in overall gradient in the lower reach from .0034 to .0029 between 1911 and 1945.
By 1939, the date of the first coverage by aerial photography, the lower reach had developed a narrow, sinuous channel with well-vegetated banks that remained stable for most of the next four decades. The middle reach of the river, however, displayed a predominantly wide, braided
Figure 14.
Channel cross sections of the Carmel River near Schulte Road bridge. Section
37: 250 m. (820 ft.) upstream of bridge; section 45: 1,520 m. (5,000 ft.) downstream
of bridge. Discharge is essentially constant. (From field surveys by the authors).
pattern. Between 1939 and 1971, this middle reach developed a single thread channel and downcut up to 1.5 m. (5 ft).
As groundwater withdrawal from streamside wells increased in the 1960s, residents began complaining that riparian trees were dying near the wells. During the 1976–1977 drought, lowered water tables were associated with substantial die-off of riparian trees. The death of these bank-stabilizing trees is associated with significant lateral erosion that occurred during the winters of 1978 and 1980. Upstream of the Schulte Road bridge, the river's bankfull channel increased in width from 13 m. to 35 m., increasing the width:depth ratio from 15 to 113. Downstream, the channel remained stable despite passage of the sediment derived from the eroding reaches.
Individual efforts to control bank erosion have included planting of willows and emplacement in banks of automobile bodies and riprap. The mixed success of these efforts demonstrates that a coordinated program is needed to manage the river. Most promising as a model for the Carmel is the experience of New Zealand engineers in "river training." Their procedure is to determine design geometries from stable reaches and then redesign disturbed reaches to the design geometry. After initial stabilization using engineering works, planted willows are expected to serve as the primary stabilizing agents.
Acknowledgments
This study was supported by a contract with the Monterey Peninsula Water Management District. Our thanks to the District staff for generous assistance in every phase of the study. We are also grateful for the invaluable cooperation of Monterey County Flood Control, the California Department of Fish and Game, Monterey Office, and the US Army Corps of Engineers, San Francisco District. To the friends who helped with the field work, our thanks.
Literature Cited
Lee, E.B. 1974. A summary report of facts, analysis, and conclusions relating to the Monterey Peninsula water supply problems. Public Utilities Commission Case 9530. 23 p. Unpublished report.
Leopold, L.B., W.G. Wolman, and J.P. Miller. 1964. Fluvial processes in geomorphology. 522 p. W. Freeman and Company, San Francisco, Calif.
Nevins, T.H. 1967. River training—the single-thread channel. New Zealand Engineering 24 (Dec. 15, 1967):367–373.
Stone, E. 1971. The dynamics of vegetation change along the Carmel River. Unpublished report to the California-American Water Company, March, 1971. 54 p.
US Army Corps of Engineers. 1967. Flood plain information on Carmel River, Monterey County, California. 36 p. US Army Corps of Engineers, San Francisco District, San Francisco, Calif.
Zinke, P. 1971. The effect of water well drawdown on riparian and phreatophyte vegetation in the Middle Carmel Valley. Unpublished report to the Carmel Valley Property Owners Association, Carmel Valley, Calif. February, 1971. 27 p.