Vector Fields
A vector field can be completely represented by means of three sets of charts, one of which shows the scalar field of the magnitude of the vector and two of which show the direction of the vector in horizontal and vertical planes. It can also be fully described by means of three sets of scalar fields representing the components of the vector along the principal coordinate axes (V. Bjerknes and different collaborators, 1911). In oceanography, one is concerned mainly with vectors that are horizontal, such as velocity of ocean currents—that is, two-dimensional vectors.

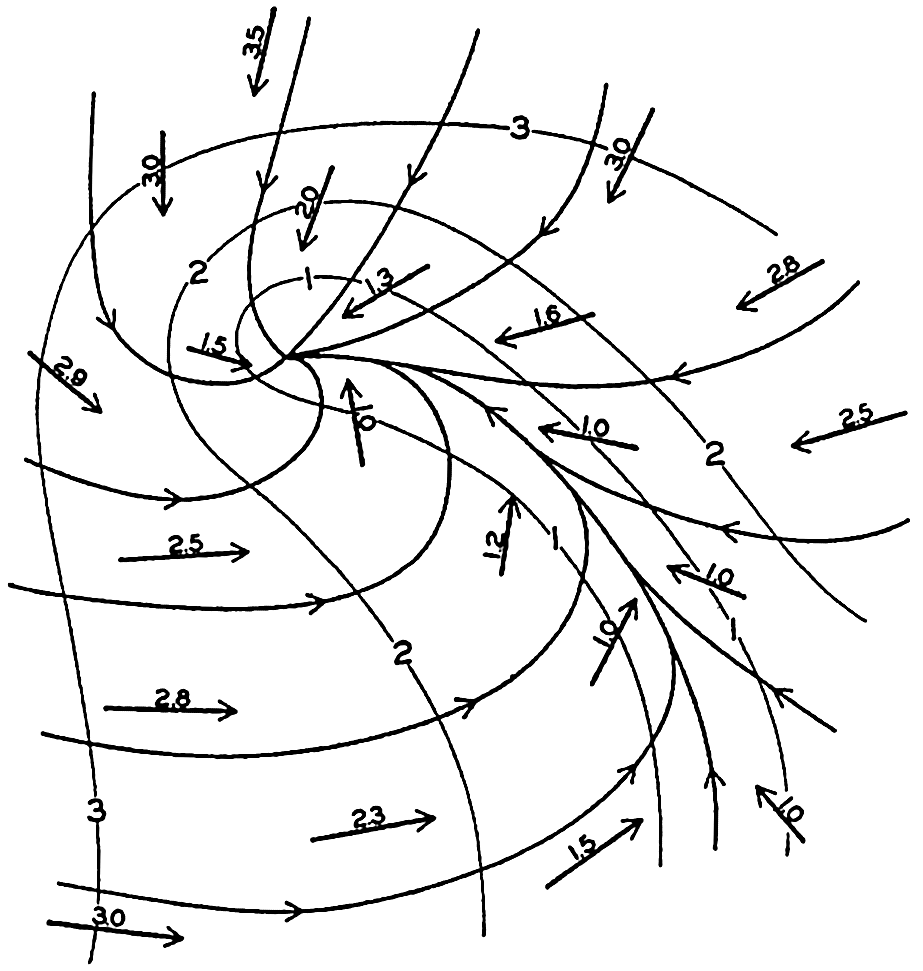
Representation of a two-dimensional vector field by vectors of indicated direction and magnitude and by vector lines and equiscalar curves.
Vector lines cannot intersect except at singular points or lines, where the magnitude of the vector is zero. Vector lines cannot begin or end within the vector field except at singular points, and vector lines are continuous.
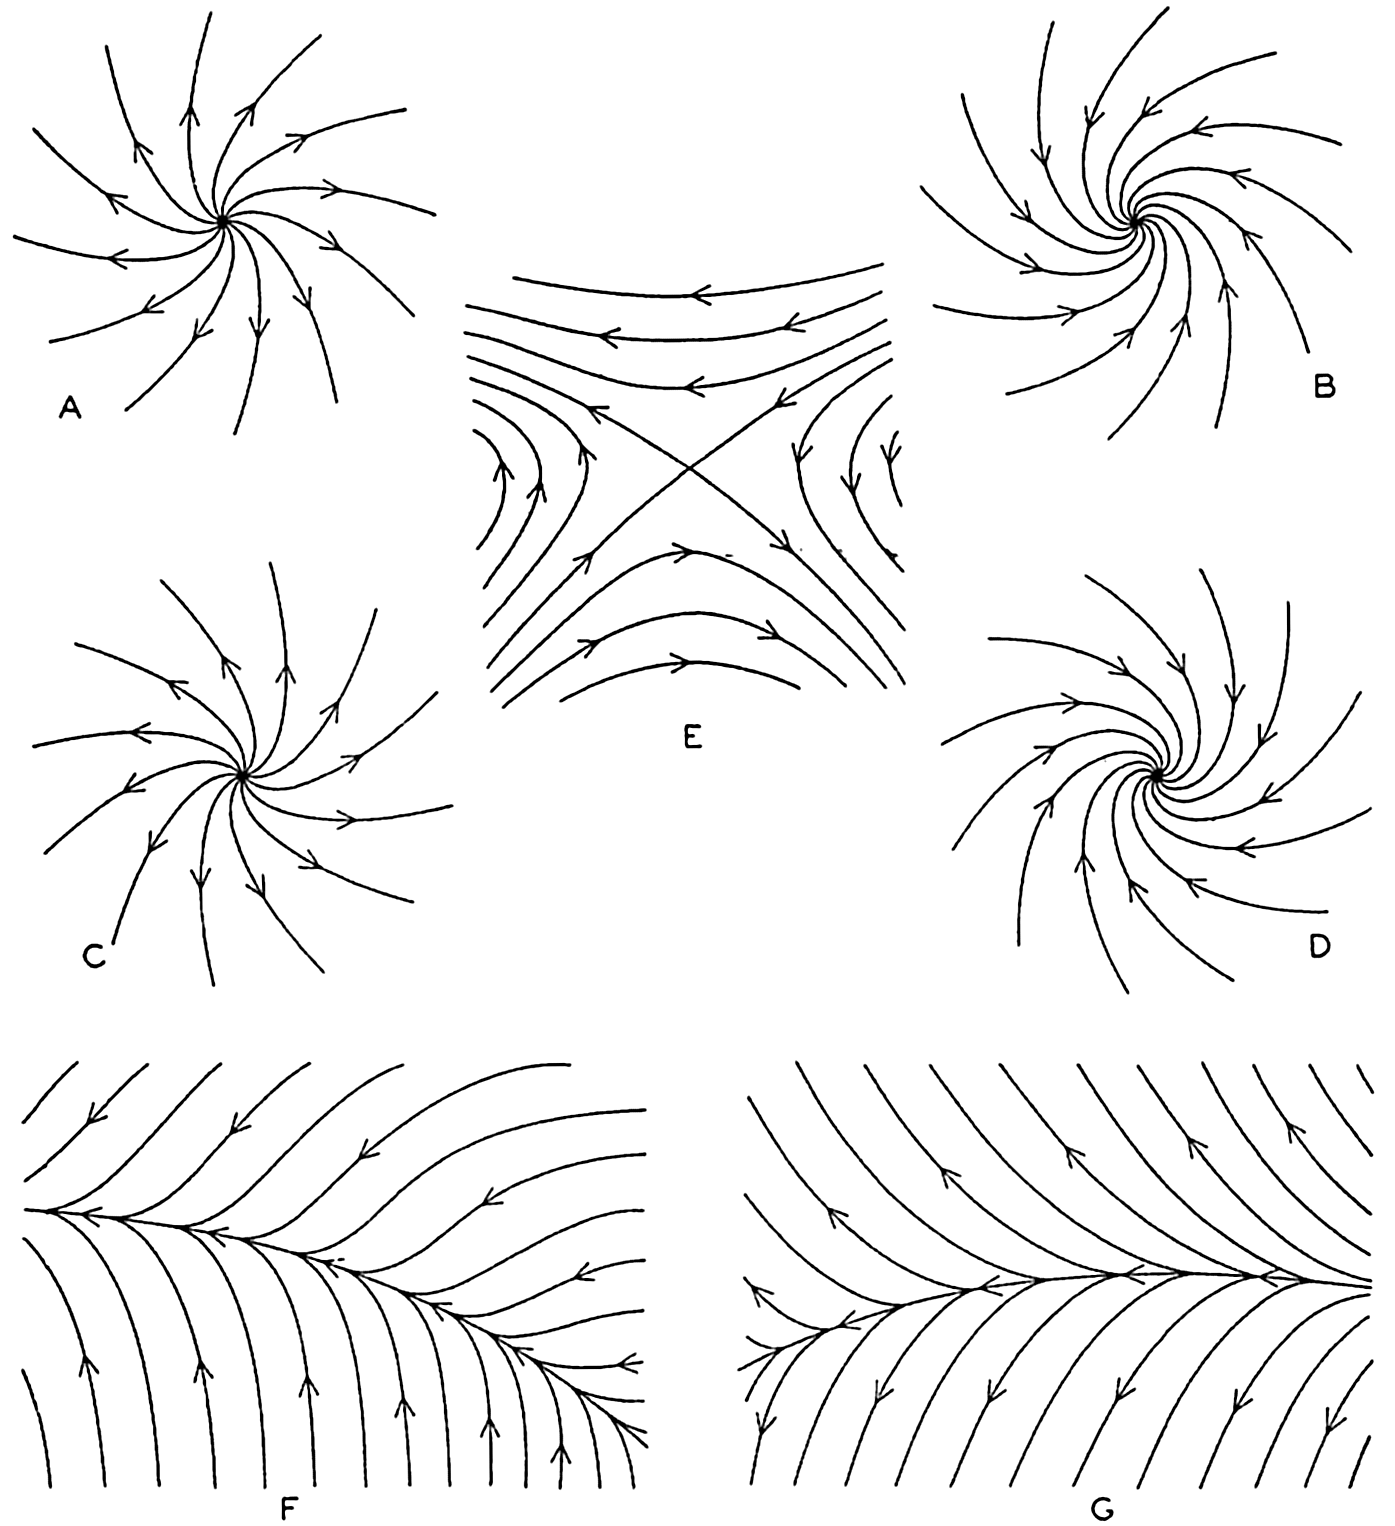
The simplest and most important singularities in a two-dimensional vector field are shown in fig. 96: These are (1) points of divergence (fig. 96A and C) or convergence (fig. 96B and D), at which an infinite number of vector lines meet; (2) neutral points, at which two or more vector lines intersect (the example in fig. 96E shows a neutral point of the first order in which two vector lines intersect—that is, a hyperbolic point); and (3) lines of divergence (fig. 96F) or convergence (fig. 96G), from which an infinite number of vector lines diverge asymptotically or to which an infinite number of vector lines converge asymptotically.
It is not necessary to enter upon all the characteristics of vector fields or upon all the vector operations that can be performed, but two important vector operations must be mentioned.

Singularities in a two-dimensional vector field. A and C, points of divergence; B and D, points of convergence; E, neutral point of first order (hyperbolic point); F, line of convergence; and G, line of divergence.
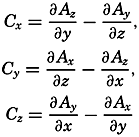
Assume that a vector A has the components Ax, Ay, and Az. The scalar quantity

The vector which has the components

Two representations of a vector that varies in space and time will also be mentioned. A vector that has been observed at a given locality during a certain time interval can be represented by means of a central vector diagram (fig. 97). In this diagram, all vectors are plotted from the same point, and the time of observation is indicated at each vector. Occasionally the end points of the vector are joined by a curve on which the time of observation is indicated and the vectors themselves are omitted. This form of representation is commonly used when dealing with periodic currents such as tidal currents. A central vector diagram is also used extensively in pilot charts to indicate the frequency of winds from given directions. In this case the direction of the wind is shown by an arrow, and the frequency of wind from that direction is shown by the length of the arrow.

Time variation of a vector represented by a central vector diagram (left) and a progressive vector diagram (right).
If it can be assumed that the observations were made in a uniform vector field, a progressive vector diagram is useful. This diagram is constructed by plotting the second vector from the end point of the first, and so on (fig. 97). When dealing with velocity, one can compute the displacement due to the average velocity over a short interval of time. When these displacements are plotted in a progressive vector diagram, the resulting curve will show the trajectory of a particle if the velocity field is of such uniformity that the observed velocity can be considered representative of the velocities in the neighborhood of the place of observation. The vector that can be drawn from the beginning of the first vector to the end of the last shows the total displacement in the entire time interval, and this displacement, divided by the time interval, is the average velocity for the period.